Motion Graphs Learning objectives Interpret distancetime graphs Calculate

Motion Graphs Learning objectives: • Interpret distance-time graphs • Calculate speed using a distance-time graph Starter: Reuben cycled his bike a distance of 850 m, it took him 10 minutes. What was is speed in m/s?

What is a distance-time graph? • distance-time graph shows the distance something travels over a certain time. • the slope or gradient of the distance-time graph shows the speed. • steeper the gradient, the faster the speed. Think > Pair > Share: What does the horizontal line on the graph show?

A distance-time graph Phil slows down as he travels round a corner. Phil sets off from the start line This graph shows Phil’s journey around a race track. The line shows how far he travelled for each second of the journey. Phil accelerated to beat his component to the finish line. Phil pulls in at a pitstop to get his wheel changed.

Quick Check 1. Between 0 -10 and 40 s 60 s Phil’s car is travelling the fastest. How do we know from the graph? 2. Using the equation, speed = distance/time, calculate the speed of Phil’s car in 0 -10 s and 40 s-60 s. 3. How would you describe the motion of Phil’s car between 30 s – 40 s?

Self-assessment: 1. The slope or the gradient is the steepest. 2. Speed = distance/time, Speed = 300 m/10 s = 30 m/s speed = 600 m/20 s = 30/s 3. Between 30 s – 40 s, Phil has not moved anywhere so he is stationary.

Task: Watch the video on acceleration and answer the following questions: https: //www. youtube. com/watch? v=J 3 Sd. Zw. Mc. Wh. A a) b) c) d) e) Define the term ‘acceleration’ An increase in acceleration = _______ acceleration A decrease in acceleration = ______ What is the calculation for acceleration? A person starts walking at 0 m/s and after 6 seconds is walking at 5 m/s, what is the acceleration of the walker? f) A car speeds up from 22 m/s to 26 m/s in 2 seconds. What is the acceleration of the car?
 b) c) d) Acceleration = rate at which velocity changes. An increase")
Self-assessment: a) b) c) d) Acceleration = rate at which velocity changes. An increase in acceleration = positive acceleration A decrease in acceleration = deceleration Acceleration = Final velocity – start velocity e) Acceleration of the walker = 5 m/s – 0 m/s = 0. 83 m/s 2 6 s f) Acceleration of the car = 26 m/s – 22 m/s = 2 m/s 2 2 s
")
Exam-style Question Task: Use the distance-time graph provided to complete the following tasks: a) Calculate the speed Lucy is travelling between the following points: A – B: B – C: E – F: D – E: C – D: F – G: b) Between which points is Lucy travelling the fastest? Between which points is Lucy travelling the slowest? Between which points is Lucy stationary?
 F G 1, 100 1, 00 900 800 700 E 600 D")
Distance (m) F G 1, 100 1, 00 900 800 700 E 600 D C 500 400 300 - B 200 100 0 - A 0 10 20 30 40 50 60 70 80 90 100 Time (s)
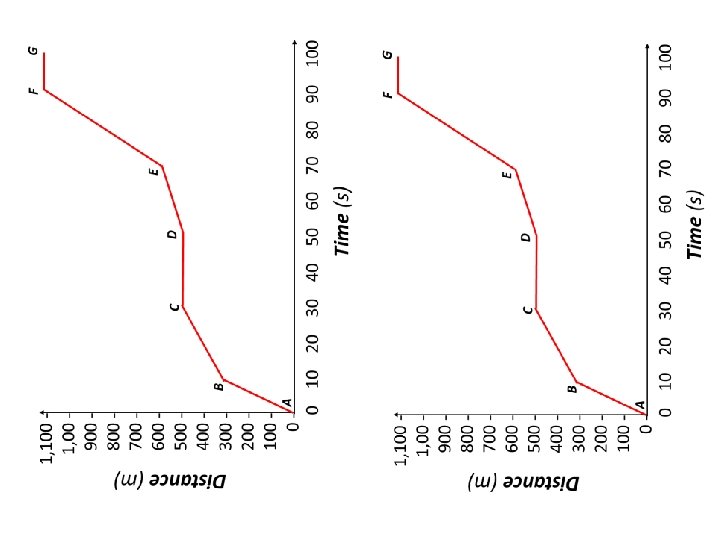

Self-assessment: • • • A – B: B – C: C – D: D – E: E – F: F – G: 300 m/10 s = 30 m/s 200 m/20 s = 10 m/s 0 m/20 s = 0 m/s 100 m/20 s = 5 m/s 500 m/20 s = 25 m/s 0 m/10 s = 0 m/s • Lucy is travelling the fastest between A-B. • Lucy is travelling the slowest between D-E. • Lucy is stationary at points C-D and F-G.
- Slides: 11