Motion Graphs DisplacementTime Stationary VelocityTime V S t


- Slides: 30


Motion Graphs. Displacement/Time Stationary Velocity/Time V S t Uniform Velocity a V S t t S a V t Slope = Velocity t t t Const’ Accel’n Acceleration/Time a t t Slope = Accel’n Area = Distance travelled Area = Velocity

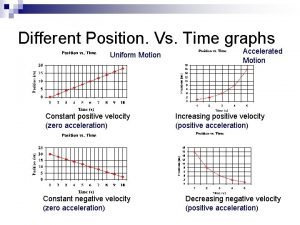
Displacement-Time Graphs • Displacement is on the y-axis • Time is on the x-axis • Slope is the velocity

Displacement-Time Graphs Object is stationary S t

Displacement-Time Graphs Object moving with uniform velocity

Displacement-Time Graphs Object moving with uniform velocity

Displacement-Time Graphs Object moving with uniform velocity

Displacement-Time Graphs

Features of distance-time graphs Distance (metres) 50 4) Diagonal line 2) Horizontal line = object not moving downwards = object moving back towards start with constant speed 40 30 20 10 0 Time (s) 20 1) Diagonal line = object moving away with constant speed 40 60 80 100 3) Steeper diagonal line = object moving away with constant speed but faster

40 30 Distance (metres) 20 10 Time/s 0 20 40 60 Questions 1. What is the speed during the first 20 seconds? 2. How far is the object from the start after 60 seconds? 3. What is the speed during the last 40 seconds? 4. When was the object travelling the fastest? 80 100

Questions 1. What is the speed during the first 20 seconds? speed = distance travelled time taken speed = 10 20 0. 5 m/s 2. How far is the object from the start after 60 seconds? 40 metres 3. What is the speed during the last 40 seconds? speed = 40 40 1 m/s 4. When was the object travelling the fastest? Between 40 and 60 seconds, the steepest part of the graph

Displacement-Time Graphs Object moving with uniform acceleration

Velocity-Time Graphs • Velocity is on the y-axis • Time is on the x-axis • Slope is the acceleration • Area is displacement

Velocity • Velocity changes when an object… – Speeds Up – Slows Down – Change direction

Velocity-Time Graphs Object is stationary V t

Velocity-Time Graphs Object moving with uniform velocity • Objects with a constant velocity have no acceleration • This is graphed as a flat line on a velocity time graph.

Velocity-Time Graphs Object moving with uniform acceleration • Objects with a changing velocity are undergoing acceleration. • Acceleration is represented on a velocity time graph as a sloped line.

Velocity-Time Graphs Positive and Negative Velocity • The first set of graphs show an object traveling in a positive direction. • The second set of graphs show an object traveling in a negative direction.

Velocity-Time Graphs Speeding Up and Slowing Down • The graphs on the left represent an object speeding up. • The graphs on the right represent an object that is slowing down.

Velocity-Time Graphs

Speed-time graphs (m/s) 4) Downward line = deceleration 1) Upwards line = acceleration Time (s) 2) Horizontal line = constant speed 3) Steeper line = greater acceleration The area under the line is equal to the distance travelled.

Speed 80 Speed-time graphs (m/s) 60 40 20 0 10 20 30 40 50 Time (s) Working out the distance travelled. First, we have to divide the area under the graph into triangles and rectangles.

Speed 80 Speed-time graphs (m/s) 60 40 3) 20 0 4) 2) 1) 10 5) 20 30 40 50 Time (s) Working out the distance travelled. First, we have to divide the area under the graph into triangles and rectangles. Remember: Area of a triangle = ½ x base x height Area of a rectangle = base x height

Speed 80 Speed-time graphs (m/s) 60 40 3) 20 0 4) 2) 1) 10 5) 20 30 40 50 Time (s) Working out the distance travelled. 1) Distance 2) Distance 3) Distance 4) Distance 5) Distance = = = Area of triangle = Area of square = Area of triangle = ½ x 10 x 20 = 100 m 10 x 20 = 200 m ½ x 10 x 40 = 200 m 10 x 20 = 200 m ½ x 20 x 60 = 600 m Total distance travelled = 100 + 200 + 600 = 1300 m

Velocity (m/s) 80 Velocity-time graphs 60 40 20 0 10 20 30 40 1) How fast was the object going after 10 seconds ? 2) What was the acceleration from 20 to 30 seconds ? 3) What was the deceleration from 30 to 50 seconds ? 50 Time (s)

Acceleration-Time Graphs • Acceleration is on the y-axis • Time is on the x-axis • Area is velocity

Acceleration-Time Graphs Object is stationary a t

Acceleration-Time Graphs Object moving with uniform velocity a t

Acceleration-Time Graphs Object moving with uniform acceleration a t

Free fall from rest:
 Velocity time graph stationary
 5-3 polynomial functions
 Software implementation of state graph
 Speed and velocity
 Graphs that enlighten and graphs that deceive
 Constant leftward velocity
 Interpret the graph below
 Tape charts and motion graphs
 Drawing motion graphs level 3
 Always-on
 Motion graphs warm up answer key
 Http //camillasenior.homestead.com/motion graphs.pdf
 Motion graph story book project
 Describing motion section 1 answer key
 Chapter 2 motion section 1 describing motion answer key
 Motion section 1 describing motion
 The main difference between speed and velocity involves
 Types of motion
 Chapter 2 motion section 1 describing motion answer key
 An object in motion stays in motion
 Simple harmonic motion formulas
 Stationary production
 Embedded markov chain
 Free body diagram of a stationary boat
 Leaching through stationary solid bed
 Hplc chromatography introduction
 Hall thruster
 Arma
Arma What is a cold front simple definition
 Stationary front
 Strict sense stationary

