MOTION Chapter Four Motion 4 1 Position Speed


- Slides: 13
MOTION
Chapter Four: Motion Ø 4. 1 Position, Speed and Velocity Ø 4. 2 Graphs of Motion Ø 4. 3 Acceleration
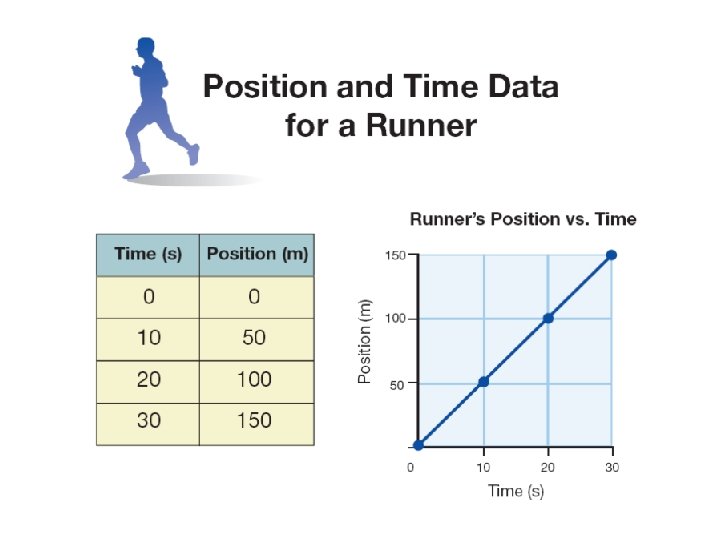
4. 2 Graphs of Motion Ø Constant speed means the speed stays the same. Ø An object moving at a constant speed always creates a position vs. time graph that is a straight line.
4. 2 Graphs of Motion Ø The data shows the runner took 10 seconds to run each 50 -meter segment. Ø Because the time was the same for each segment, you know the speed was the same for each segment.
4. 2 Graphs of Motion Ø You can use position vs. time graphs to compare the motion of different objects. Ø The steeper line on a position vs. time graph means a faster speed.
4. 2 Slope Ø The slope steepness of a line of a is line theisratio measured of the by “rise” finding toits theslope. “run”.
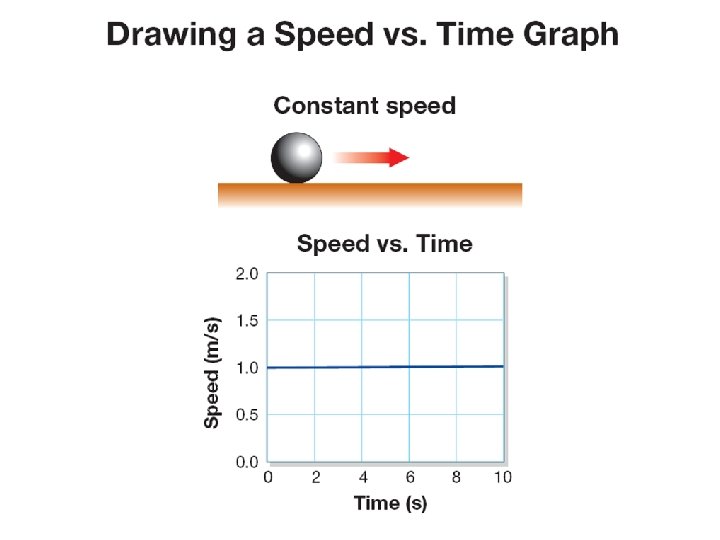
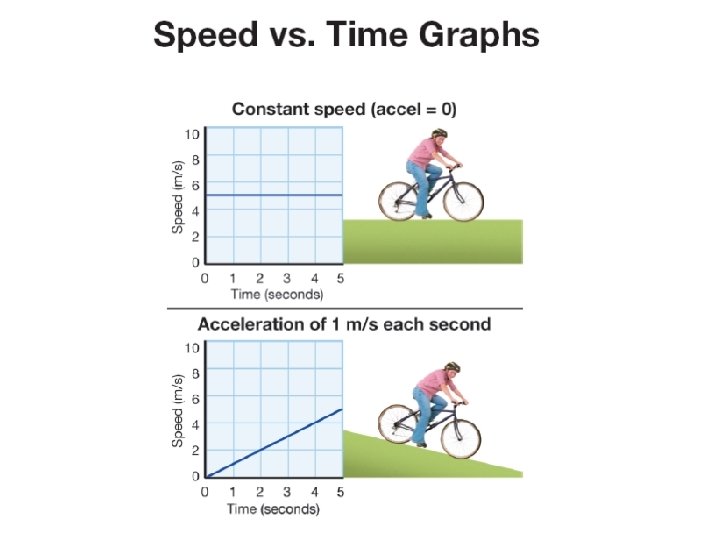
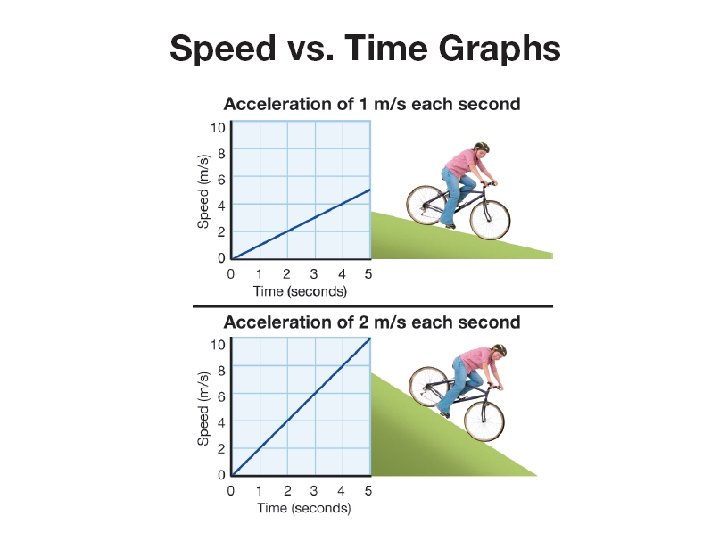
4. 2 Graphs of changing motion Ø Objects rarely move at the same speed for a long period of time. Ø A speed vs. time graph is also useful for showing the motion of an object that is speeding up or slowing down.
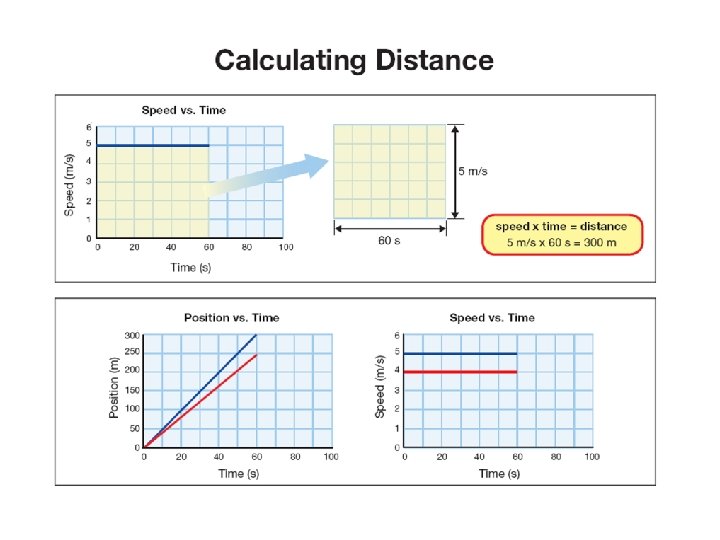
4. 2 Graphs of changing motion Ø Suppose On graph, we draw the alength rectangle is on the to Thethe area of the rectangle is equal to the its speed time and vs. the time height graph isbetween equal tothe thexlength times its height. axis speed. and the line showing the speed.