Motion 4 1 Position Speed and Velocity 4


 changes.")


- Slides: 19
Motion Ø 4. 1 Position, Speed and Velocity Ø 4. 2 Graphs of Motion Ø 4. 3 Acceleration
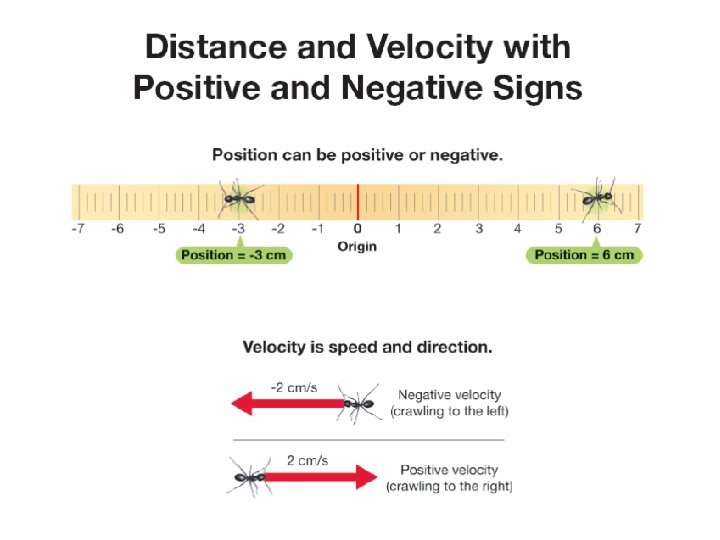
4. 1 Position, Speed and Velocity ØPosition and distance are similar but not the same. ØIf the car moves a distance of 20 cm to the right, its new position will be 70 cm from its origin. Distance = 20 cm New position
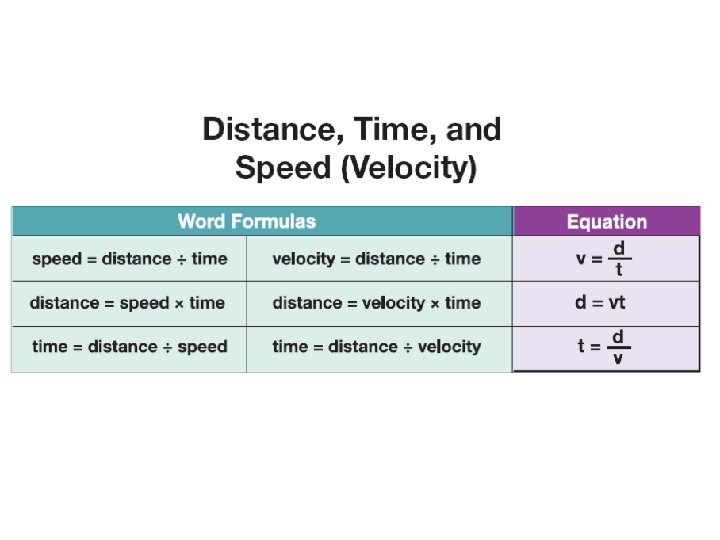
4. 1 Position, Speed and Velocity ØThe variable speed describes how quickly something moves. ØTo calculate the speed of a moving object divide the distance it moves by the time it takes to move.
4. 1 Position, Speed and Velocity ØThe units for speed are distance units over time units. ØThis table shows different units commonly used for speed.
4. 1 Average speed ØWhen you divide the total distance of a trip by the time taken you get the average speed. ØOn this driving trip around Chicago, the car traveled and average of 100 km/h.
4. 1 Instantaneous speed ØA speedometer shows a car’s instantaneous speed. ØThe instantaneous speed is the actual speed an object has at any moment.
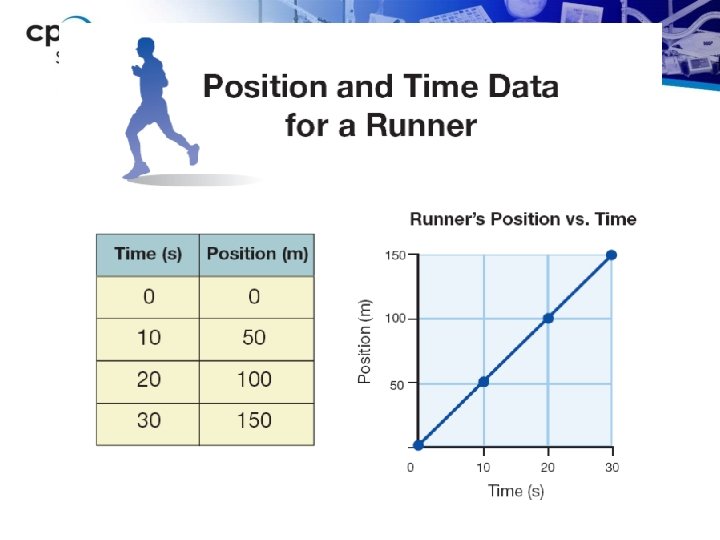
4. 2 Graphs of Motion Ø Constant speed means the speed stays the same. Ø An object moving at a constant speed always creates a position vs. time graph that is a straight line.
4. 2 Graphs of Motion Ø The data shows the runner took 10 seconds to run each 50 -meter segment. Ø Because the time was the same for each segment, you know the speed was the same for each segment.
4. 2 Graphs of Motion Ø You can use position vs. time graphs to compare the motion of different objects. Ø The steeper line on a position vs. time graph means a faster speed.
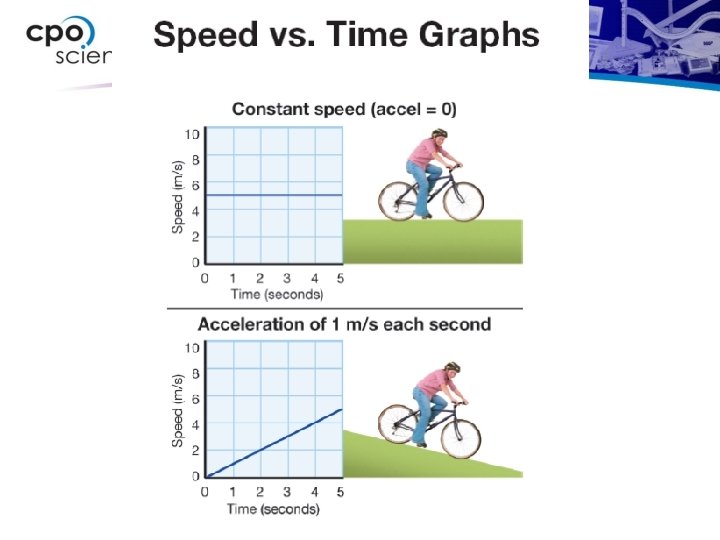
4. 2 Graphs of changing motion Ø Objects rarely move at the same speed for a long period of time. Ø A speed vs. time graph is also useful for showing the motion of an object that is speeding up or slowing down.
4. 3 Acceleration ØAcceleration is the rate at which your speed (or velocity) changes.
4. 3 Acceleration What is the bike’s acceleration?
4. 3 Acceleration ØAcceleration describes how quickly speed changes. ØAcceleration is the change in speed divided by the change in time.
4. 3 Speed and acceleration ØAn acceleration of 20 km/h/s means that the speed increases by 20 km/h each second. ØThe units for time in acceleration are often expressed as “seconds squared” and written as s 2. Can you convert this rate using conversion factors?