Mother Earth mourns Gods Creation is groaning in


 Source: Social Watch -")


")


 (metric tones of carbon)")


- Slides: 32
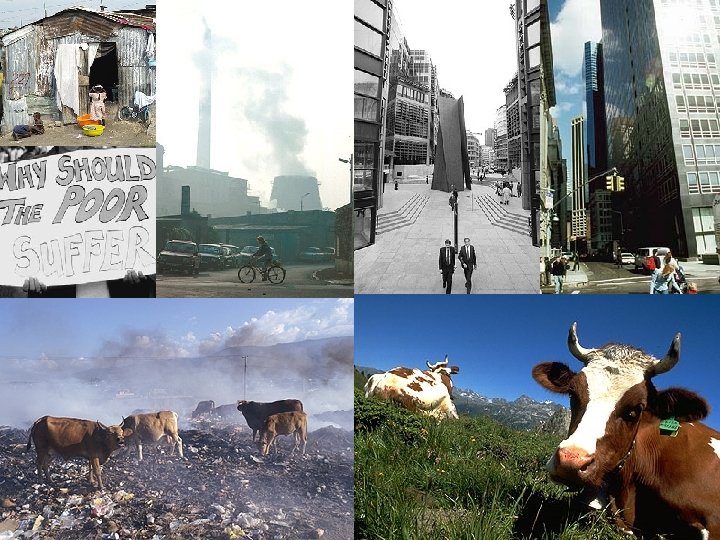
Mother Earth mourns God’s Creation is groaning in pain and in agony, longing to be set free. Along are the cries of victims both north and south whose livelihoods, land, rivers, forest resources, ancestral rights, traditions, culture are threatened and the life support system is destroyed, These shocking figures are urging us to take action today. Shocking figures © R. Mshana, WCC- JPC Seong-Won Park, WARC Layout - LSM July 2004 Photo: Photo Oikoumene
Distribution of world population in 2001 Source: IMF, World Economic Outlook, 2002 © R. Mshana, WCC- JPC Seong-Won Park, WARC July 2004
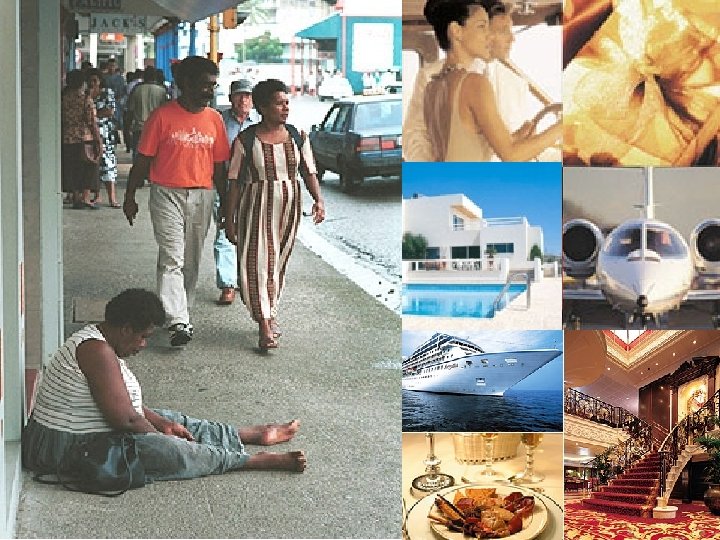
The annual income of the richest 1% of the world’s population is equivalent to that of the poorest 57 % of the planet. Source: Forbes 2002 © R. Mshana, WCC- JPC Seong-Won Park, WARC July 2004
z. The rich become richer and the poor become poorer. © R. Mshana, WCC- JPC Seong-Won Park, WARC July 2004
Furthermore, the income of the richest 5% of people in the world is 114 times higher than that of the poorest 5 % © R. Mshana, WCC- JPC Seong-Won Park, WARC July 2004
Comparison between the wealth of the world’s 497 billionaires and the annual sums required to fulfil basic human needs © R. Mshana, WCC- JPC Seong-Won Park, WARC July 2004
The Champagne Glass Economy Top 20 % Next 20 % Bottom 60 % 83 % of the world’s wealth 11 % of the world’s wealth 6% of the world’s wealth © R. Mshana, WCC- JPC Seong-Won Park, WARC July 2004
z. Income inequality has increased both within nations and between nations. This scenario leads to violence and economic refugees. © R. Mshana, WCC- JPC Seong-Won Park, WARC July 2004
z. The scandal continues. . . © R. Mshana, WCC- JPC Seong-Won Park, WARC July 2004
Transfer of Resources South North $927 Billion $1. 3 Trillion © R. Mshana, WCC- JPC Seong-Won Park, WARC July 2004
z. The scandal continues unabated. © R. Mshana, WCC- JPC Seong-Won Park, WARC July 2004
Net transfer of financial resources to rich countries (Billion USD) Source: Social Watch - Germany 2003 © R. Mshana, WCC- JPC Seong-Won Park, WARC July 2004
DC deposits in banks of highly industrialized countries compared to DC debts to same (Billion USD) Source: BIS 2003 © R. Mshana, WCC- JPC Seong-Won Park, WARC July 2004
z. Southern wealth that is residing in the North must be sent back. Because most of it is illegitimate. z. Poor countries’ debt must be cancelled immediately. © R. Mshana, WCC- JPC Seong-Won Park, WARC July 2004
Inflows of Foreign Direct Investment in Developing Countries 1985 - 2002 (In USD billions) Sources: UNCTAD, Handbook of Statistics 2002 and UNCTAD, World Investment Report 2003 © R. Mshana, WCC- JPC Seong-Won Park, WARC July 2004
z. Globalization gives more wealth and power to corporations becoming stronger than nations. They use cheap labor in the South and unemploy people in the North. © R. Mshana, WCC- JPC Seong-Won Park, WARC July 2004
Transnational Corporations: Large, and Getting Larger Of the world’s 100 largest economies. . . 49 are nations. . . and 51 are corporations Source: Institute for Policy Studies, The Top 200, 1996 © R. Mshana, WCC- JPC Seong-Won Park, WARC July 2004
z. The human dignity and the dignity of the earth are violated. Photo: http: //philip. greenspun. com/ © R. Mshana, WCC- JPC Seong-Won Park, WARC July 2004
How Africa is exploited by TNCs with the higher rates of Capital Returns than those they realize in Developed Countries (Standard rate of return is normally 15 %) © R. Mshana, WCC- JPC Seong-Won Park, WARC July 2004
Who Benefits from World Exports as World Trade is Liberalized? Source: The Economist, Nov. 11 th, 2000, p. 110 © R. Mshana, WCC- JPC Seong-Won Park, WARC July 2004
TRIPS favour rich countries Over 75 % of Trade Related Intellectual Property Rights is in rich countries. US$ billion change in patent royalties once TRIPS is fully enforced TRIPS - Trade Related Intellectual Property Rights © R. Mshana, WCC- JPC Seong-Won Park, WARC July 2004
z Without substantial change, poor countries will continue to loose out in trade. © R. Mshana, WCC- JPC Seong-Won Park, WARC July 2004
What is the voting power in the IFIs? © R. Mshana, WCC- JPC Seong-Won Park, WARC July 2004
Ecological destruction
Environment Ecological Debt Per Capita Emissions of Selected Countries (1996) (metric tones of carbon) © R. Mshana, WCC- JPC Seong-Won Park, WARC July 2004
Environment Carbon Debt Estimates of Compensation due to Carbon Creditors (US$20 per ton, figures in USD millions) Total G 7 carbon debt = US$30. 9 billion The G-7 carbon debt could be higher than this annual estimate. Instead of the South paying to the North, the reverse should be the case. © R. Mshana, WCC- JPC Seong-Won Park, WARC July 2004
Vanishing species z 1850 - 1950: 1 animal species per year z 1989: 1 per day z 2000: 1 per hour z Within 50 years, 25% of animal and plant species will vanish due to global warming. Source: Prof. John Van Klinekn Groningen University, Germany © R. Mshana, WCC- JPC Seong-Won Park, WARC July 2004
“If we continue down the path we are going, we will produce changes greater than any experienced in the past 300 million years. ” Caldeira, Lawrence Livermore National Laboratory
“I am more worried about global warming than I am of any major military conflict. ” Hans Blix, UN Chief Weapons Inspector
“Global Warming is a weapon of j mass destruction. ” Sir John Houghton