
Morten Nielsen CBS Bio Centrum DTU CENTER FOR
Morten Nielsen, CBS, Bio. Centrum, DTU CENTER FOR BIOLOGICAL SEQUENCE ANALYSIS TECHNICAL UNIVERSITY OF DENMARK DTU T cell Epitope predictions using bioinformatics (Neural Networks and hidden Markov models)
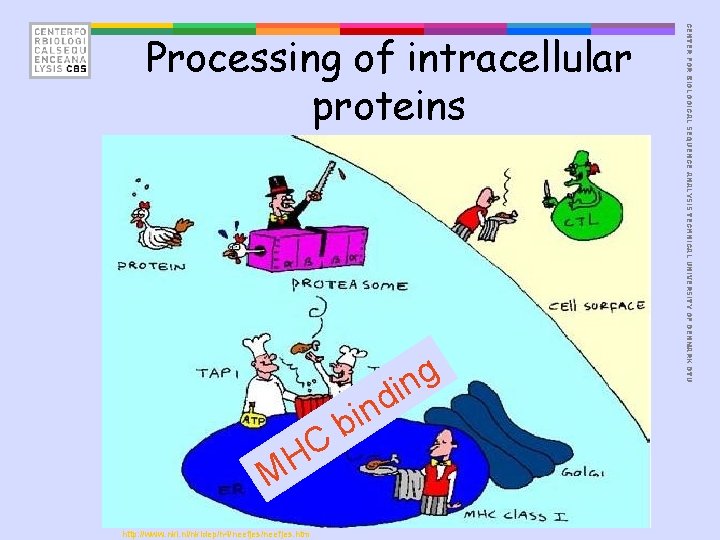
g n di n i b C H M http: //www. nki. nl/nkidep/h 4/neefjes. htm CENTER FOR BIOLOGICAL SEQUENCE ANALYSIS TECHNICAL UNIVERSITY OF DENMARK DTU Processing of intracellular proteins
• Part of a pathogen protein • Successful processing – Proteasome cleavage – TAP binding • Binds to MHC molecule • Protein function – Early in replication • Sequence conservation in evolution CENTER FOR BIOLOGICAL SEQUENCE ANALYSIS TECHNICAL UNIVERSITY OF DENMARK DTU What makes a peptide a potential and effective epitope?
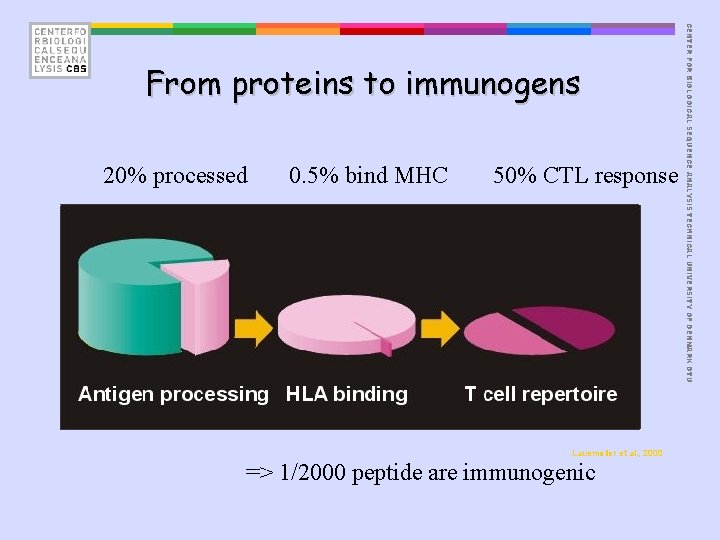
20% processed 0. 5% bind MHC 50% CTL response Lauemøller et al. , 2000 => 1/2000 peptide are immunogenic CENTER FOR BIOLOGICAL SEQUENCE ANALYSIS TECHNICAL UNIVERSITY OF DENMARK DTU From proteins to immunogens
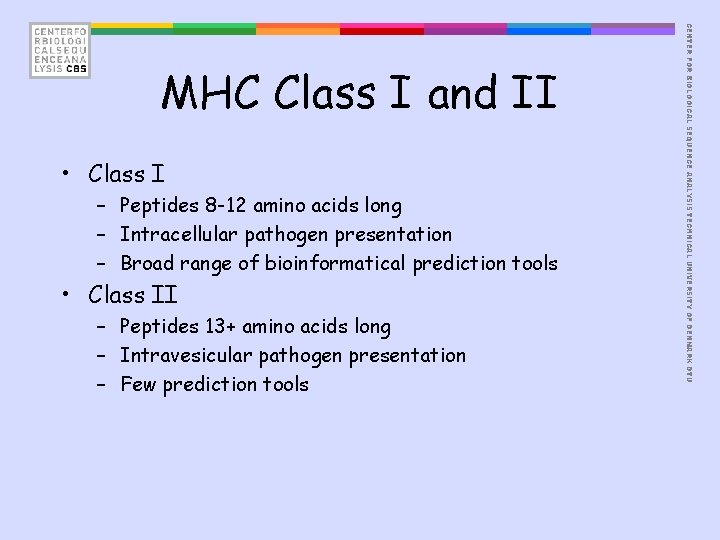
• Class I – Peptides 8 -12 amino acids long – Intracellular pathogen presentation – Broad range of bioinformatical prediction tools • Class II – Peptides 13+ amino acids long – Intravesicular pathogen presentation – Few prediction tools CENTER FOR BIOLOGICAL SEQUENCE ANALYSIS TECHNICAL UNIVERSITY OF DENMARK DTU MHC Class I and II
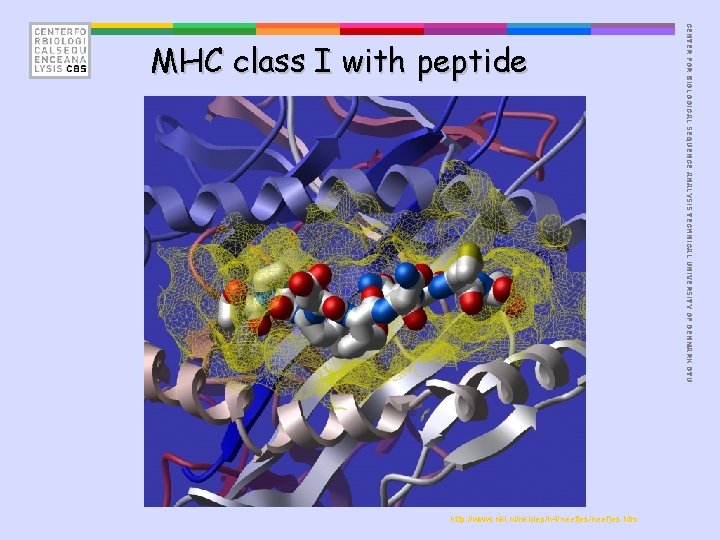
http: //www. nki. nl/nkidep/h 4/neefjes. htm CENTER FOR BIOLOGICAL SEQUENCE ANALYSIS TECHNICAL UNIVERSITY OF DENMARK DTU MHC class I with peptide
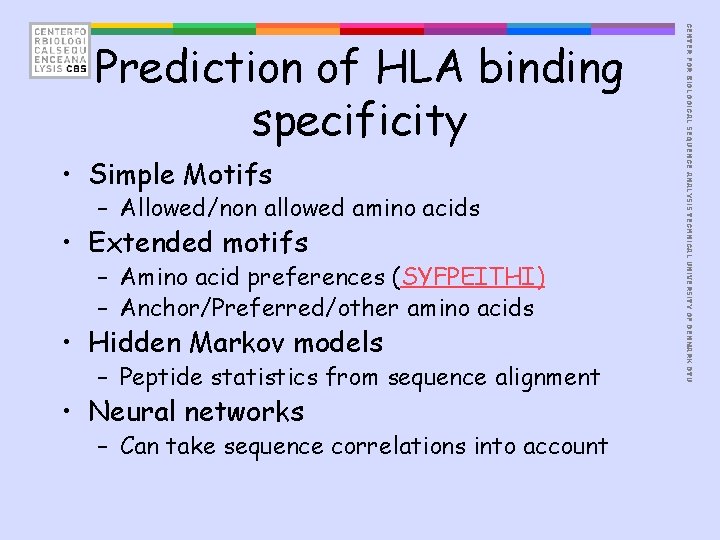
• Simple Motifs – Allowed/non allowed amino acids • Extended motifs – Amino acid preferences (SYFPEITHI) – Anchor/Preferred/other amino acids • Hidden Markov models – Peptide statistics from sequence alignment • Neural networks – Can take sequence correlations into account CENTER FOR BIOLOGICAL SEQUENCE ANALYSIS TECHNICAL UNIVERSITY OF DENMARK DTU Prediction of HLA binding specificity
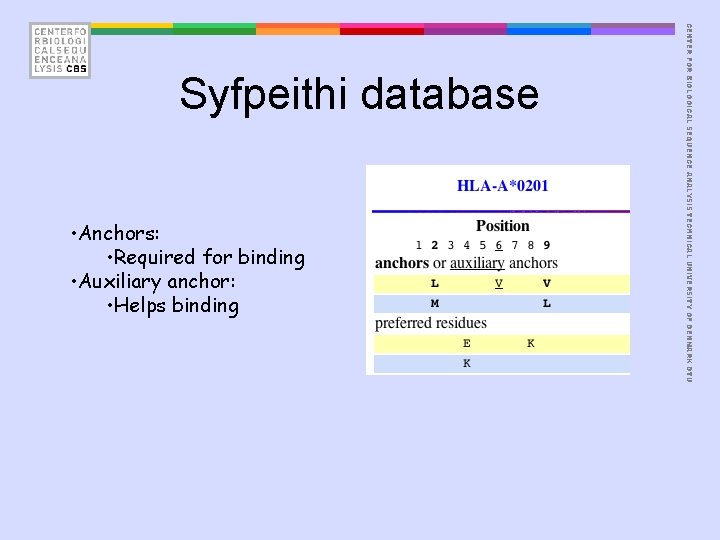
• Anchors: • Required for binding • Auxiliary anchor: • Helps binding CENTER FOR BIOLOGICAL SEQUENCE ANALYSIS TECHNICAL UNIVERSITY OF DENMARK DTU Syfpeithi database
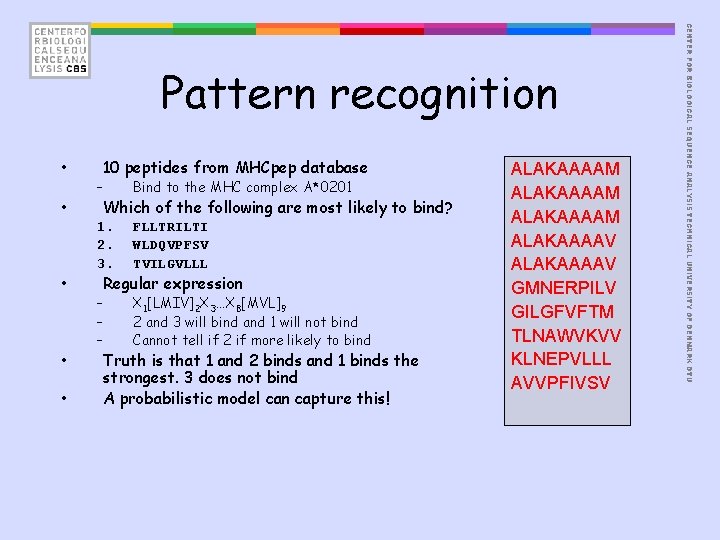
• • • 10 peptides from MHCpep database – Bind to the MHC complex A*0201 1. 2. 3. FLLTRILTI WLDQVPFSV TVILGVLLL – – – X 1[LMIV]2 X 3…X 8[MVL]9 2 and 3 will bind and 1 will not bind Cannot tell if 2 if more likely to bind Which of the following are most likely to bind? Regular expression Truth is that 1 and 2 binds and 1 binds the strongest. 3 does not bind A probabilistic model can capture this! ALAKAAAAM ALAKAAAAV GMNERPILV GILGFVFTM TLNAWVKVV KLNEPVLLL AVVPFIVSV CENTER FOR BIOLOGICAL SEQUENCE ANALYSIS TECHNICAL UNIVERSITY OF DENMARK DTU Pattern recognition
ALAKAAAAM ALAKAAAAV GMNERPILV GILGFVFTM TLNAWVKVV KLNEPVLLL AVVPFIVSV CENTER FOR BIOLOGICAL SEQUENCE ANALYSIS TECHNICAL UNIVERSITY OF DENMARK DTU Probability estimation
• Estimate amino acid frequencies from alignment • Now a weight matrix is given as Wij = log(pij/qj) – Here i is a position in the motif, and j an amino acid. q j is the background frequency for amino acid j. • In nature not all amino acids are found equally often – PA = 0. 07, PW = 0. 013 – Finding 6% A is hence not significant, but 6% W highly significant • W is a L x 20 matrix, L is motif length CENTER FOR BIOLOGICAL SEQUENCE ANALYSIS TECHNICAL UNIVERSITY OF DENMARK DTU Weight matrices
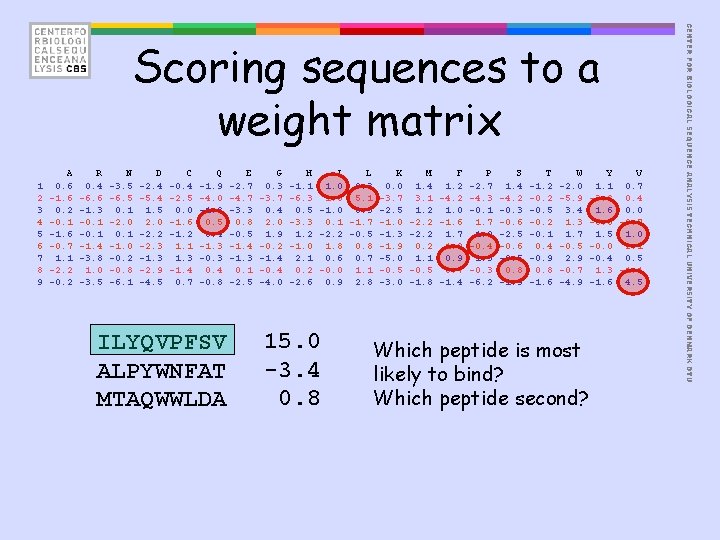
1 2 3 4 5 6 7 8 9 A 0. 6 -1. 6 0. 2 -0. 1 -1. 6 -0. 7 1. 1 -2. 2 -0. 2 R 0. 4 -6. 6 -1. 3 -0. 1 -1. 4 -3. 8 1. 0 -3. 5 N -3. 5 -6. 5 0. 1 -2. 0 0. 1 -1. 0 -0. 2 -0. 8 -6. 1 D -2. 4 -5. 4 1. 5 2. 0 -2. 2 -2. 3 -1. 3 -2. 9 -4. 5 C -0. 4 -2. 5 0. 0 -1. 6 -1. 2 1. 1 1. 3 -1. 4 0. 7 Q -1. 9 -4. 0 -1. 8 0. 5 0. 4 -1. 3 -0. 3 0. 4 -0. 8 ILYQVPFSV ALPYWNFAT MTAQWWLDA E -2. 7 -4. 7 -3. 3 0. 8 -0. 5 -1. 4 -1. 3 0. 1 -2. 5 G 0. 3 -3. 7 0. 4 2. 0 1. 9 -0. 2 -1. 4 -0. 4 -4. 0 H I L K M F -1. 1 1. 0 0. 3 0. 0 1. 4 1. 2 -6. 3 1. 0 5. 1 -3. 7 3. 1 -4. 2 0. 5 -1. 0 0. 3 -2. 5 1. 2 1. 0 -3. 3 0. 1 -1. 7 -1. 0 -2. 2 -1. 6 1. 2 -2. 2 -0. 5 -1. 3 -2. 2 1. 7 -1. 0 1. 8 0. 8 -1. 9 0. 2 1. 0 2. 1 0. 6 0. 7 -5. 0 1. 1 0. 9 0. 2 -0. 0 1. 1 -0. 5 0. 7 -2. 6 0. 9 2. 8 -3. 0 -1. 8 -1. 4 15. 0 -3. 4 0. 8 P -2. 7 -4. 3 -0. 1 1. 7 1. 2 -0. 4 1. 3 -0. 3 -6. 2 S 1. 4 -4. 2 -0. 3 -0. 6 -2. 5 -0. 6 -0. 5 0. 8 -1. 9 T -1. 2 -0. 5 -0. 2 -0. 1 0. 4 -0. 9 0. 8 -1. 6 W -2. 0 -5. 9 3. 4 1. 3 1. 7 -0. 5 2. 9 -0. 7 -4. 9 Which peptide is most likely to bind? Which peptide second? Y V 1. 1 0. 7 -3. 8 0. 4 1. 6 0. 0 -6. 8 -0. 7 1. 5 1. 0 -0. 0 2. 1 -0. 4 0. 5 1. 3 -1. 1 -1. 6 4. 5 CENTER FOR BIOLOGICAL SEQUENCE ANALYSIS TECHNICAL UNIVERSITY OF DENMARK DTU Scoring sequences to a weight matrix
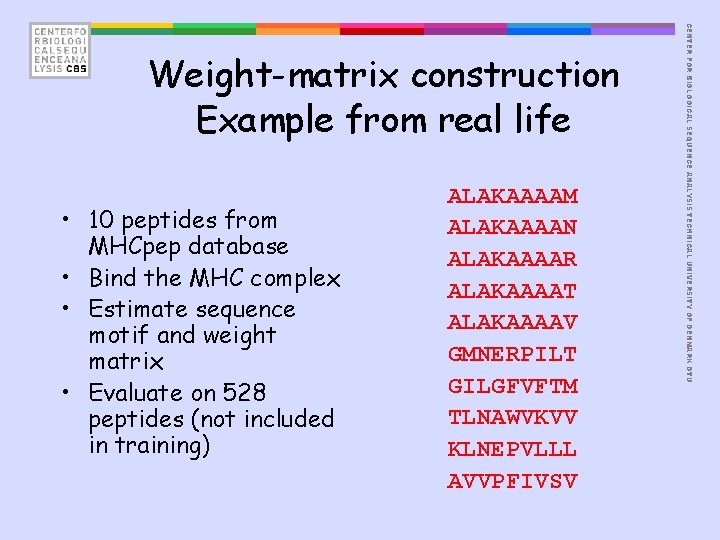
• 10 peptides from MHCpep database • Bind the MHC complex • Estimate sequence motif and weight matrix • Evaluate on 528 peptides (not included in training) ALAKAAAAM ALAKAAAAN ALAKAAAAR ALAKAAAAT ALAKAAAAV GMNERPILT GILGFVFTM TLNAWVKVV KLNEPVLLL AVVPFIVSV CENTER FOR BIOLOGICAL SEQUENCE ANALYSIS TECHNICAL UNIVERSITY OF DENMARK DTU Weight-matrix construction Example from real life
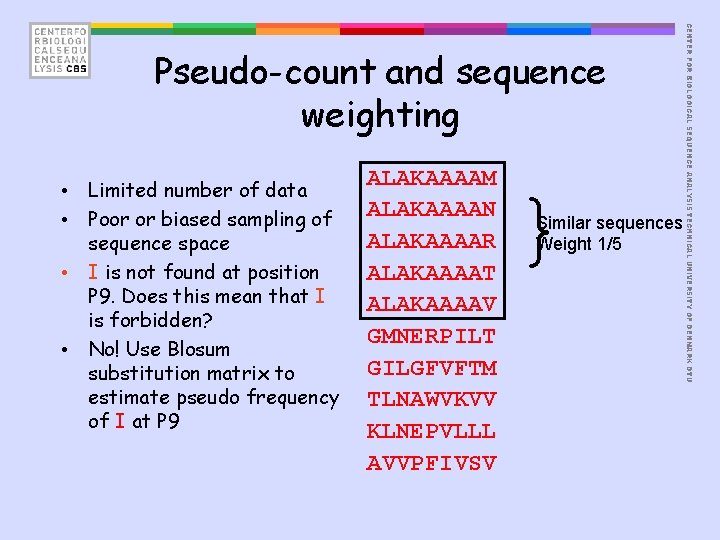
• Limited number of data • Poor or biased sampling of sequence space • I is not found at position P 9. Does this mean that I is forbidden? • No! Use Blosum substitution matrix to estimate pseudo frequency of I at P 9 ALAKAAAAM ALAKAAAAN ALAKAAAAR ALAKAAAAT ALAKAAAAV GMNERPILT GILGFVFTM TLNAWVKVV KLNEPVLLL AVVPFIVSV } Similar sequences Weight 1/5 CENTER FOR BIOLOGICAL SEQUENCE ANALYSIS TECHNICAL UNIVERSITY OF DENMARK DTU Pseudo-count and sequence weighting

• Every time for instance L/V Blosum 62 substitution frequencies is observed, I is also likely # I L V to occur L 0. 12 0. 38 0. 10 • Estimate low (pseudo) V 0. 16 0. 13 0. 27 count correction using this approach • As more data are included the pseudo count correction becomes less important Neff: Number of sequences b: Weight on prior or pseudo count CENTER FOR BIOLOGICAL SEQUENCE ANALYSIS TECHNICAL UNIVERSITY OF DENMARK DTU Low count correction using Blosum matrices
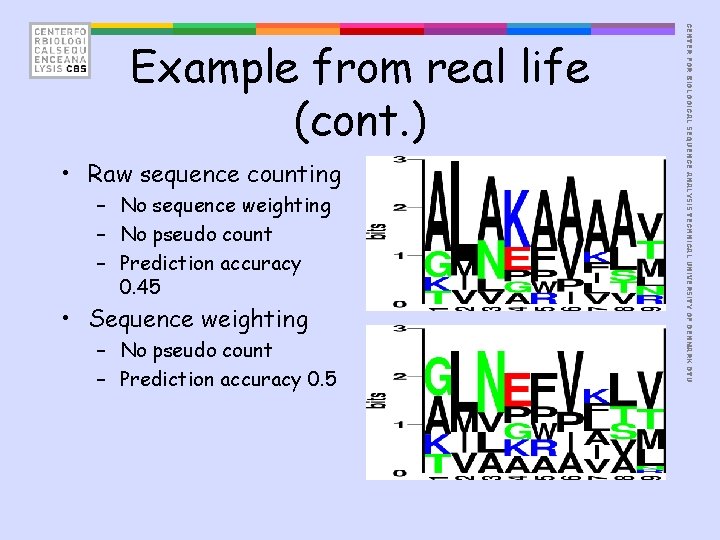
• Raw sequence counting – No sequence weighting – No pseudo count – Prediction accuracy 0. 45 • Sequence weighting – No pseudo count – Prediction accuracy 0. 5 CENTER FOR BIOLOGICAL SEQUENCE ANALYSIS TECHNICAL UNIVERSITY OF DENMARK DTU Example from real life (cont. )
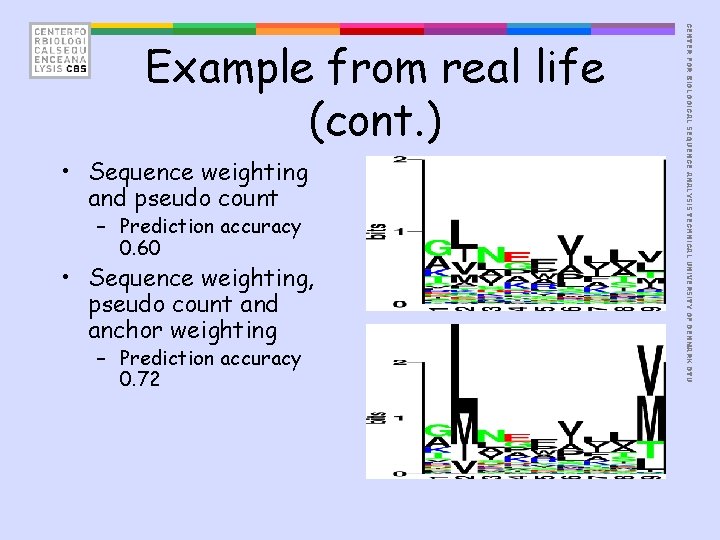
• Sequence weighting and pseudo count – Prediction accuracy 0. 60 • Sequence weighting, pseudo count and anchor weighting – Prediction accuracy 0. 72 CENTER FOR BIOLOGICAL SEQUENCE ANALYSIS TECHNICAL UNIVERSITY OF DENMARK DTU Example from real life (cont. )
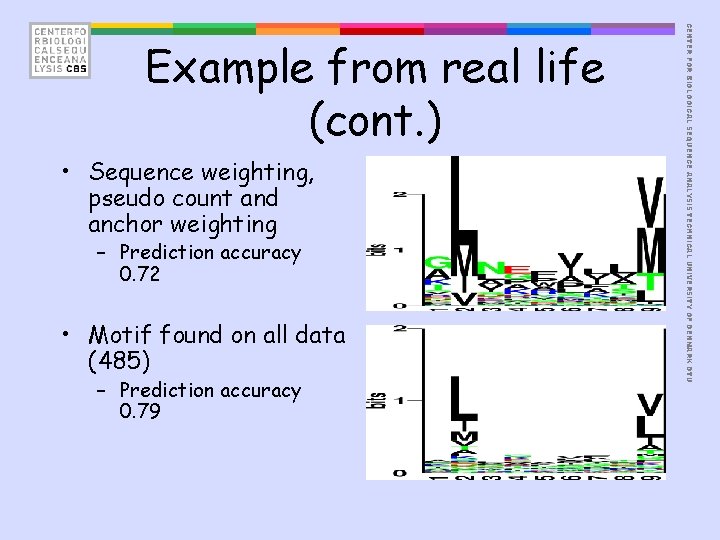
• Sequence weighting, pseudo count and anchor weighting – Prediction accuracy 0. 72 • Motif found on all data (485) – Prediction accuracy 0. 79 CENTER FOR BIOLOGICAL SEQUENCE ANALYSIS TECHNICAL UNIVERSITY OF DENMARK DTU Example from real life (cont. )
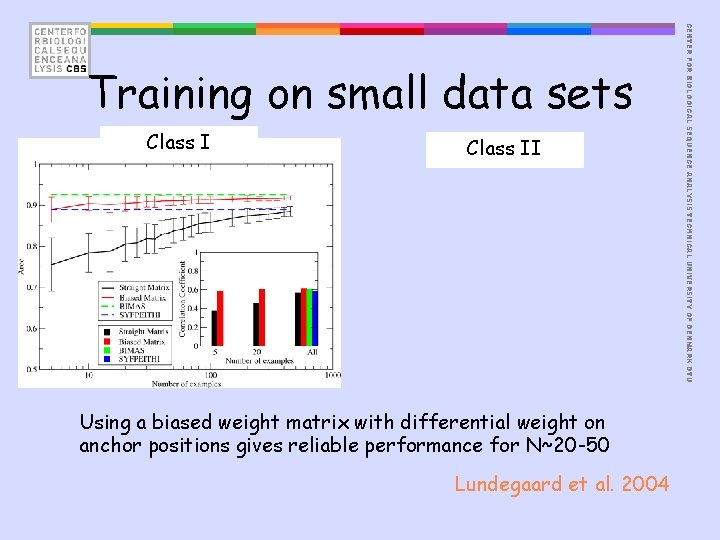
Class II Using a biased weight matrix with differential weight on anchor positions gives reliable performance for N~20 -50 Lundegaard et al. 2004 CENTER FOR BIOLOGICAL SEQUENCE ANALYSIS TECHNICAL UNIVERSITY OF DENMARK DTU Training on small data sets
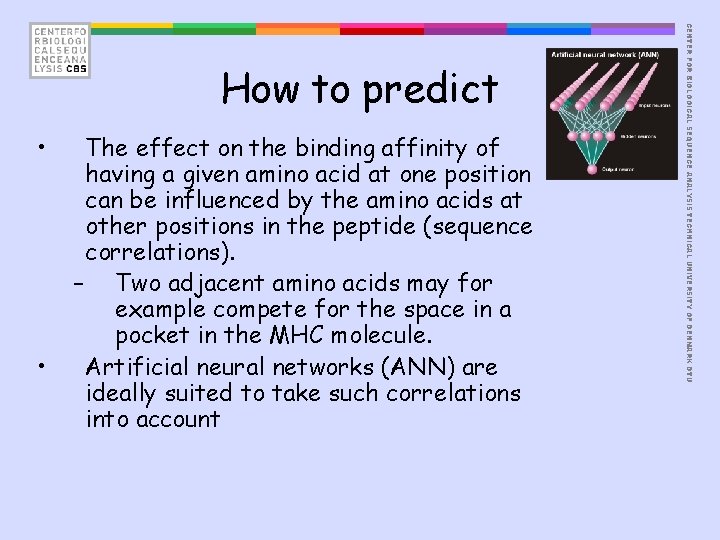
• • The effect on the binding affinity of having a given amino acid at one position can be influenced by the amino acids at other positions in the peptide (sequence correlations). – Two adjacent amino acids may for example compete for the space in a pocket in the MHC molecule. Artificial neural networks (ANN) are ideally suited to take such correlations into account CENTER FOR BIOLOGICAL SEQUENCE ANALYSIS TECHNICAL UNIVERSITY OF DENMARK DTU How to predict
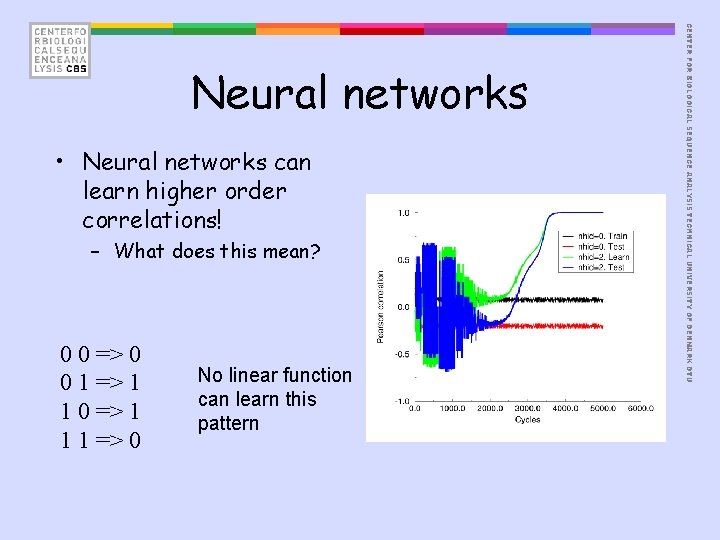
• Neural networks can learn higher order correlations! – What does this mean? 0 0 => 0 0 1 => 1 1 0 => 1 1 1 => 0 No linear function can learn this pattern CENTER FOR BIOLOGICAL SEQUENCE ANALYSIS TECHNICAL UNIVERSITY OF DENMARK DTU Neural networks
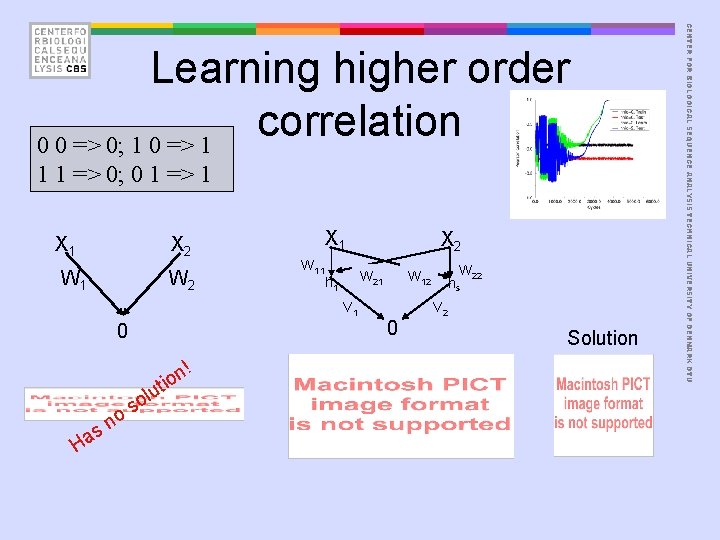
1 1 => 0; 0 1 => 1 X 2 W 1 W 2 X 1 W 11 W 21 h 1 V 1 0 ! n tio lu o s Ha o n s X 2 W 22 hs W 12 0 V 2 Solution CENTER FOR BIOLOGICAL SEQUENCE ANALYSIS TECHNICAL UNIVERSITY OF DENMARK DTU Learning higher order correlation 0 0 => 0; 1 0 => 1
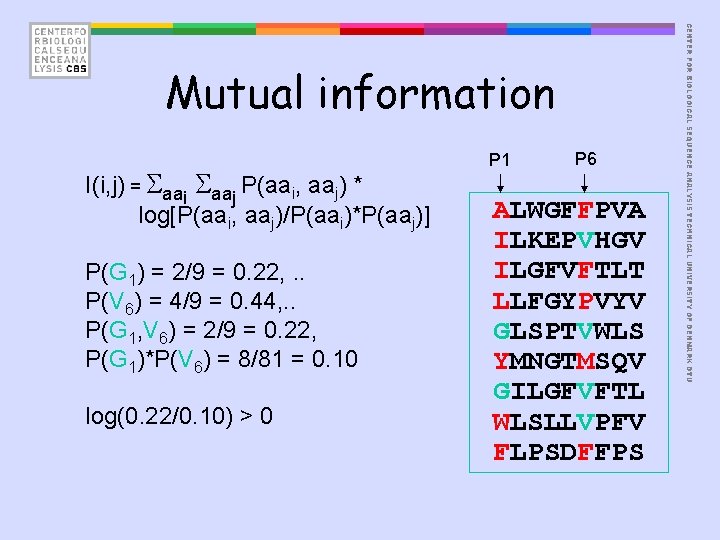
I(i, j) = Saai Saaj P(aai, aaj) * log[P(aai, aaj)/P(aai)*P(aaj)] P(G 1) = 2/9 = 0. 22, . . P(V 6) = 4/9 = 0. 44, . . P(G 1, V 6) = 2/9 = 0. 22, P(G 1)*P(V 6) = 8/81 = 0. 10 log(0. 22/0. 10) > 0 P 1 P 6 ALWGFFPVA ILKEPVHGV ILGFVFTLT LLFGYPVYV GLSPTVWLS YMNGTMSQV GILGFVFTL WLSLLVPFV FLPSDFFPS CENTER FOR BIOLOGICAL SEQUENCE ANALYSIS TECHNICAL UNIVERSITY OF DENMARK DTU Mutual information
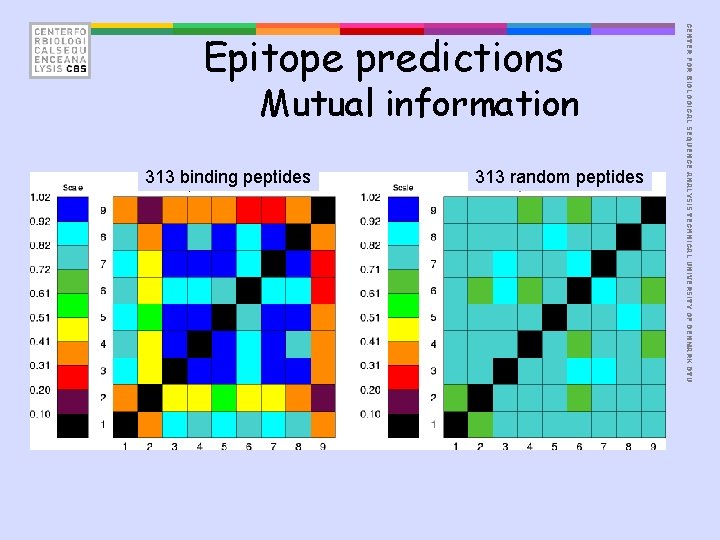
Mutual information 313 binding peptides 313 random peptides CENTER FOR BIOLOGICAL SEQUENCE ANALYSIS TECHNICAL UNIVERSITY OF DENMARK DTU Epitope predictions
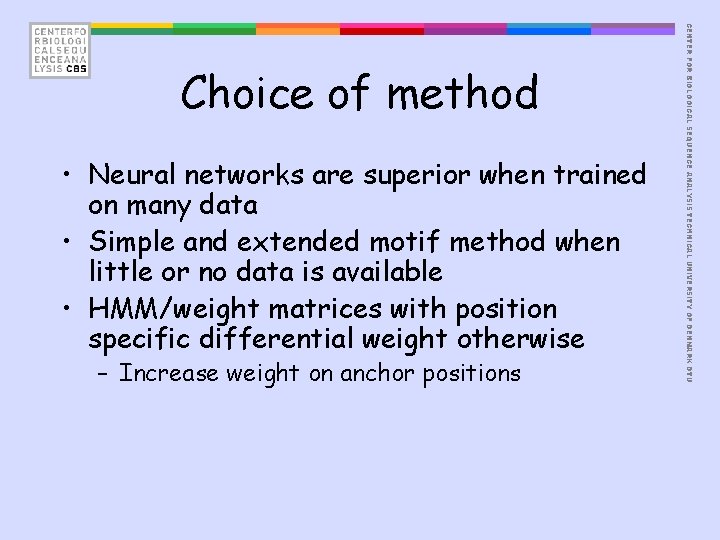
• Neural networks are superior when trained on many data • Simple and extended motif method when little or no data is available • HMM/weight matrices with position specific differential weight otherwise – Increase weight on anchor positions CENTER FOR BIOLOGICAL SEQUENCE ANALYSIS TECHNICAL UNIVERSITY OF DENMARK DTU Choice of method
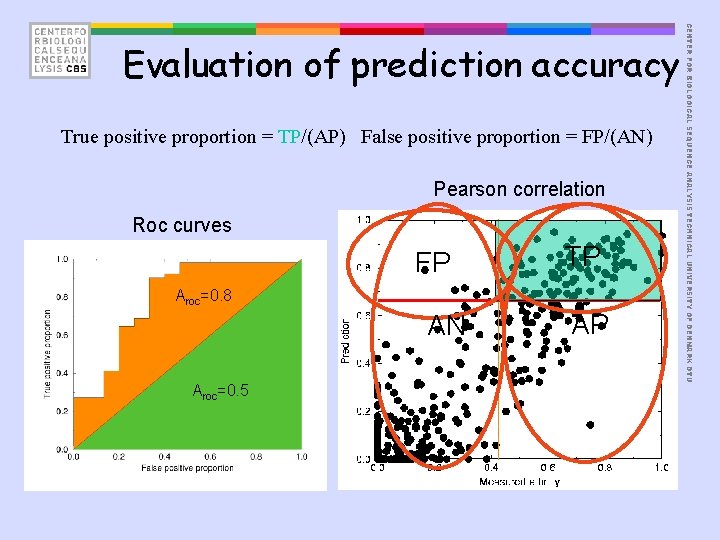
True positive proportion = TP/(AP) False positive proportion = FP/(AN) Pearson correlation Roc curves FP TP Aroc=0. 8 AN Aroc=0. 5 AP CENTER FOR BIOLOGICAL SEQUENCE ANALYSIS TECHNICAL UNIVERSITY OF DENMARK DTU Evaluation of prediction accuracy
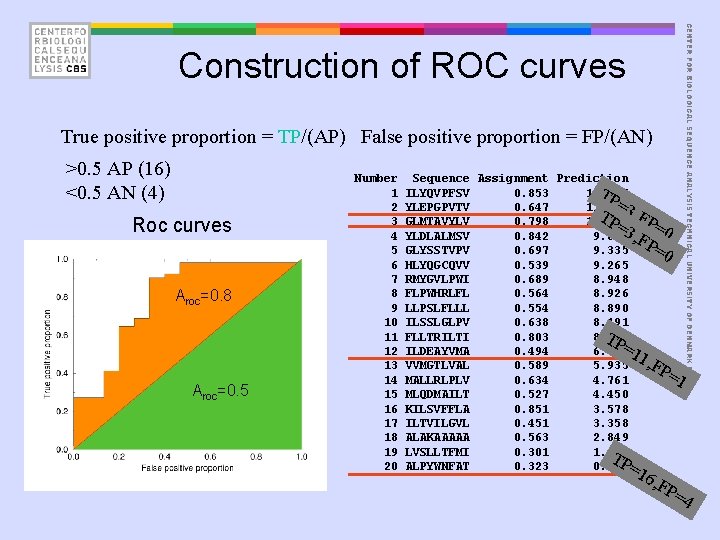
True positive proportion = TP/(AP) False positive proportion = FP/(AN) >0. 5 AP (16) <0. 5 AN (4) Roc curves Aroc=0. 8 Aroc=0. 5 Number 1 2 3 4 5 6 7 8 9 10 11 12 13 14 15 16 17 18 19 20 Sequence Assignment Prediction ILYQVPFSV 0. 853 12. 137 TP =3 YLEPGPVTV 0. 647 11. 509 T GLMTAVYLV 0. 798 10. 021 P= , FP= YLDLALMSV 0. 842 9. 6323, F 0 GLYSSTVPV 0. 697 9. 335 P=0 HLYQGCQVV 0. 539 9. 265 RMYGVLPWI 0. 689 8. 948 FLPWHRLFL 0. 564 8. 926 LLPSLFLLL 0. 554 8. 890 ILSSLGLPV 0. 638 8. 491 FLLTRILTI 0. 803 8. 343 TP =1 ILDEAYVMA 0. 494 6. 084 1 VVMGTLVAL 0. 589 5. 935 , FP =1 MALLRLPLV 0. 634 4. 761 MLQDMAILT 0. 527 4. 450 KILSVFFLA 0. 851 3. 578 ILTVILGVL 0. 451 3. 358 ALAKAAAAA 0. 563 2. 849 LVSLLTFMI 0. 301 1. 193 TP ALPYWNFAT 0. 323 0. 994 = 16 CENTER FOR BIOLOGICAL SEQUENCE ANALYSIS TECHNICAL UNIVERSITY OF DENMARK DTU Construction of ROC curves , FP =4
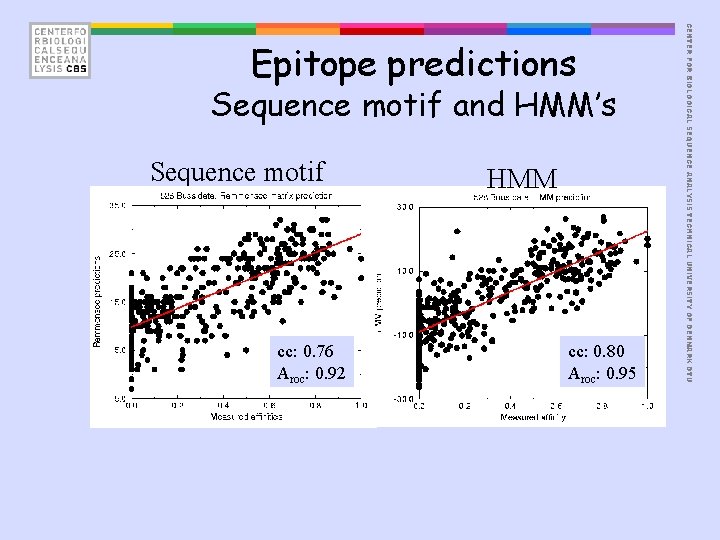
Sequence motif and HMM’s Sequence motif cc: 0. 76 Aroc: 0. 92 HMM cc: 0. 80 Aroc: 0. 95 CENTER FOR BIOLOGICAL SEQUENCE ANALYSIS TECHNICAL UNIVERSITY OF DENMARK DTU Epitope predictions
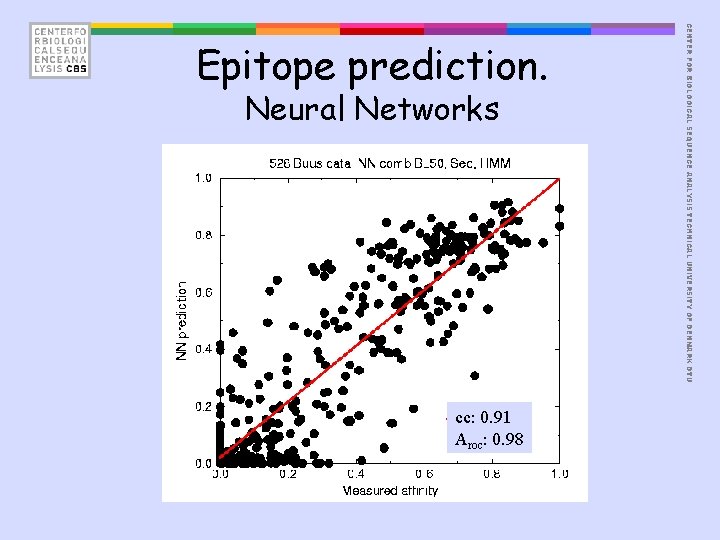
Neural Networks cc: 0. 91 Aroc: 0. 98 CENTER FOR BIOLOGICAL SEQUENCE ANALYSIS TECHNICAL UNIVERSITY OF DENMARK DTU Epitope prediction.
CENTER FOR BIOLOGICAL SEQUENCE ANALYSIS TECHNICAL UNIVERSITY OF DENMARK DTU Evaluation of prediction accuracy
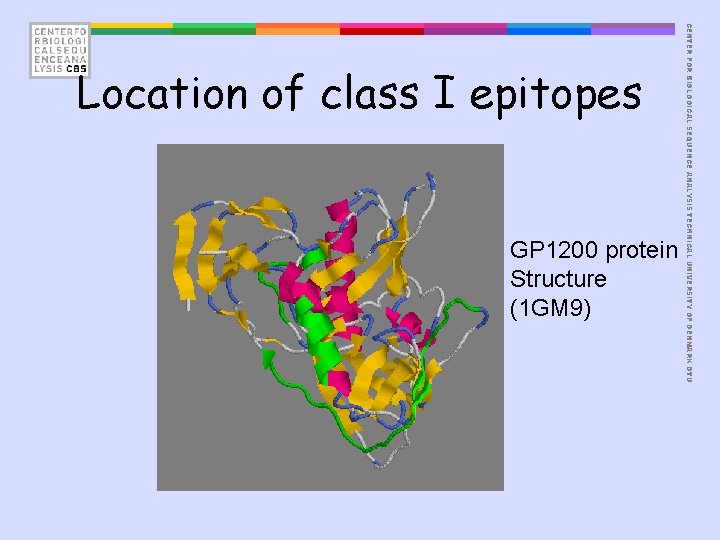
GP 1200 protein Structure (1 GM 9) CENTER FOR BIOLOGICAL SEQUENCE ANALYSIS TECHNICAL UNIVERSITY OF DENMARK DTU Location of class I epitopes
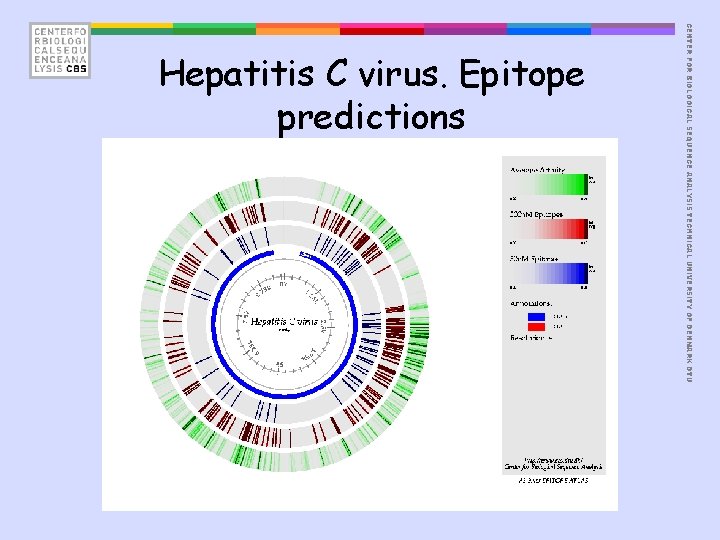
CENTER FOR BIOLOGICAL SEQUENCE ANALYSIS TECHNICAL UNIVERSITY OF DENMARK DTU Hepatitis C virus. Epitope predictions
• TEPITOPE. Virtual matrices (Hammer, J. , Current Opinion in Immunology 7, 263 -269, 1995) • PROPRED. Quantitative matrices (Singh H, Raghava GP Bioinformatics 2001 Dec; 17(12): 1236 -7) – Web interface http: //www. imtech. res. in/raghava/propred • Gibbs sampler (Nielsen et al. , Bioinformatics 2004. Improved prediction of MHC class I and II epitopes using a novel Gibbs sampler approach) CENTER FOR BIOLOGICAL SEQUENCE ANALYSIS TECHNICAL UNIVERSITY OF DENMARK DTU MHC Class II binding
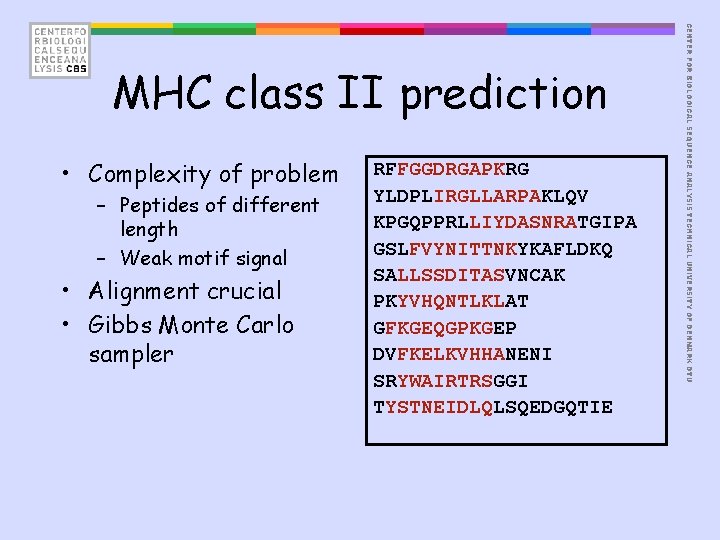
• Complexity of problem – Peptides of different length – Weak motif signal • Alignment crucial • Gibbs Monte Carlo sampler RFFGGDRGAPKRG YLDPLIRGLLARPAKLQV KPGQPPRLLIYDASNRATGIPA GSLFVYNITTNKYKAFLDKQ SALLSSDITASVNCAK PKYVHQNTLKLAT GFKGEQGPKGEP DVFKELKVHHANENI SRYWAIRTRSGGI TYSTNEIDLQLSQEDGQTIE CENTER FOR BIOLOGICAL SEQUENCE ANALYSIS TECHNICAL UNIVERSITY OF DENMARK DTU MHC class II prediction
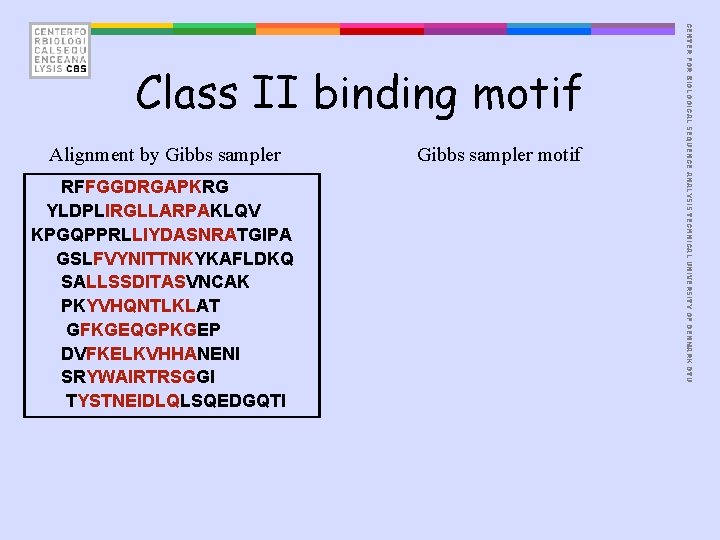
Alignment by Gibbs sampler RFFGGDRGAPKRG YLDPLIRGLLARPAKLQV KPGQPPRLLIYDASNRATGIPA GSLFVYNITTNKYKAFLDKQ SALLSSDITASVNCAK PKYVHQNTLKLAT GFKGEQGPKGEP DVFKELKVHHANENI SRYWAIRTRSGGI TYSTNEIDLQLSQEDGQTI Gibbs sampler motif CENTER FOR BIOLOGICAL SEQUENCE ANALYSIS TECHNICAL UNIVERSITY OF DENMARK DTU Class II binding motif

Accuracy Allele DRB 1_0401 CENTER FOR BIOLOGICAL SEQUENCE ANALYSIS TECHNICAL UNIVERSITY OF DENMARK DTU MHC class II predictions
• Binding motif of class I MHC binding well characterized by HMM/weight matrices – This even when limited data is available • Neural networks can be trained to predict MHC binding with high accuracy – NN can include higher order sequence correlations • MHC Class II peptide binding motif can be described using a Gibbs sampler algorithm CENTER FOR BIOLOGICAL SEQUENCE ANALYSIS TECHNICAL UNIVERSITY OF DENMARK DTU Summary
- Slides: 37