Morphometric Analysis of Cinder Cone Degradation Summary Cinder


 Cone heights, height/diameter ratios, and slopes decrease with degradation – Ability")
- Slides: 11
Morphometric Analysis of Cinder Cone Degradation
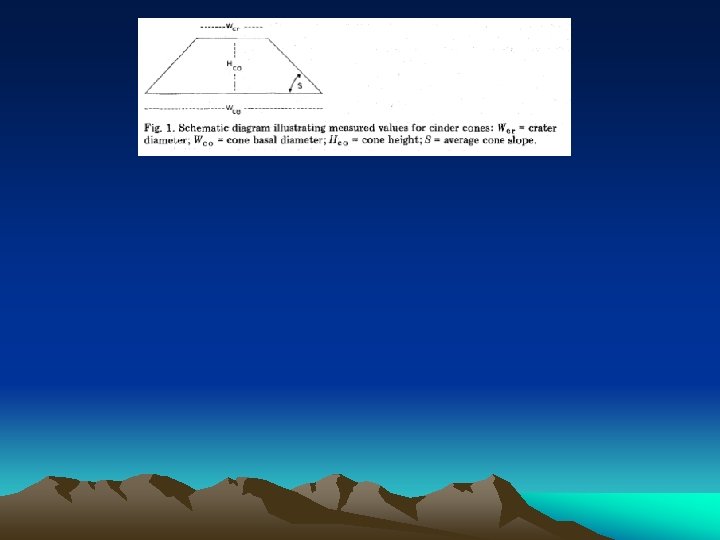
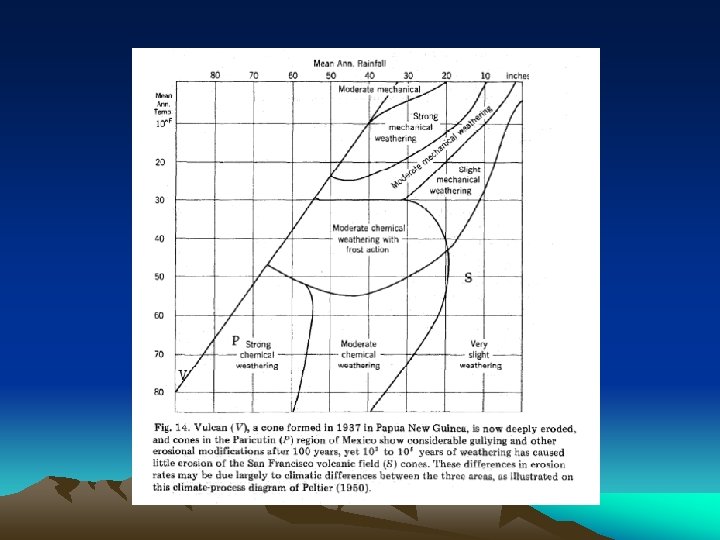
Summary • Cinder cone measurements are used to determine morphological effects and rate of degradation. • San Francisco volcanic field, Arizona – – radiometric dates and stratigraphic studies determined cone ages decrease in height, height/width ratio and slope through time • Crater diameter to cone basal diameter ratio does not appear to change with degradation • Morphometric degradation patterns are similar for all cinder cones – Based on information from Nevada, Oregon, Manchuria, Italy and Reunion • Temperature and rainfall greatly effect rate of degradation • Initial cinder cone geometry starts very similar with all cinder cones – • Degraded cones can then be used to determine long term climate changes Degradation modeled for 2 cases – Burial from lava flows – Erosion and mass wasting • • • Reduces basal diameter Tends to increase basal diameter due to deposition of eroded materials Primary process is mass wasting – – “cinders weather to clay, which is gullied by rainfall, with the debris sliding downslope” Mass wasting processes can be used to create a degradation curve
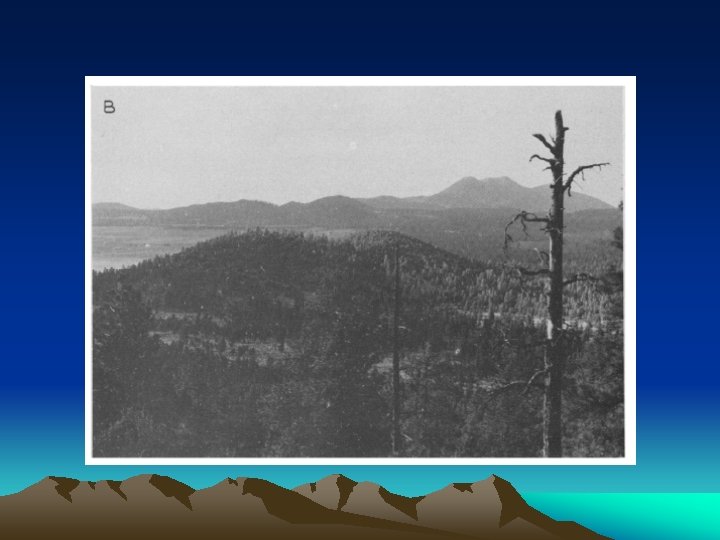
San Francisco Volcanic Field • Located in northern Arizona, Flagstaff • Hundreds of cones with varying degradational states • Basaltic to andesitic to benmoreite (alkalic) • Lots of geological information – Maps – Radiometric dates – Chemical analyses
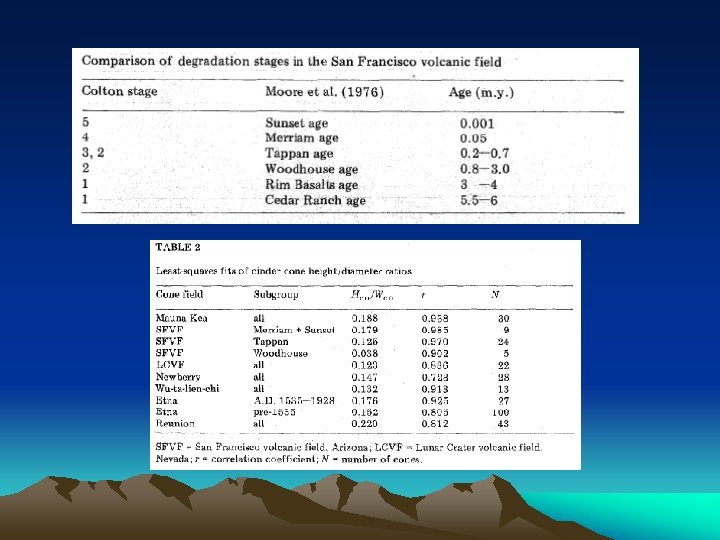
Colton Classification • Colton classified cinder cones into 5 categories based on degradation – Stage 5 • Youngest, steep, lack gullies, little oxidation – Stage 4 • Lack large scale erosion, oxidation significantly decompsed cinders to clay, sparse vegetation – Stage 3 • Gullies – Stage 2 • Severe erosion, inner dikes and ridges visible, subdues rim, vegetation in good soil – Stage 1 • Complete strippage of material leaves a plug
Conclusion • 1) Cone heights, height/diameter ratios, and slopes decrease with degradation – Ability to roughly date cones based on morphology • 2) Crater diameter/basal diameter ratios (Wcr/Wco) appear to be nearly independent of degradation, and thus may be a useful index of cone origin • 3) Erosion and mass wasting account for the majority of morphological changes – Wind has little effect unless there is substantial ash cover – Lava flows have little change compared to erosion • 4) Degradation rate decreases with cone size as well as age • 5) Due to climate, erosion rates vary depending on location – With time spans of several million years, measurements of cone morphology can be used to determine past climate