
Monitoring Marine Heat Waves in CMEMS ocean analysis

- Slides: 11
Monitoring Marine Heat. Waves in CMEMS ocean analysis systems MHW Dec 2019 Eric de Boisséson, Magdalena Balmaseda, Hao Zuo EGU 2020, 8 May 2020 Corr. author: Eric de Boisséson ECMWF, Reading UK Email address: Eric. Boisseson@ecmwf. int
CMEMS ocean reanalyses • Since 2015, CMEMS has been providing near-real time and multi-year ocean analyses • CMEMS archives host an ensemble of mutli-year global ocean reanalyses: GLORYS (MOI), FOAM (UKMO), C-GLORS (CMCC), ORAS 5 (ECMWF) • Both monthly and daily frequency reanalysis fields are available with target to provide 1 month behind real-time updates • Recent increase in the frequency of Marine Heat. Wave (MHW) events with significant impact on the marine ecosystems and industries • CMEMS products allow in-depth monitoring of those events. Combining with C 3 S atmospheric reanalyses allows for MHW process attribution
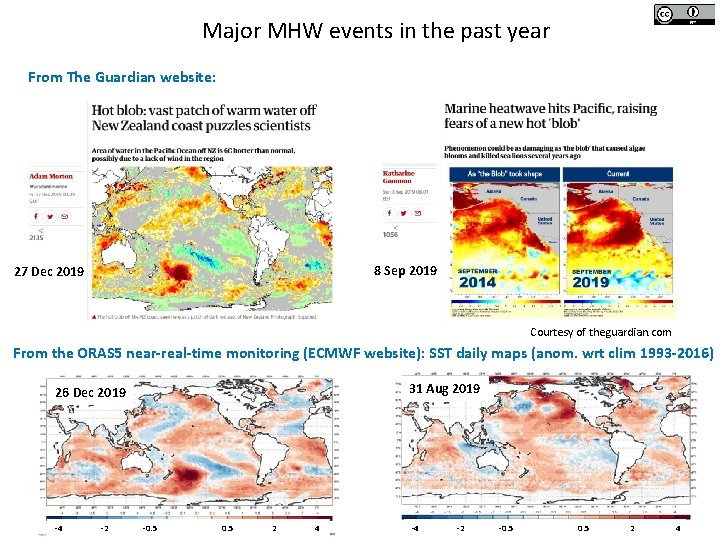
Major MHW events in the past year From The Guardian website: 8 Sep 2019 27 Dec 2019 Courtesy of theguardian. com From the ORAS 5 near-real-time monitoring (ECMWF website): SST daily maps (anom. wrt clim 1993 -2016) 31 Aug 2019 26 Dec 2019 -4 -2 -0. 5 2 4
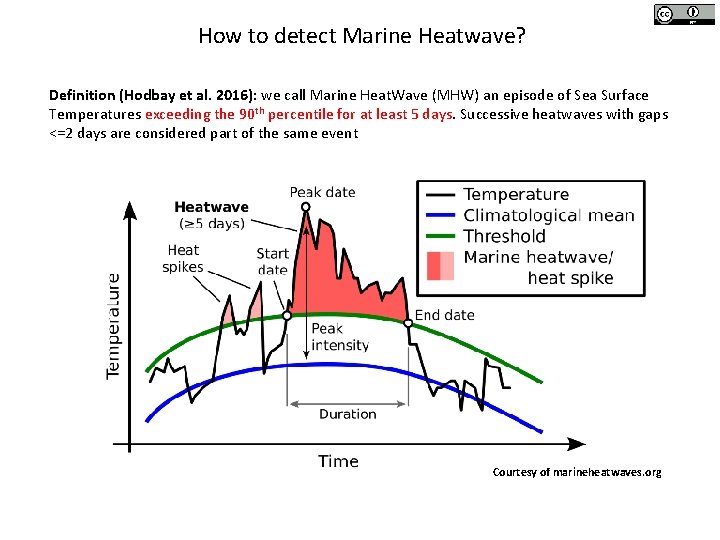
How to detect Marine Heatwave? Definition (Hodbay et al. 2016): we call Marine Heat. Wave (MHW) an episode of Sea Surface Temperatures exceeding the 90 th percentile for at least 5 days. Successive heatwaves with gaps <=2 days are considered part of the same event Courtesy of marineheatwaves. org
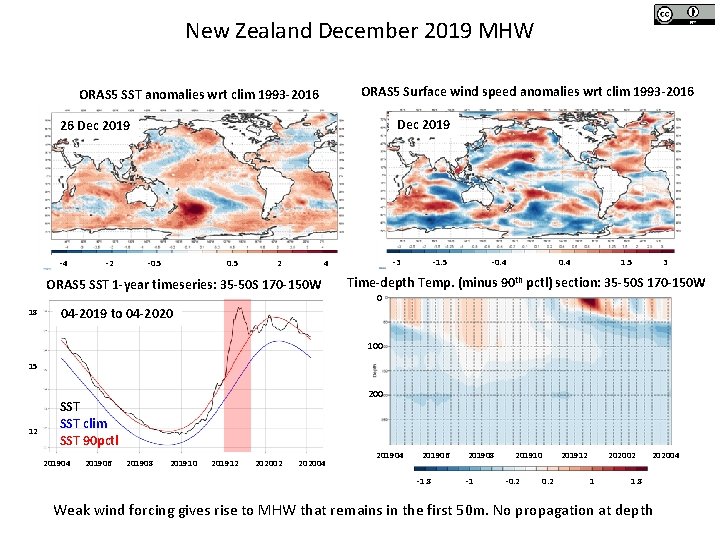
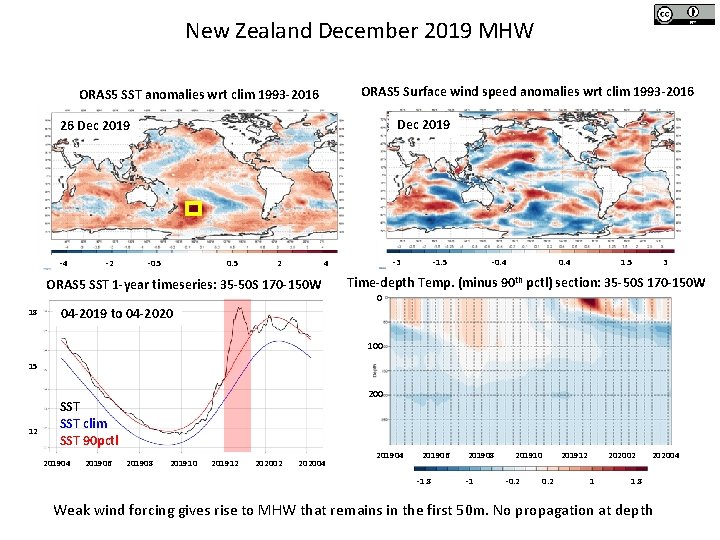
New Zealand December 2019 MHW ORAS 5 Surface wind speed anomalies wrt clim 1993 -2016 ORAS 5 SST anomalies wrt clim 1993 -2016 Dec 2019 26 Dec 2019 -4 -2 -0. 5 2 ORAS 5 SST 1 -year timeseries: 35 -50 S 170 -150 W 18 -3 4 -1. 5 -0. 4 1. 5 3 Time-depth Temp. (minus 90 th pctl) section: 35 -50 S 170 -150 W 0 04 -2019 to 04 -2020 100 15 12 200 SST clim SST 90 pctl 201904 201906 201908 201910 201912 202004 201906 -1. 8 201908 -1 201910 -0. 2 201912 202002 1 202004 1. 8 Weak wind forcing gives rise to MHW that remains in the first 50 m. No propagation at depth
New Zealand December 2019 MHW ORAS 5 Surface wind speed anomalies wrt clim 1993 -2016 ORAS 5 SST anomalies wrt clim 1993 -2016 Dec 2019 26 Dec 2019 -4 -2 -0. 5 2 ORAS 5 SST 1 -year timeseries: 35 -50 S 170 -150 W 18 -3 4 -1. 5 -0. 4 1. 5 3 Time-depth Temp. (minus 90 th pctl) section: 35 -50 S 170 -150 W 0 04 -2019 to 04 -2020 100 15 12 200 SST clim SST 90 pctl 201904 201906 201908 201910 201912 202004 201906 -1. 8 201908 -1 201910 -0. 2 201912 202002 1 202004 1. 8 Weak wind forcing gives rise to MHW that remains in the first 50 m. No propagation at depth
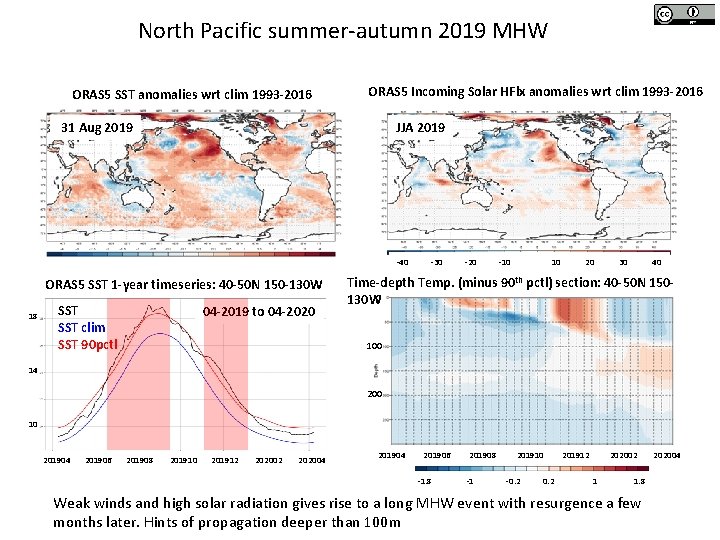
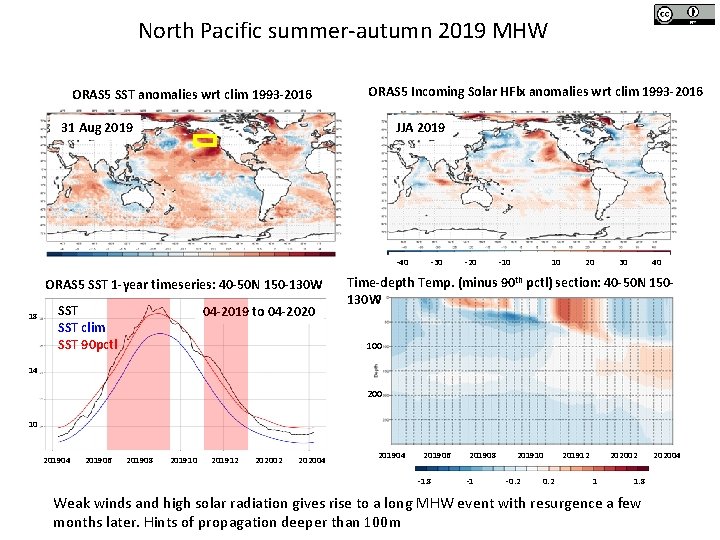
North Pacific summer-autumn 2019 MHW ORAS 5 SST anomalies wrt clim 1993 -2016 ORAS 5 Incoming Solar HFlx anomalies wrt clim 1993 -2016 31 Aug 2019 JJA 2019 -40 ORAS 5 SST 1 -year timeseries: 40 -50 N 150 -130 W 18 SST clim SST 90 pctl 04 -2019 to 04 -2020 -30 -20 -10 10 20 30 40 Time-depth Temp. (minus 90 th pctl) section: 40 -50 N 150130 W 0 100 14 200 10 201904 201906 201908 201910 201912 202004 201906 -1. 8 201908 -1 201910 -0. 2 201912 202002 1 1. 8 Weak winds and high solar radiation gives rise to a long MHW event with resurgence a few months later. Hints of propagation deeper than 100 m 202004
North Pacific summer-autumn 2019 MHW ORAS 5 SST anomalies wrt clim 1993 -2016 ORAS 5 Incoming Solar HFlx anomalies wrt clim 1993 -2016 31 Aug 2019 JJA 2019 -40 ORAS 5 SST 1 -year timeseries: 40 -50 N 150 -130 W 18 SST clim SST 90 pctl 04 -2019 to 04 -2020 -30 -20 -10 10 20 30 40 Time-depth Temp. (minus 90 th pctl) section: 40 -50 N 150130 W 0 100 14 200 10 201904 201906 201908 201910 201912 202004 201906 -1. 8 201908 -1 201910 -0. 2 201912 202002 1 1. 8 Weak winds and high solar radiation gives rise to a long MHW event with resurgence a few months later. Hints of propagation deeper than 100 m 202004
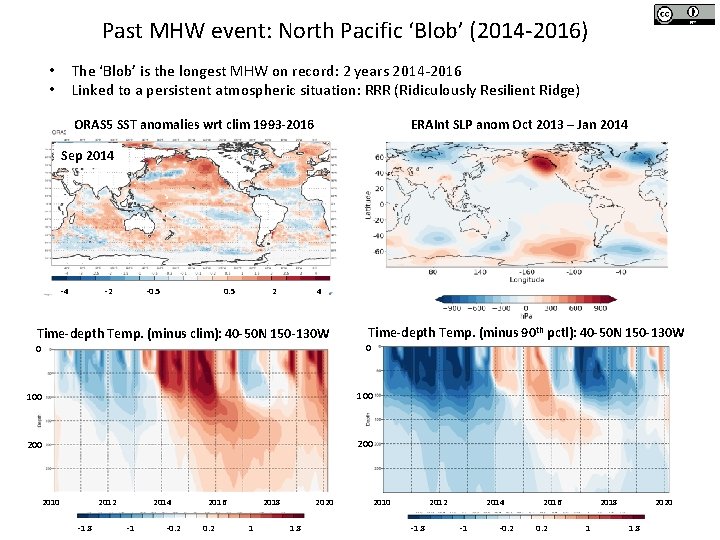
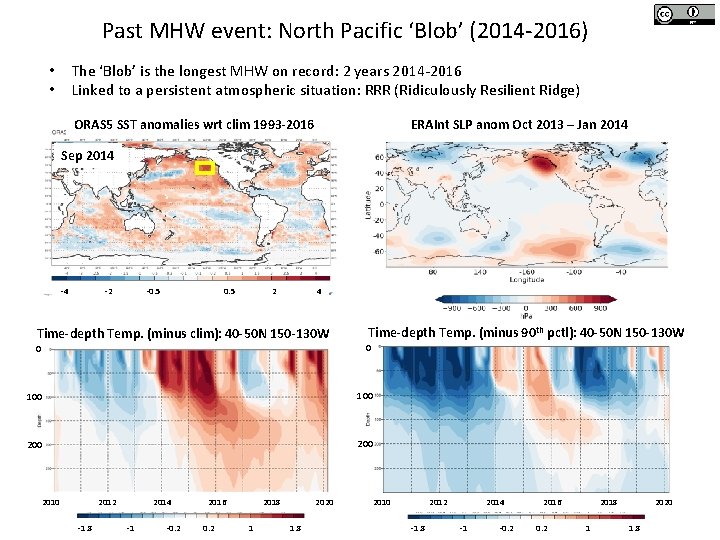
Past MHW event: North Pacific ‘Blob’ (2014 -2016) The ‘Blob’ is the longest MHW on record: 2 years 2014 -2016 Linked to a persistent atmospheric situation: RRR (Ridiculously Resilient Ridge) • • ORAS 5 SST anomalies wrt clim 1993 -2016 ERAInt SLP anom Oct 2013 – Jan 2014 Sep 2014 -4 -2 -0. 5 2 4 Time-depth Temp. (minus clim): 40 -50 N 150 -130 W Time-depth Temp. (minus 90 th pctl): 40 -50 N 150 -130 W 0 0 100 200 2012 -1. 8 2014 -1 -0. 2 2016 0. 2 2018 1 2020 1. 8 2010 2012 -1. 8 2014 -1 -0. 2 2016 0. 2 2018 1 2020 1. 8
Past MHW event: North Pacific ‘Blob’ (2014 -2016) The ‘Blob’ is the longest MHW on record: 2 years 2014 -2016 Linked to a persistent atmospheric situation: RRR (Ridiculously Resilient Ridge) • • ORAS 5 SST anomalies wrt clim 1993 -2016 ERAInt SLP anom Oct 2013 – Jan 2014 Sep 2014 -4 -2 -0. 5 2 4 Time-depth Temp. (minus clim): 40 -50 N 150 -130 W Time-depth Temp. (minus 90 th pctl): 40 -50 N 150 -130 W 0 0 100 200 2012 -1. 8 2014 -1 -0. 2 2016 0. 2 2018 1 2020 1. 8 2010 2012 -1. 8 2014 -1 -0. 2 2016 0. 2 2018 1 2020 1. 8
Conclusions and perspectives • CMEMS and C 3 S reanalyses can be used to monitor MHW events. Daily frequency essential for accurate detection. • CMEMS data allows to get insight into the depth dimension of MHW • CMEMS reanalyses multi-year records provide climate context. GREP ensemble will provide uncertainty estimates. CMEMS observation-based products could be used for validation • First glance process attribution using C 3 S atmospheric reanalyses. More sophisticated attribution possible through budget studies • Impact on ecosystems could be investigated in biogeochemical models • Extended range and seasonal forecasts capabilities provide potential for MWH forecasts. This will be investigated in the ECMWF seasonal forecasting system