Monitoring In Anesthesia In general we do monitoring


")


")

: : Indications: • •")

 • This is measured by inserting a catheter")


")


- Slides: 36
Monitoring In Anesthesia
In general we do monitoring for many things : 1. Oxygenation : we monitor it Clinically through patient color and pulse oximetry and Quantitively by using oxygen analyzer, equipped with an audible low oxygen concentration alarm. 2. Temperature : Continuous temperature measurements monitoring is mandatory if changes in temperature are suspected. 3. Circulation : we monitor it Clinically through pulse palpation, heart auscultation and monitoring intra-arterial pressure or oximetry and Quantitively by using ECG signals and arterial blood pressure measurements every 5 min 4. Ventilation : Clinically, we monitor it through a correctly positioned endotracheal tube, also observing chest expansion, and breath sounds over both lungs , Quantitively by ETCO 2 analysis, and by Arterial blood gas analysis for assessing both oxygen and ventilation.
• Pulse Oximetry: A non-invasive method for monitoring person’s oxygen saturation (So 2) , though its reading of So 2 isn’t always identical to reading through ABG analysis , which is the invasive method , but it consider a safe , convenient , noninvasive and not expensive method for monitoring So 2. Timing of Sp. O 2 monitoring : Before intubation >> Throughout the surgery >> After extubation and Recovery.
Con’t… • Allows beat to beat analysis of oxygenation. • Red and Infra-red light frequencies transmitted through a translucent portion. (finger-tip or earlobe) • Depends on differences in light absorption between oxy. Hb and deoxy. Hb. • Microprocessors then analyze amount of light absorbed by the 2 wavelengths, comparing measured values, then determining concentrations of oxygenated and deoxygenated forms through only arterial blood
Con’t … v. It is uncertain when there is severe vasoconstriction , due to the reduced pulsatile component of the signal , also in shock or cold extremities. v It is uncertain with certain hemoglobin: 1. when carboxyhemoglobin is present, it overestimates Sa. O 2 2. when methemoglobin is present, at an Sa. O 2 > 85%, it underestimates the saturation. v. It progressively under-reads the saturation as the hemoglobin falls (but it is not affected by polycythemia). v. It is affected by extraneous light. v It is uncertain when there is excessive movement of the patient.
Con’t. . . Pulse oximetry give us many information : • Sp. O 2: arterial O 2 saturation (oxygenation of the pt). • HR. • Peripheral perfusion status Example : loss of waveform in hypoperfusion states: hypotension and cold extremities. • Give an idea about the rhythm from plethysmography wave (arterial waveform) , Cannot identify the type of arrhythmia but can recognize it if irregularity is present. • Cardiac arrest Note : The pulse oximeter is not an indicator of the adequacy of alveolar ventilation
ECG monitoring : This is easily applied and gives information on heart rate and rhythm, and may warn of the presence of ischemia and acute disturbances of certain electrolytes (e. g. potassium and calcium). Timing of ECG monitoring : Before intubation >> Throughout the surgery >> After extubation and Recovery.
Con’t. . . • It can be monitored using three leads applied to the Right shoulder (Red), the Left shoulder (yellow) and the left lower chest (green), to give a tracing equivalent to standard lead II of the 12 -lead ECG. • Many ECG monitors now use five electrodes placed on the anterior chest to allow all the standard leads and V 5 to be displayed. • Note : The ECG alone gives no information on the adequacy of the cardiac output and it must be remembered that it is possible to have a virtually normal ECG in the absence of any cardiac output
Con’t. . . • Identification of P waves in lead 2 and it’s association with the QRS complex is useful in distinguishing a sinus rhythm from other rhythms. • Analysis of ST segment is used as an indicator of MI. eg: Depression : ischemia / Elevation : infarction • Over 85% of ischemic events can be detected by monitoring ST segment of leads 2 and V 5. • QRS beep ON must be heard at all times , NO silent monitors. • Note : Remember that your clinical judgement is much more superior to the monitor So always Check peripheral pulsations.
Blood pressure monitoring : • Non invasive blood pressure monitoring : This is the most common method of obtaining the patient’s blood pressure during anesthesia and surgery. • A pneumatic cuff with a width 40% of the arm circumference must be used and the internal inflatable bladder should encircle at least half the arm. If the cuff is too small , the blood pressure will be overestimated , and if it is too large it will be underestimated
Con’t. . . • NIBP can give rapid and accurate (± 9 mm. Hg) readings for : systolic BP, diastolic BP and MAP Mean Arterial Pressure (MAP) = DBP + 1/3(SBP – DBP) • Goal of NIBP monitoring : Avoid and Manage of sever Hypotension or Hypertension. • Risk of Hypotension episodes : myocardial ischemia , ischemic stroke, hypoperfusion state , metabolic acidosis, delayed recovery, renal shutdown • Risk of Hypertension episodes : myocardial ischemia, pulmonary edema , hemorrhagic stoke, hypertensive encephalopathy.
Con’t. . . Non-invasive BP measurement provides either intermittent or continuous readings , For intermittent : Ø By default every 5 minutes. Ø Every 3 minutes : immediately after spinal anesthesia , in conditions of hemodynamic instability , during hypotensive anesthesia. Ø Every 10 minutes : In awake patient under local anesthesia v. Heart rate is also determined and displayed.
Con’t. . . • Invasive blood pressure monitoring (Arterial BP): : Indications: • • Rapid moment to moment BP changes Frequent blood sampling Major surgeries (cardiac, thoracic, vascular) Circulatory therapies: vasoactive drugs, deliberate hypotension Failure of indirect BP: burns, morbid obesity Sever metabolic abnormalities Major trauma The radial artery at the wrist is the most common site for an arterial catheter. Alternatives are femoral, brachial and dorsalis pedis.
Con’t. . . v. Complications of arterial cannulation • Hematoma. • Vasospasm. • Thrombosis. • Embolization of air or thrombus. • Skin necrosis infection. • Nerve damage. • Disconnection and fatal blood loss
Central Venous line and Pressure (CVP) • This is measured by inserting a catheter via a central vein, usually the internal jugular or subclavian, so that its tip lies at the junction of the superior vena cava and right atrium. • It is then connected via a fluid-filled tube to a transducer that converts the pressure signal to an electrical signal • Then , This is amplified and displayed as both a waveform and pressure
Con’t. . . • Loss of circulating volume will reduce venous return to the heart, diastolic filling and preload, and be reflected as a low or falling CVP • CVP is usually monitored in operations during which there is the potential for major fluid shifts (e. g. prolonged abdominal surgery) or blood loss (e. g. major orthopaedic and trauma surgery). • CVP is driving force for filling RA + RV. • Central Venous Pressure (CVP): 1 -10 mm. Hg
Con’t. . . Internal jugular vein v. Advantages of Internal jugular vein • Internal jugular vein lies in groove between sternal and clavicular heads of sternocleidomastoid muscle , it’s lateral and slightly anterior to carotid artery So it is readily identifiable landmark • Short straight course to SVC. • Easy intra OP access for anesthesiologist at patient’s head • High success rate 90 -99% v. Complications of Internal jugular vein ?
Con’t. . . • Subclavian vein: • Easier to insert Vs IJV • Better patient comfort Vs IJV. • Higher Risk of pneumothorax 2% • External jugular: • • Easy to cannulate if visible. no risk of pneumothorax, high risk of bleeding. 20% : cannot access central circulation
Ventiliation monitoring : • As we known before we must monitor a patient to ensure adequate ventilation of the patient. Clinically, we monitor it through a correctly positioned endotracheal tube, also observing chest expansion, and breath sounds over both lungs Quantitively by capnography and ETCO 2 analysis, and by Arterial blood gas analysis for assessing both oxygen and ventilation.
Con’t. . . • What is Capnography ? Continuous CO 2 measurement displayed as a waveform sampled from the patient’s airway during ventilation. • What is Et. CO 2 ? A point on the capnogram. It is the final measurement at the endpoint of the patient’s expiration before inspiration begins. It is usually the highest CO 2 measurement during ventilation.
Con’t. . . • Phases of the capnogram : • Inspiratory baseline • Expiratory Upstroke • Expiratory Plateau • End-tidal ( Et. CO 2) • Expiratory Downstroke
Con’t. . . • Applications : • confirmation of intubation • monitoring for circuit disconnection • identification of airway obstruction • rebreathing/metabolic monitoring
Con’t. . . • • Normal range: 35 -45 mm. Hg. Value (data gained from capnography & ETCO 2): Endo tachial tube : esophageal intubation. Ventilation: hypo & hyperventilation, curare cleft (spontaneous breathing trials). • Pulmonary perfusion: pulmonary embolism. • Breathing circuit: disconnection, kink, leakage, obstruction, unidirectional valve dysfunction, rebreathing, exhausted soda lime. • Cardiac arrest : adequacy of resuscitation during cardiac arrest, and prognostic value (outcome after cardiac arrest).
Monitoring Temperature Objective § aid in maintaining appropriate body temperature Application § readily available method to continuously monitor temperature if changes are intended, anticipated or suspected Methods § § thermostat temperature sensitive chemical reactions
Con’t. . . • Potential heat loss or risk of hyperthermia necessitates continuous temperature monitoring • Normal heat loss during anesthesia averages 0. 5 - 1 C per hour, but usually not more that 2 - 3 C • Temperature below 34 C may lead to significant morbidity • Hypothermia develops when thermoregulation fails to control balance of metabolic heat production and environment heat loss • Normal response to heat loss is impaired during anesthesia • Those at high risk are elderly, burn patients neonates, spinal cord injuries
Con’t. . . Monitoring Sites • Tympanic • Esophagus • Rectum • Nasopharynx • Blood (PA catheter) • Skin
RULES NEVER to FORGET: • Never start induction with a missing monitor: ECG, BP, Sp. O 2. • Never remove any monitors before extubation & recovery. • Never ignore an alarm ALWAYS Remember that your clinical sense and judgement is better than and superior to any monitor. You are a doctor you are not a robot , the monitor is present to help you not to be ignored and not to cancel you brain.
cyanosis • Bluish discoloration of the skin and mucous membranes due to the high levels of deoxygenated hemoglobin or its derivatives, including methemoglobin and sulfhemoglobin. • Defined as the presence of 5 gm/d. L of deoxygenated hemoglobin. - Hb level = 15 gm/d. L, 5 gm/d. L release O 2 which leaves 10 gm/d. L of oxyhemoglobin -Sa. O 2 = Oxy. Hb / (Oxy. Hb + Deoxy. Hb) = 10 / (10 + 5) = 66% -SAO 2 of 66% corresponds to Pa. O 2 of 35 mm. Hg.
• In severely anemic patients, oxygen saturation at which cyanosis is detectable will be lower than in normal patients. - Hb level = 10 gm/d. L, 5 gm/d. L release O 2 -Sa. O 2 = Oxy. Hb / (oxy. Hb + Deoxy. Hb) = 5 / (5 + 5) = 50% -SAO 2 of 50% corresponds to Pa. O 2 of only 27 mm. Hg. • Under optimal conditions, the earliest that cyanosis can be appreciated is at an oxygen saturation of 85%(Pa. O 2 of 55 mm. Hg). • At a Sa. O 2 of 70% (Pa. O 2 of 40 mm. Hg) most clinicians will be able to detect cyanosis.
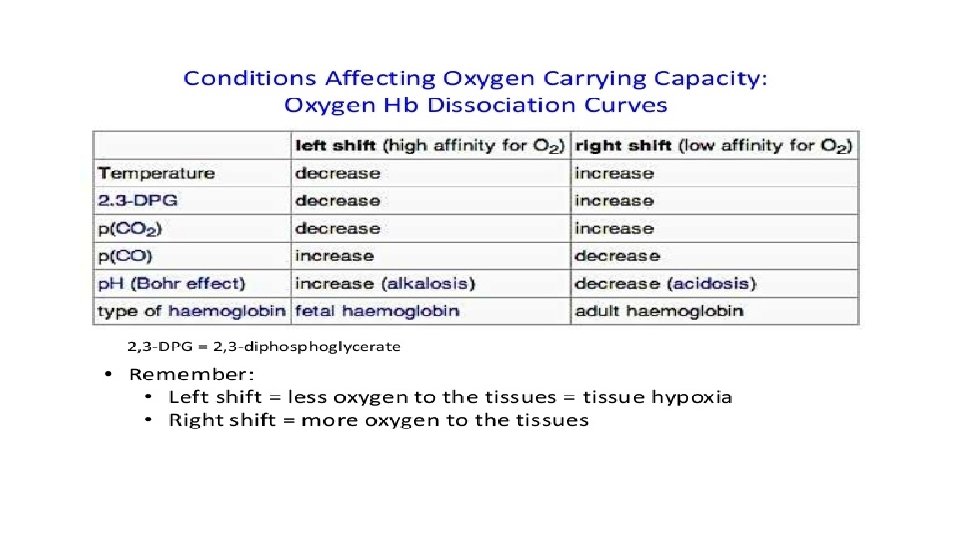
O 2 -Hb dissociation curve
• Sigmoidal in character- describes the relationship between oxygen tension (Pa. O 2) and binding (saturation). • When Pa. O 2 is low ( Pa. O 2<60%), the hemoglobin affinity to oxygen falls rapidly, explaining the sharp sloping. • Shifting in the curve is a normal process depending on the site of circulation. • Right shift : Hb releases oxygen to tissues; muscles and placenta, more rapidly. • Left shift: Hb has a higher affinity for oxygen in the lungs • Causes of shifting Include changes in Pa. CO 2, Ph, temperature and [2, 3 DPG]. • The lowest acceptable O 2 saturation level is 90%
monitored parameters • Vital signs: • • Heart rate Heart rhythm Respiratory rate and depth Mucous membrane color and skin appearance Capillary refill time Pulse strength Blood pressure Body temperature • Best indicator for the patients wellbeing
• Reflexes • Involuntary response to stimulus • Palpebral, corneal, pedal, swallowing, laryngeal, and papillary light reflexes • Indicators of anesthetic depth. • Parameters offer predictable responses to anesthesia at various depths. • May be affected by drugs, disease, or individual response variation. • Monitor anesthetized patients as often as possible; continuously is ideal.
Normal adult parameters in general anesthesia § Systolic Blood Pressure § Diastolic Blood Pressure § Heart Rate § Respiratory Rate § Oxygen sat. by oximetry § End Tidal CO 2 tension § Skin appearance § Color § Temperature § Urine Production SBP DBP HR RR Sp. O 2 ETCO 2 85 – 160 50 – 95 50 – 100 8 – 20 95 – 100 33 – 45 warm, dry pink 36 – 37. 5 >= 0. 5 mm. Hg bpm rpm % mm. Hg C ml. kg-1. min-1 O
§ Central Venous Pressure § Pulmonary Artery Pressure § Pulmonary Capillary Wedge pressure § Mixed venous oxygen saturation § Cardiac Output §Mean Arterial Pressure *MAP = DBP + 1/3 ( SBP – DBP ) CVP PAP PCWP Sv. O 2 CO MAP 1 – 10 10 – 20 5 – 15 75 4. 5 – 6 80 – 120 mm. Hg % 1. Min-1 mm. Hg