
Monitoring and modelling of POP pollution main activities



- Slides: 23
Monitoring and modelling of POP pollution: main activities and results Alexey Gusev on behalf of MSC-E and CCC Joint EMEP/WGE meeting, Geneva, 2016
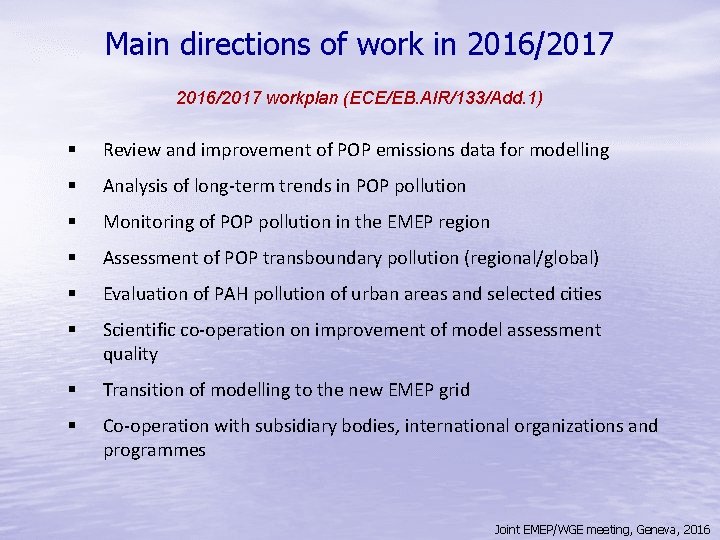
Main directions of work in 2016/2017 workplan (ECE/EB. AIR/133/Add. 1) § Review and improvement of POP emissions data for modelling § Analysis of long-term trends in POP pollution § Monitoring of POP pollution in the EMEP region § Assessment of POP transboundary pollution (regional/global) § Evaluation of PAH pollution of urban areas and selected cities § Scientific co-operation on improvement of model assessment quality § Transition of modelling to the new EMEP grid § Co-operation with subsidiary bodies, international organizations and programmes Joint EMEP/WGE meeting, Geneva, 2016
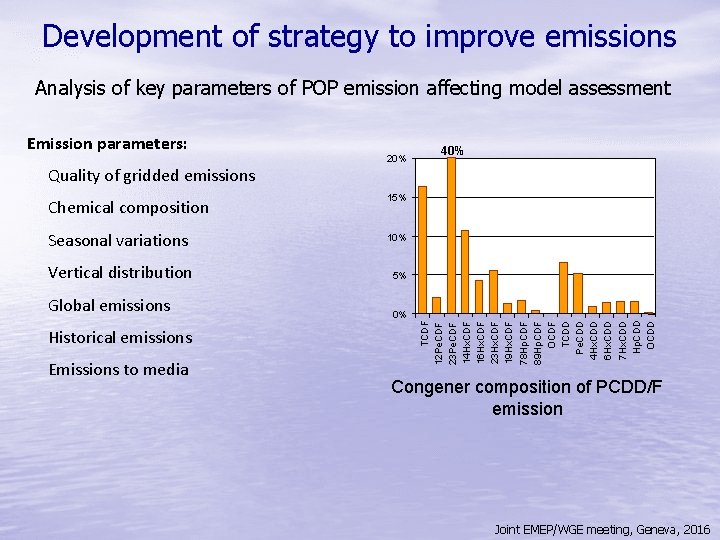
Development of strategy to improve emissions Analysis of key parameters of POP emission affecting model assessment Quality of gridded emissions 20% Chemical composition 15% Seasonal variations 10% Vertical distribution 5% Global emissions 0% Historical emissions Emissions to media 40% TCDF 12 Pe. CDF 23 Pe. CDF 14 Hx. CDF 16 Hx. CDF 23 Hx. CDF 19 Hx. CDF 78 Hp. CDF 89 Hp. CDF OCDF TCDD Pe. CDD 4 Hx. CDD 6 Hx. CDD 7 Hx. CDD Hp. CDD OCDD Emission parameters: Congener composition of PCDD/F emission Joint EMEP/WGE meeting, Geneva, 2016
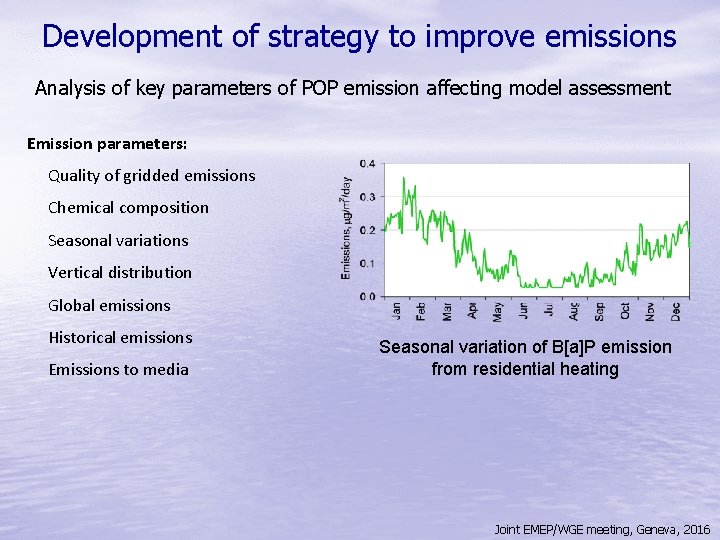
Development of strategy to improve emissions Analysis of key parameters of POP emission affecting model assessment Emission parameters: Quality of gridded emissions Chemical composition Seasonal variations Vertical distribution Global emissions Historical emissions Emissions to media Seasonal variation of B[a]P emission from residential heating Joint EMEP/WGE meeting, Geneva, 2016
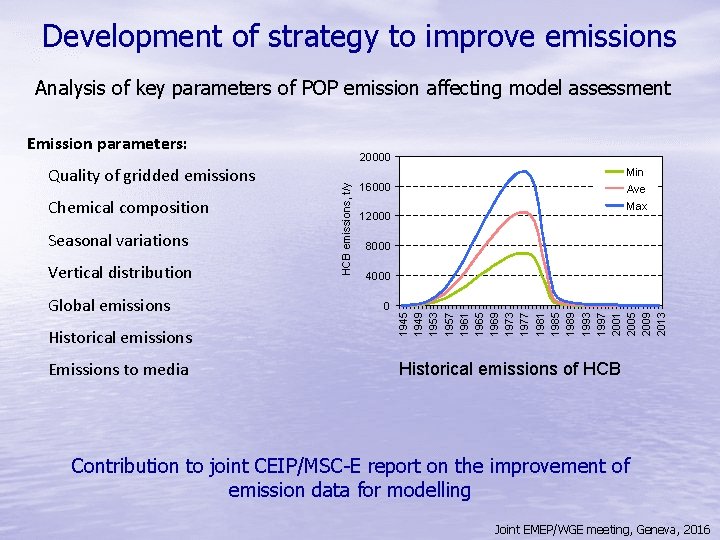
Development of strategy to improve emissions Analysis of key parameters of POP emission affecting model assessment Emission parameters: Seasonal variations Vertical distribution Global emissions Historical emissions Emissions to media Min Ave 16000 Max 12000 8000 4000 0 1945 1949 1953 1957 1961 1965 1969 1973 1977 1981 1985 1989 1993 1997 2001 2005 2009 2013 Chemical composition HCB emissions, t/y Quality of gridded emissions 20000 Historical emissions of HCB Contribution to joint CEIP/MSC-E report on the improvement of emission data for modelling Joint EMEP/WGE meeting, Geneva, 2016
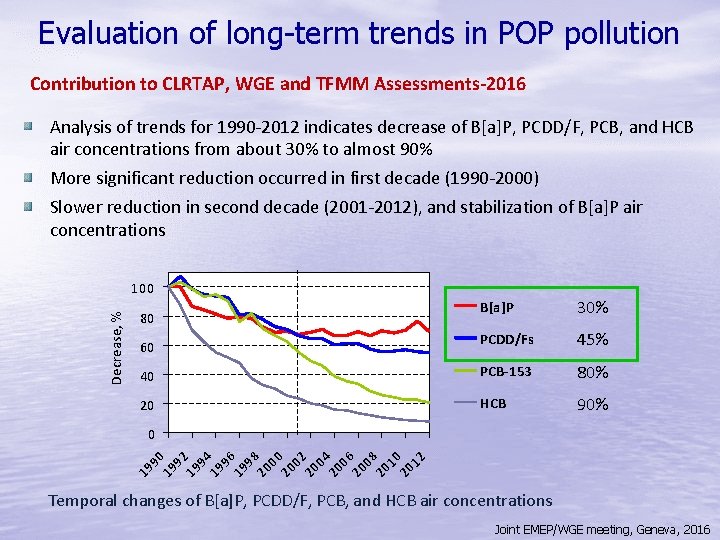
Evaluation of long-term trends in POP pollution Contribution to CLRTAP, WGE and TFMM Assessments-2016 Analysis of trends for 1990 -2012 indicates decrease of B[a]P, PCDD/F, PCB, and HCB air concentrations from about 30% to almost 90% More significant reduction occurred in first decade (1990 -2000) Slower reduction in second decade (2001 -2012), and stabilization of B[a]P air concentrations Decrease, % 100 B[a]P 30% PCDD/Fs 45% 40 PCB-153 80% 20 HCB 90% 80 60 96 19 98 20 00 20 02 20 04 20 06 20 08 20 10 20 12 94 19 92 19 19 19 90 0 Temporal changes of B[a]P, PCDD/F, PCB, and HCB air concentrations Joint EMEP/WGE meeting, Geneva, 2016
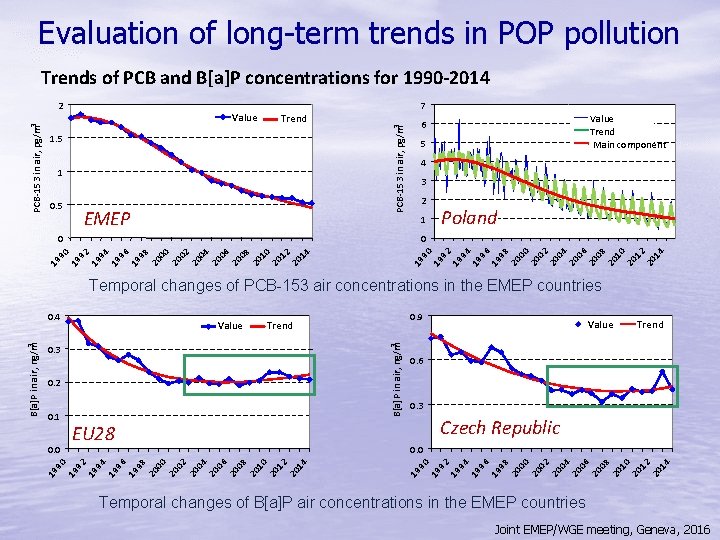
Evaluation of long-term trends in POP pollution Trends of PCB and B[a]P concentrations for 1990 -2014 Value 1. 5 1 0. 5 7 Trend PCB-153 in air, pg/m 3 2 EMEP Value Trend Main component 6 5 4 3 2 1 Poland 0 19 92 19 94 19 96 19 98 20 00 20 02 20 04 20 06 20 08 20 10 20 12 20 14 2 19 9 0 0 Temporal changes of PCB-153 air concentrations in the EMEP countries 0. 2 0. 0 EU 28 Value Trend 0. 6 0. 3 Czech Republic 0. 0 19 92 19 94 19 96 19 98 20 00 20 02 20 04 20 06 20 08 20 10 20 12 20 14 0. 3 0. 1 0. 9 Trend 3 B[a]P in air, ng/m Value 19 90 19 92 19 94 19 96 19 98 20 00 20 02 20 04 20 06 20 08 20 10 20 12 20 14 3 B[a]P in air, ng/m 0. 4 Temporal changes of B[a]P air concentrations in the EMEP countries Joint EMEP/WGE meeting, Geneva, 2016
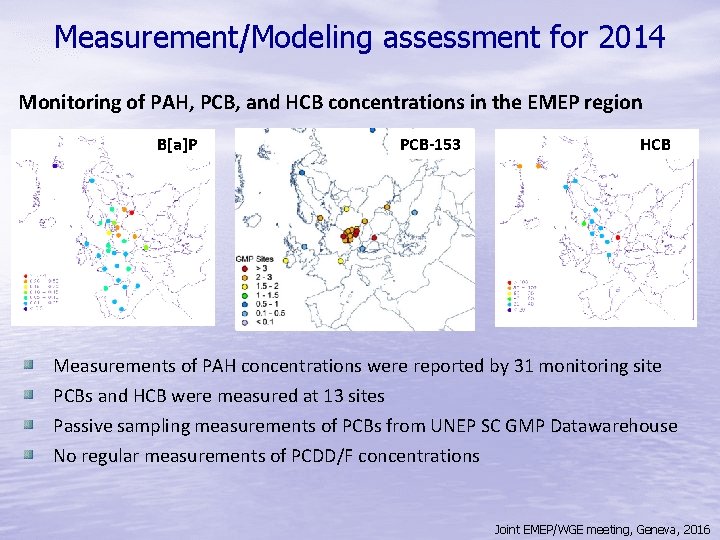
Measurement/Modeling assessment for 2014 Monitoring of PAH, PCB, and HCB concentrations in the EMEP region B[a]P PCB-153 HCB Measurements of PAH concentrations were reported by 31 monitoring site PCBs and HCB were measured at 13 sites Passive sampling measurements of PCBs from UNEP SC GMP Datawarehouse No regular measurements of PCDD/F concentrations Joint EMEP/WGE meeting, Geneva, 2016
Measurement/Modeling assessment for 2014 Evaluation of PCB-153 pollution levels in the EMEP region Annual mean modelled PCB-153 air concentrations, 2014 Measurement/modelling agreement PCB-153 in air, pg/m 3 3 Observed Modelled 2 1 NO 2 NO 42 NO 90 14 SE 12 SE 36 FI 9 DE 8 DE 3 DE 2 DE 1 DE CZ 3 0 Evaluation vs. measurements of EMEP monitoring stations • Modelled PCB-153 air concentrations agree with measurements • Variations of PCB-153 air concentrations from 2013 to 2014 amounted to about 30% Joint EMEP/WGE meeting, Geneva, 2016
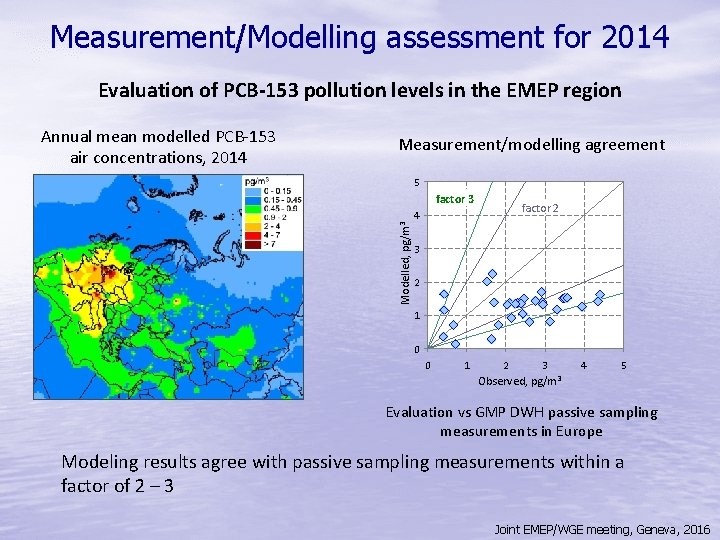
Measurement/Modelling assessment for 2014 Evaluation of PCB-153 pollution levels in the EMEP region Annual mean modelled PCB-153 air concentrations, 2014 Measurement/modelling agreement 5 Modelled, pg/m 3 factor 2 4 3 2 1 0 0 1 2 3 Observed, pg/m 3 4 5 Evaluation vs GMP DWH passive sampling measurements in Europe Modeling results agree with passive sampling measurements within a factor of 2 – 3 Joint EMEP/WGE meeting, Geneva, 2016
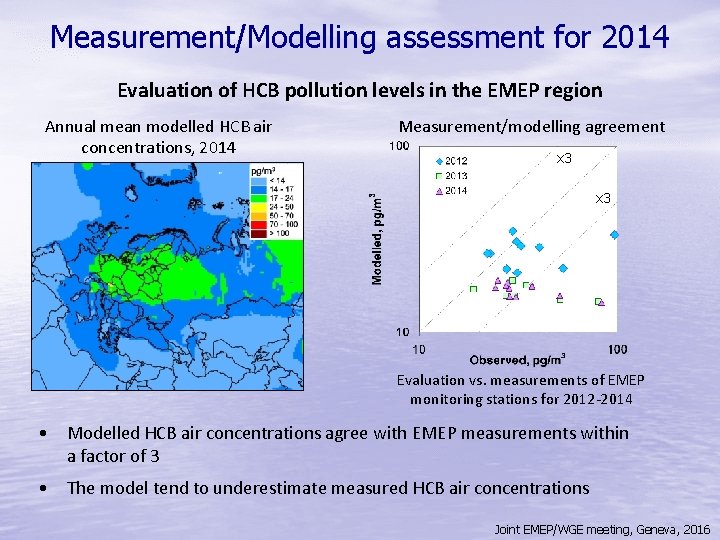
Measurement/Modelling assessment for 2014 Evaluation of HCB pollution levels in the EMEP region Annual mean modelled HCB air concentrations, 2014 Measurement/modelling agreement x 3 Evaluation vs. measurements of EMEP monitoring stations for 2012 -2014 • Modelled HCB air concentrations agree with EMEP measurements within a factor of 3 • The model tend to underestimate measured HCB air concentrations Joint EMEP/WGE meeting, Geneva, 2016
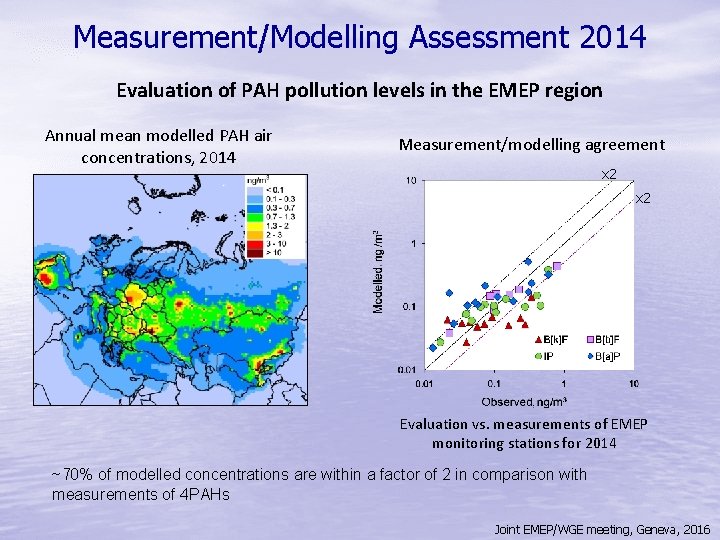
Measurement/Modelling Assessment 2014 Evaluation of PAH pollution levels in the EMEP region Annual mean modelled PAH air concentrations, 2014 Measurement/modelling agreement x 2 Evaluation vs. measurements of EMEP monitoring stations for 2014 ~70% of modelled concentrations are within a factor of 2 in comparison with measurements of 4 PAHs Joint EMEP/WGE meeting, Geneva, 2016
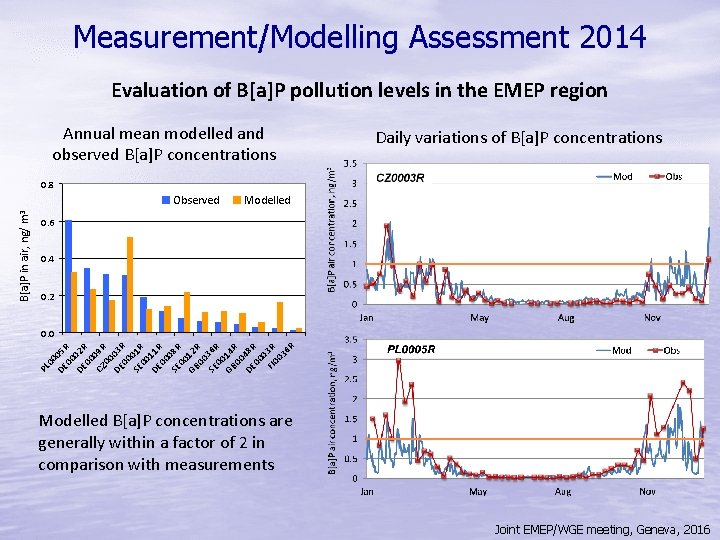
Measurement/Modelling Assessment 2014 Evaluation of B[a]P pollution levels in the EMEP region Annual mean modelled and observed B[a]P concentrations Daily variations of B[a]P concentrations 0. 8 Modelled 0. 6 0. 4 0. 2 0. 0 PL 00 DE 05 R 00 DE 02 R 00 CZ 09 R 00 DE 03 R 00 SE 01 R 00 DE 11 R 00 SE 08 R 00 GB 12 R 00 SE 36 R 00 GB 14 R 00 DE 48 R 00 0 FI 3 R 00 36 R B[a]P in air, ng/ m 3 Observed Modelled B[a]P concentrations are generally within a factor of 2 in comparison with measurements Joint EMEP/WGE meeting, Geneva, 2016
Measurement/Modelling Assessment of PAH pollution, 2014 Transboundary transport of pollution Contribution, % 100% PAH deposition to EMEP countries 75% Transboundary transport 50% 25% National emissions FY R M ac ed o Gr nia B eec Geelar e Bu orgus G lg ia Cz ec ermaria h Al an Re ba y pu ni a Ky. Slovblic rg ak Sloizst ia v an Seenia rb Bo Lit. Fran ia sn Dh c ia &H enuane er Hu ma ia ze ng rk go ar v y Tu Uzb Laina rk ek tv Swme ist ia Ne itz nistan th erl an er an l Cr andd Finoat s i Az Est lan a er on d Swbaij ia e a Cy denn M p ol ru d s A Lu N usova Lie xem or tria ch b wa te ou y n r Icesteig Ar la n mn M end on ia ac o 0% PAH deposition in 2014 • For about 70% of the countries contribution of transboundary fluxes exceeded contribution of national emissions to deposition • Substantial part of deposition originated from emissions of several countries (the Russian Federation, Ukraine, Kazakhstan, Spain, and Poland) Joint EMEP/WGE meeting, Geneva, 2016
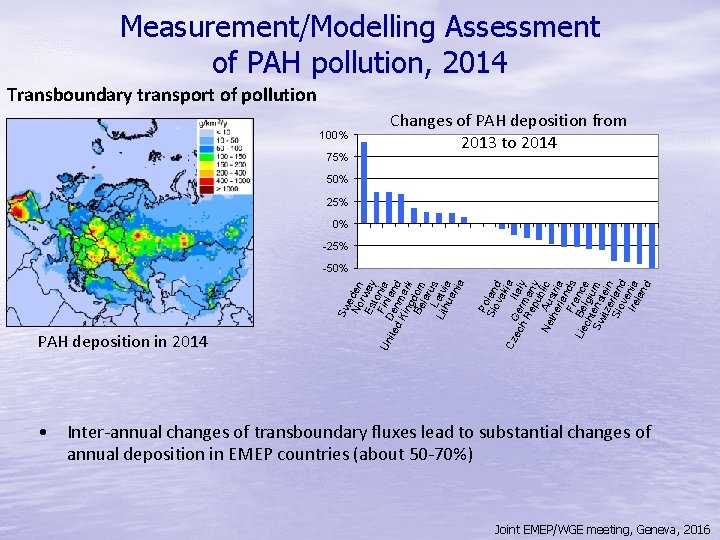
Measurement/Modelling Assessment of PAH pollution, 2014 Transboundary transport of pollution 100% 75% Changes of PAH deposition from 2013 to 2014 50% 25% 0% -25% P Slooland va kia Cz ec Ger Italy h. R m ep any u Ne Au blic the stri rla a Fra nds Lie Be nce ch lgi Sw tens um itze tein Slo rlan ve d Ire nia lan d PAH deposition in 2014 Sw e No den Es rway t Finonia Un D ite en land d. K m ing ark Be dom lar us L Lit atvi hu a an ia -50% • Inter-annual changes of transboundary fluxes lead to substantial changes of annual deposition in EMEP countries (about 50 -70%) Joint EMEP/WGE meeting, Geneva, 2016
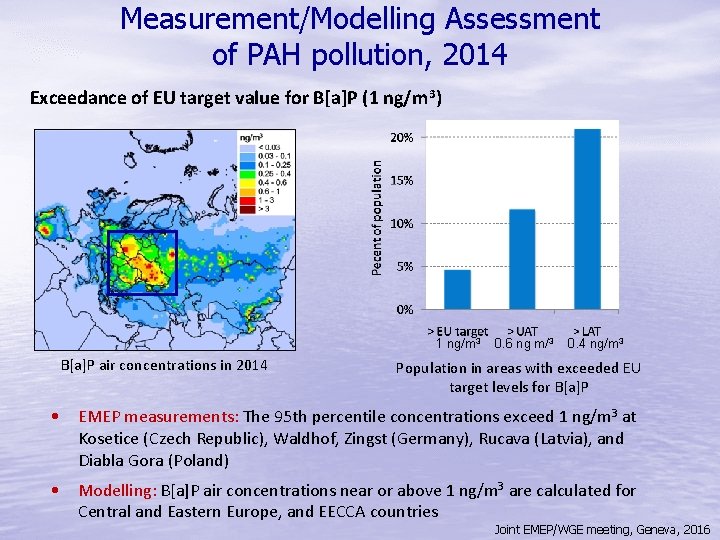
Measurement/Modelling Assessment of PAH pollution, 2014 Exceedance of EU target value for B[a]P (1 ng/m 3) 1 ng/m 3 B[a]P air concentrations in 2014 0. 6 ng m/3 0. 4 ng/m 3 Population in areas with exceeded EU target levels for B[a]P • EMEP measurements: The 95 th percentile concentrations exceed 1 ng/m 3 at Kosetice (Czech Republic), Waldhof, Zingst (Germany), Rucava (Latvia), and Diabla Gora (Poland) • Modelling: B[a]P air concentrations near or above 1 ng/m 3 are calculated for Central and Eastern Europe, and EECCA countries Joint EMEP/WGE meeting, Geneva, 2016
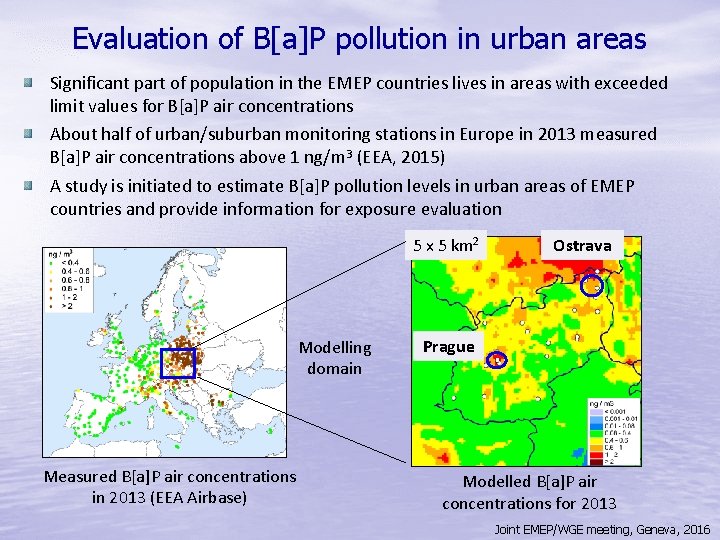
Evaluation of B[a]P pollution in urban areas Significant part of population in the EMEP countries lives in areas with exceeded limit values for B[a]P air concentrations About half of urban/suburban monitoring stations in Europe in 2013 measured B[a]P air concentrations above 1 ng/m 3 (EEA, 2015) A study is initiated to estimate B[a]P pollution levels in urban areas of EMEP countries and provide information for exposure evaluation 5 x 5 km 2 Modelling domain Measured B[a]P air concentrations in 2013 (EEA Airbase) Ostrava Prague Modelled B[a]P air concentrations for 2013 Joint EMEP/WGE meeting, Geneva, 2016
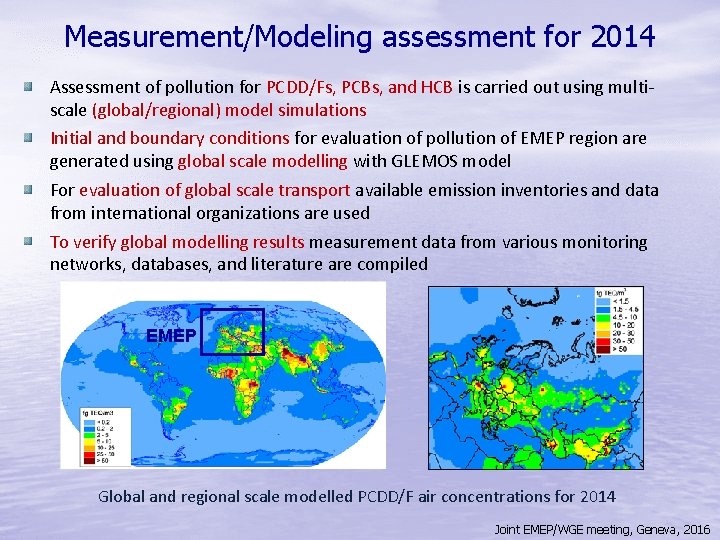
Measurement/Modeling assessment for 2014 Assessment of pollution for PCDD/Fs, PCBs, and HCB is carried out using multiscale (global/regional) model simulations Initial and boundary conditions for evaluation of pollution of EMEP region are generated using global scale modelling with GLEMOS model For evaluation of global scale transport available emission inventories and data from international organizations are used To verify global modelling results measurement data from various monitoring networks, databases, and literature are compiled EMEP Global and regional scale modelled PCDD/F air concentrations for 2014 Joint EMEP/WGE meeting, Geneva, 2016
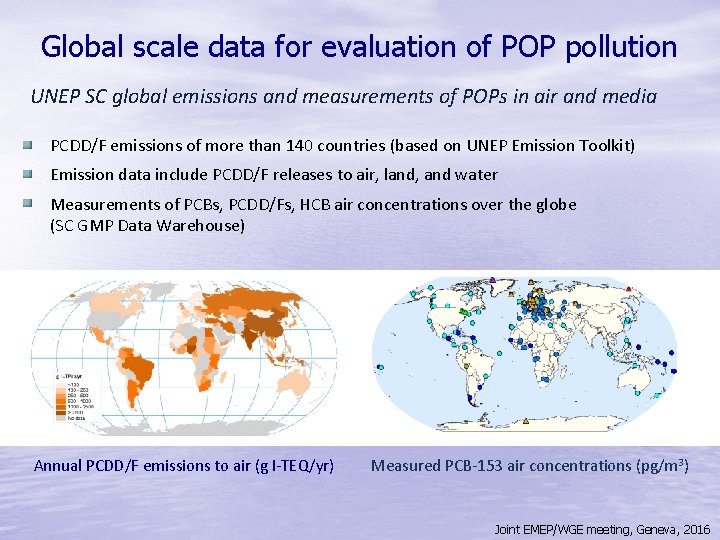
Global scale data for evaluation of POP pollution UNEP SC global emissions and measurements of POPs in air and media PCDD/F emissions of more than 140 countries (based on UNEP Emission Toolkit) Emission data include PCDD/F releases to air, land, and water Measurements of PCBs, PCDD/Fs, HCB air concentrations over the globe (SC GMP Data Warehouse) Annual PCDD/F emissions to air (g I-TEQ/yr) Measured PCB-153 air concentrations (pg/m 3) Joint EMEP/WGE meeting, Geneva, 2016
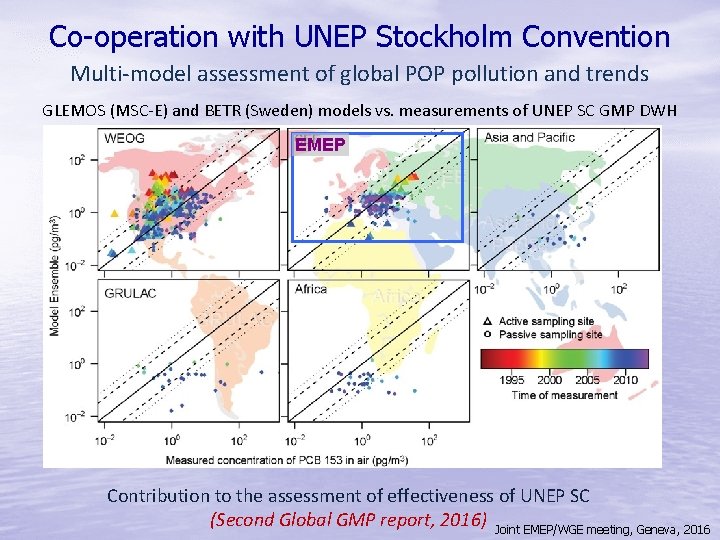
Further development of POP modelling approach Research activities related to regional and global scale modelling: q Refinement of parameterization of atmospheric transformation/removal processes and exchange with media q Further development of source-receptor methodology accounting for multi-media transport of POPs q Analysis of congener composition of emission and concentrations in media (PCDD/Fs, PCBs) q Multi-scale modelling to support transition to the New EMEP grid q Multi-model study of global POP transport applying UNEP SC GMP measurement data GLEMOS (EMEP/MSC-E) BETR-Research (Switzerland/Sweden) Measured and modelled PCB 153 in air for the period 2004 -2013, pg/m 3 Joint EMEP/WGE meeting, Geneva, 2016
Co-operation with UNEP Stockholm Convention Multi-model assessment of global POP pollution and trends GLEMOS (MSC-E) and BETR (Sweden) models vs. measurements of UNEP SC GMP DWH EMEP Contribution to the assessment of effectiveness of UNEP SC (Second Global GMP report, 2016) Joint EMEP/WGE meeting, Geneva, 2016
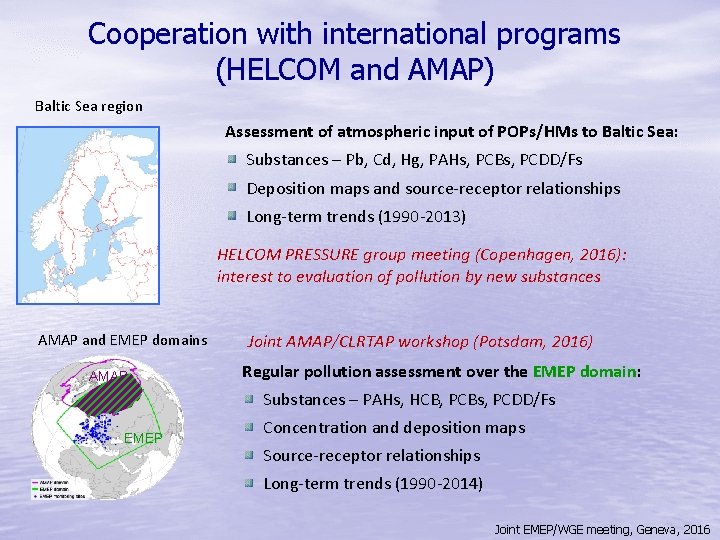
Cooperation with international programs (HELCOM and AMAP) Baltic Sea region Assessment of atmospheric input of POPs/HMs to Baltic Sea: Substances – Pb, Cd, Hg, PAHs, PCBs, PCDD/Fs Deposition maps and source-receptor relationships Long-term trends (1990 -2013) HELCOM PRESSURE group meeting (Copenhagen, 2016): interest to evaluation of pollution by new substances AMAP and EMEP domains AMAP Joint AMAP/CLRTAP workshop (Potsdam, 2016) Regular pollution assessment over the EMEP domain: Substances – PAHs, HCB, PCBs, PCDD/Fs EMEP Concentration and deposition maps Source-receptor relationships Long-term trends (1990 -2014) Joint EMEP/WGE meeting, Geneva, 2016
MSC-E work-plan elements for 2017 § Operational monitoring and modelling of POP transboundary pollution within EMEP § Model evaluation of POP (B[a]P) contamination of highly populated regions (urban areas) § Evaluation of intercontinental transport and contribution of secondary sources § Refinement of model parameterization of phase partitioning and inter-media exchange of POPs § Contribution to development of emission strategy to improve emissions § Transition of POP operational modelling to the new EMEP grid § Co-operation and exchange of information on POP pollution with subsidiary and international bodies (TFMM, TF HTAP, UNEP, AMAP, HELCOM etc) Joint EMEP/WGE meeting, Geneva, 2016