MONITORING AND INTERPRETATION OF MICROSEISMS INDUCED BY FLUID

MONITORING AND INTERPRETATION OF MICROSEISMS INDUCED BY FLUID INJECTION N. R. Warpinski Sandia National Labs

MICROSEISMS INDUCED BY FLUID INJECTION • Outline – Microseismic Overview – Interpretation • Are Results Meaningful For Long-Term Fluid Injection • How Can The Results Be Interpreted – Examples • Simulated (Based On Actual Results) • Actual Field Tests

MICROSEISMS INDUCED BY HYDRAULIC FRACTURING Microseisms are generally seismic energy emitted by shear slippage along weakness planes in the earth Hydraulic Fracture Natural Fracture • Increases Stress • Increases Pore Pressure Natural Fractures • Are Destabilized & Slip Leakoff Stress P smin Slippage • Emits Seismic Energy smax
 • Velocities")
MICROSEISMS • Slippage Emits Both P & S Waves (Compressional & Shear) • Velocities Are Different P Wave > S Wave • Detected At Tri-Axial Receiver SHEAR SLIPPAGE S(t 1) P X S Y Y X RECEIVER S(t 2) P(t 2)
 Treatment Well (Too Noisy) RECEIVERS MICROSEISM FRACTURE RECEIVERS")
MICROSEISMIC MAPPING Surface (Too Far) Treatment Well (Too Noisy) RECEIVERS MICROSEISM FRACTURE RECEIVERS

MICROSEISMIC MAPPING Two Approaches For Offset Wells MULTI-WELL MICROSEISM SINGLE-WELL MICROSEISM FRACTURE RECEIVERS

SINGLE-WELL MAPPING • Distance And Elevation From Arrival Times • Direction From P-wave Particle Motion Also • Microseisms: Small Amplitude, High Frequency • Receiver Distance = Typical Interwell Spacing Requires: High Quality Receivers MICROSEISM RECEIVERS RESERVOIR FRACTURE

EXAMPLE MICROSEISM TRACE S P 0 12. 5 25 msec
 • Automatic Event Processing –")
MICROSEISMIC TECHNOLOGY PROCESSING • Automatic Event Detection (Event Comb) • Automatic Event Processing – P-Wave Arrival – S-Wave Arrival – P-Wave Particle Motion • Location Processing – Homogeneous Model • Joint P-S Distance Regression – Layered Model • Vidale/Nelson Algorithm Elevation, Distance Azimuth
")
ADDITIONAL DATA REQUIRED • Formation Velocity – Advanced Sonic Log (P & S Waves) – Crosswell Survey • Receiver Orientation – Perforations – Air Gun Or Other Source • Full-interval Scan • Surveys – Surface Survey (Well-to-well) – Deviation Surveys

MICROSEISMIC TECHNOLOGY Procedure Prior Day • Mobilize and Set Up on Site • Orientation With Airgun or Perforations • Background Monitoring Frac Day • Fracture Monitoring • Real-Time or Near-Real-Time Processing – Well-Site Result • Demobilize
 Camborne Granite (UKDOE) Austin")
MICROSEISMIC VIEWING DISTANCES • • • Fenton Hill Granite (LANL) Camborne Granite (UKDOE) Austin Chalk (LANL) Frio Sandstone (ARCO) North Slope Sandstone (ARCO) Barnett Shale Mesaverde Sandstone Frontier Sandstone Cotton Valley Sandstone (UPR) 5000 ft 4500 ft 2500 ft 1500 ft 3000 ft 800 ft 1000 ft 2000 ft

MICROSEISMIC LIMITATIONS • Need An Offset Well – Treatment Well: Difficult Environment • Offset-Well Limitations – Spacing Between Treatment and Monitor Well Cannot Be Excessive – Quiet Environment (No Bubbling Perforations) • Reservoir Difficulties – Attenuation, Layering, Cultural Noise • Receiver Orientation • Physical Receiver Limitations – Size, Temperature, Pressure, Etc

MICROSEISMIC INTERPRETATION u Microseisms Originate In An Envelope Surrounding The Fracture, Giving – – Height Length Azimuth Asymmetry ENVELOPE MICROSEISMS INDUCED BY LEAKOFF MICROSEISMS INDUCED BY STRESS CHANGES NEAR TIP NATURAL FRACTURES
 LEAKOFF TENSILE COMPRESSIVE PRESSURE STRESS Pf")
MICROSEISMIC INTERPRETATION Highly Compressible Formation Fluids (Gas Reservoir) LEAKOFF TENSILE COMPRESSIVE PRESSURE STRESS Pf sc LEAKOFF Pi SHEAR DISTANCE NORMAL TO FRACTURE
 TENSILE LEAKOFF PRESSURE COMPRESSIVE STRESS Pf sc")
MICROSEISMIC INTERPRETATION Incompressible Formation Fluids (Gas Reservoir) TENSILE LEAKOFF PRESSURE COMPRESSIVE STRESS Pf sc LEAKOFF Pi SHEAR DISTANCE NORMAL TO FRACTURE
 5000 DATA 2")
FULL POROELASTIC EFFECTS Displacement At 1000 ft Distance (Normal To Fracture) 5000 DATA 2 D Fracture k=50 md f=0. 2 n=0. 22 E=6. e 6 psi H=100 ft Pf=4500 psi Pi=2600 psi sc=4000 psi Depth (ft) 5500 6000 0. 01 hr 6500 0. 1 hr 1. 0 hr 10 hr 7000 0 0. 02 0. 04 0. 06 0. 08 0. 12 Displacement (inches) Based On M. B. Smith Analysis In SPEJ, 1985 0. 14 0. 16

PORE PRESSURE DESTABILIZATION Historical Data: Earthquake Hazard Associated With Deep Well Injection A Report To The U. S. Environmental Protection Agency USGS Geological Survey Bulletin 1951 C. Nicholson & R. L. Wesson, 1990 • Long-Term Injections – Waste Injection And Oil-Field Operations – Large Destabilized Area • Moderate Earthquakes Detected At The Surface

Las Alamos Hot Dry Rock Results

Camborne Hot Dry Rock Side View of Microseisms Scale = 200 m 3 Hours 11 Hours 27 Hours
 inj prod mon")
SAN ANDRES WATERFLOOD (LANL) inj prod mon

MICROSEISMIC MONITORING OF LONG-TERM INJECTIONS Methodology For Microseismic Monitoring • Monitor Initial Injection Behavior – Image The Fracture – Obtain Fracture Azimuth • Examine Attributes Of Late-Time Behavior – Clustering And Linear Trends – Source Parameters And Stress Relief • High Stress Relief Associated With Tip Microseisms • Low Stress Relief Associated With Leakoff Microseisms

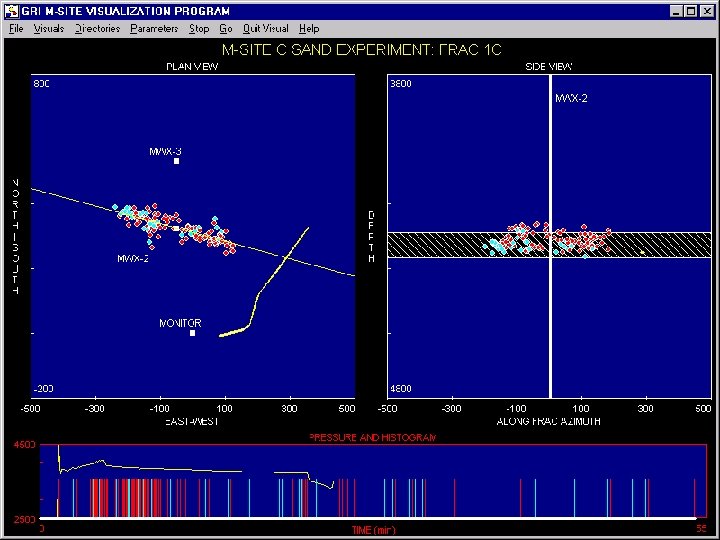
VALIDATION • How Does the Seismically Disturbed Zone Relate to the Actual Fracture Geometry • M-Site Experiments – Height • Downhole. Tiltmeters Measured Deformation – Length • Fracture Intersected a Lateral Well 287 ft from Treatment Well – Azimuth (2 Fracture Intervals) • Lateral Wells Intersected Fracture 135 & 287 ft from Treatment Well
 MWX-3 (5")
M-SITE Field Laboratory For Fracture Diagnostic Research N 72°W MWX-2 (TREATMENT WELL) MWX-3 (5 -LEVEL WIRELINE ARRAYS) 2 INTERSECTION WELLS Two Monitor Wells Three Test Intervals 4300 -4900 ft Depths IW-1 B IW-1 C Two Intersection Wells 4550 ft 4350 ft Fully Characterized Site Piceance Basin 0 MONITOR WELL (CEMENTED IN ARRAYS) 30 Distance, m
 MWX-3 450 N 74 W 300")
M-SITE LENGTH VALIDATION 600 AT INTERSECTION North (ft) MWX-3 450 N 74 W 300 MWX 2 150 0 -450 MONITOR -300 -150 0 West-East (ft) INTERSECTION WELL 150 300

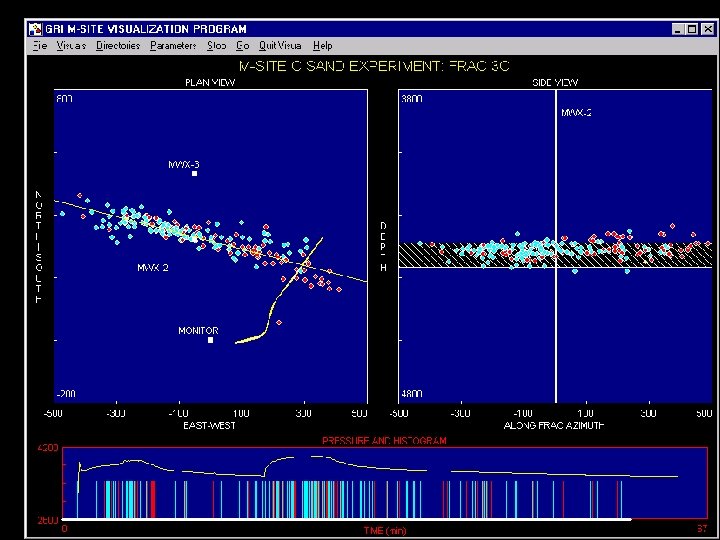
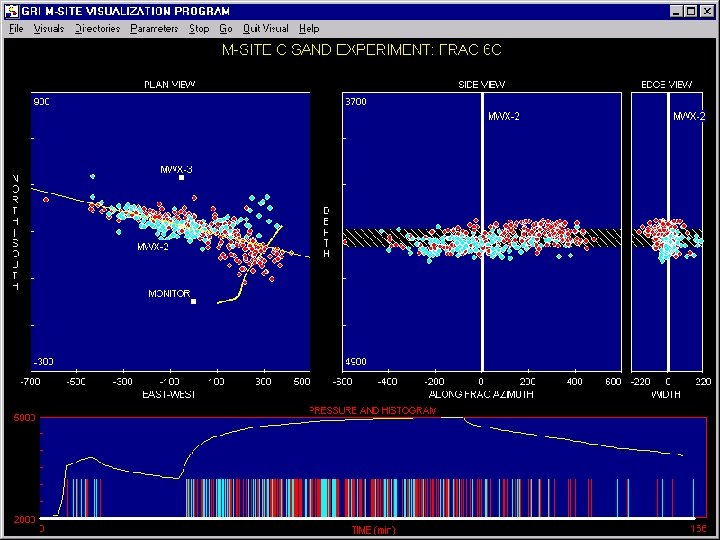
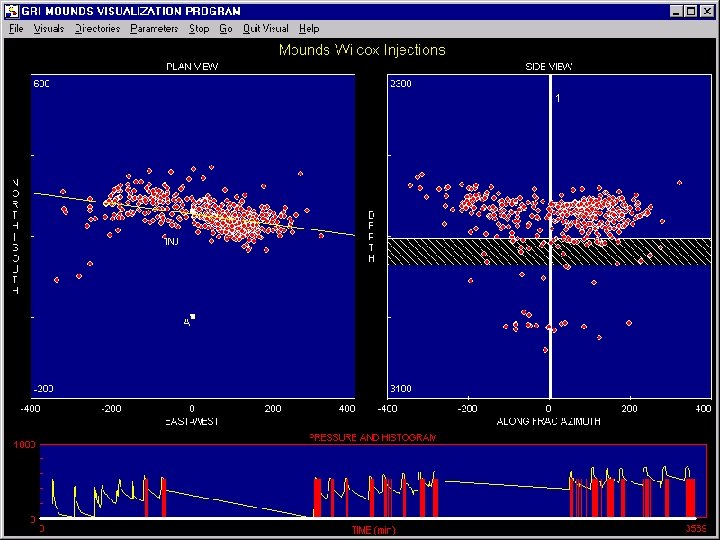
MICROSEISMIC SIMULATIONS Simulations Are Based On Microseismic Monitoring Results Actually Measured In Field Tests
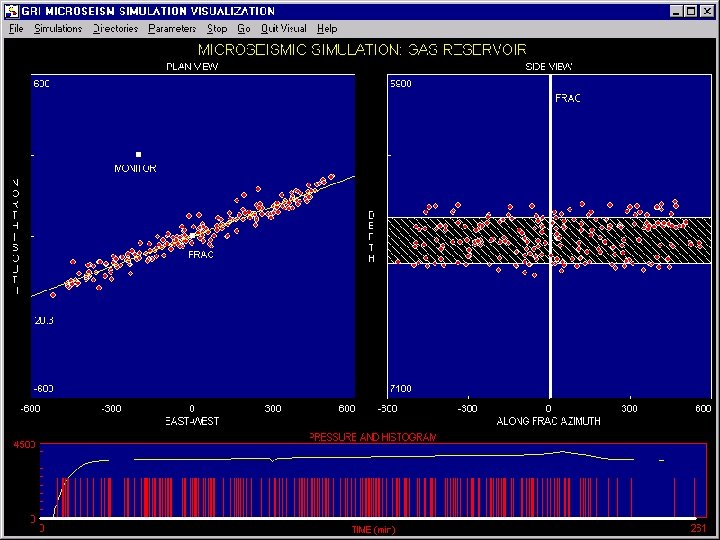
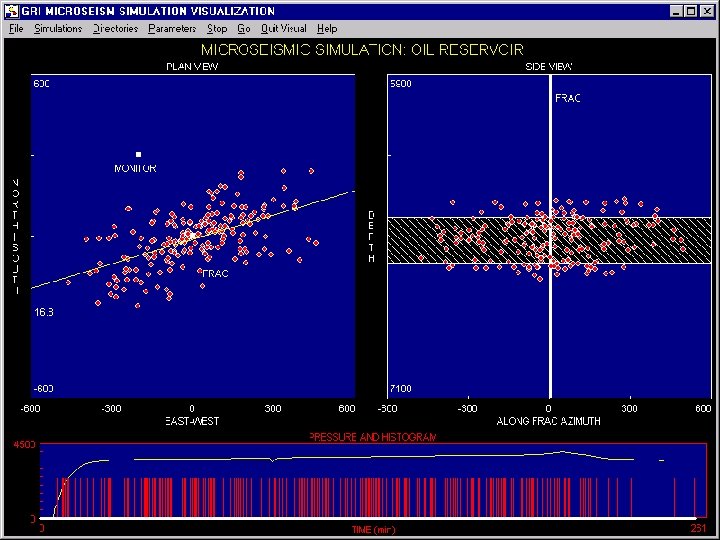
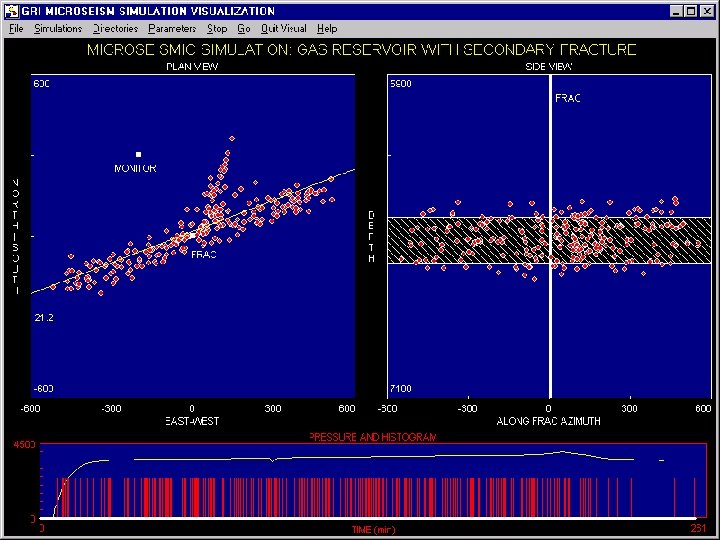

MICROSEISMIC IMAGING EXAMPLES

MICROSEISMIC TECHNOLOGY Conclusions • Process Monitoring, Optimization of Injection Procedures, and Regulatory Issues Make Subsurface Imaging an Important Capability • Technology Is Now at the Level to Apply Microseismic Diagnostics – – Advanced Receivers Fiber-optic Telemetry Computer Processing Understanding of Reservoir Structural Behavior
- Slides: 35