Monitoring and Diagnosing Oracle RAC Performance with Oracle











- Slides: 27

Monitoring and Diagnosing Oracle RAC Performance with Oracle Enterprise Manager Kai Yu, Orlando Gallegos Dell Oracle Solutions Engineering

About Author • Kai Yu Senior System Engineer, Dell Oracle Solutions Engineering Lab – 15 years Oracle DBA and Solutions Engineering – Specialized in Oracle RAC, Oracle EBS and OVM – Oracle Technology articles author and frequent presenter – IOUG Oracle RAC SIG President (2009 -2010) – IOUG Collaborate 10//11 Boot Camps Owner • Orlando Gallegos Dell Oracle Solutions Engineering Lab – 5 years Oracle DBA and Solutions Engineering – Specialized in system, networking and storage migrations 2 Global Marketing

Agenda • Performance Management: Challenges and Solutions • Database Performance Monitoring and Diagnosis Tools • RAC Database Monitoring and Diagnosis with Enterprise Manager • Examples of RAC Performance Monitoring & Diagnosis • QA Global Marketing

Performance Management: Challenges and Solutions • Performance Management Challenges – Complexity of Applications and the Workloads – Complexity of RAC Architecture Servers, OS, network, storage, Oracle RAC/Database – High Requirements and Expectations of Database Performance – Performance Management for 24 x 7 Operation § Catch the performance problem in real time § Diagnose the performance problem afterwards § Manage a large number of production databases • Performance Management : from ART to Engineering – Common Performance Problems Symptoms § Slow response time § Low database throughput bottlenecks Global Marketing

Performance Management: Challenges and Solutions – Performance Management Work Flow § Non-stop monitoring and statistics collecting § Identifying the bottlenecks and issue alerts § Diagnosing the root cause of the bottlenecks § Coming up the tuning recommendations § Combine proactive and reactive approaches – Performance Monitoring and Statistics Collecting § Real time monitoring § Historical performance playback § Automatic monitoring and performance alerts § Performance Statistics Gathering system, sessions, SQL execution, Wait events, DB time § Store the statistics for performance analysis and diagnosis Global Marketing

RAC Performance Management: Challenges and Methods – Diagnosis of Performance Issues § Analyze the collected statistics § Identify the root cause of performance issues § Recommend the correction method and quantify the benefits § Notification of diagnosis results through automatic alerts § Automatic performance diagnosis: Proactive approach § Manual performance diagnosis: Reactive approach • Performance Management Tools – Oracle Database Enterprise Edition § Generate cumulative performance data in dynamic views § Various Performance features – Oracle Diagnostics Pack § Built into the core database engine and Enterprise Manager § A complete database performance management solution § Cluster aware: specific features designed for RAC § Including AWR, ADDM and ASH Global Marketing

RAC Performance Management Tools – Oracle Database Tuning pack SQL Tuning advisor, SQL access Advisor – Automatic Workload Repository(AWR) § AWR collects database statistics thought AWR snapshots § AWR reports and AWR compare Period report § Foundation of all self tuning and management § RAC Aware: Instance and Database level – Active Session History § ASH samples the state of all active session every second § Help diagnose the short lived performance problem – Automatic Database Diagnostic Monitor (ADDM) § Examine and analyze statistics data captured by AWR § Diagnosis through ADDM findings Root cause analysis, Correction recommendations Impact and benefits analysis Global Marketing

RAC Performance Management Tools § Automatics ADDM run vs Manual ADDM run § ADDM for RAC: cluster-wide performance analysis issue on the entire cluster and instance level global resources such as global cache, interconnect traffic – Enterprise Manager § Primary tool for DBAs to manage the RAC databases § Provide a display console of database performance statistics § Provide a central console for RAC performance management § Graphical User interface for other tuning tools: Run AWR, ASH and ADDM, SQL tuning Display the results from AWR, ASH, ADDM, SQL tuning § Preferred method for RAC database monitoring and diagnosis § Enterprise Manager Grid Control vs Database Control § Rest of presentation examines how to manage performance using Enterprise Manager Global Marketing

Video Demo: RAC Performance Monitoring and Diagnosis with Enterprise Manager • Length of Video: 15 minutes • Contents: 11 g R 2 RAC Database Performance Monitoring and Diagnosis using Oracle Enterprise Manager Grid Control 11 g – Multiple Levels of RAC Performance Monitoring § Cluster Database, Database Instance, Cluster § Real time monitoring § Historical Performance Playback – Collecting Performance Statistics § AWR § ASH – Diagnosis of Performance Problem: § Proactive Diagnosis by ADDM § Manually Run ADDM for Reactive Diagnosis Global Marketing

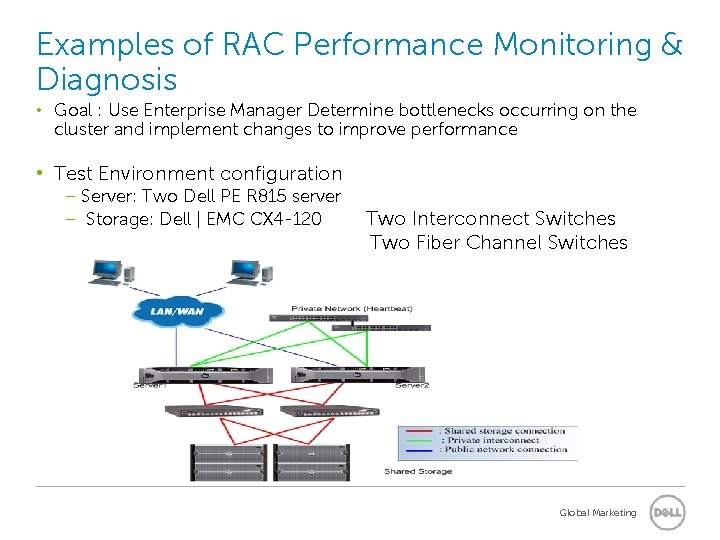
Examples of RAC Performance Monitoring & Diagnosis • Goal : Use Enterprise Manager Determine bottlenecks occurring on the cluster and implement changes to improve performance • Test Environment configuration – Server: Two Dell PE R 815 server – Storage: Dell | EMC CX 4 -120 Two Interconnect Switches Two Fiber Channel Switches Global Marketing

Examples of RAC Performance Monitoring & Diagnosis • Oracle RAC Database: Two Node 11 g R 2 RAC database • Enterprise Manager 11 g R 1 for performance monitoring • Example 1 – Workload: PL/SQL batch jobs concurrently run on both nodes. . Loop for 200000 times: select rows of customer table(most copy in other node) update rows to establish the master copy in local node. Insert into customer table using sequence value end loop workload. sh: executes update. sql on two instances at same time • Goal – Monitor real time performance and diagnose performance issue using historical data – Show to use ADDM and AWR to tune the RAC Database. Global Marketing

Examples of RAC Performance Monitoring & Diagnosis • First Run: Real Time Performance: Batch time: 64 minutes, average throughputs: 137 per sec ADDM findings: Global Marketing

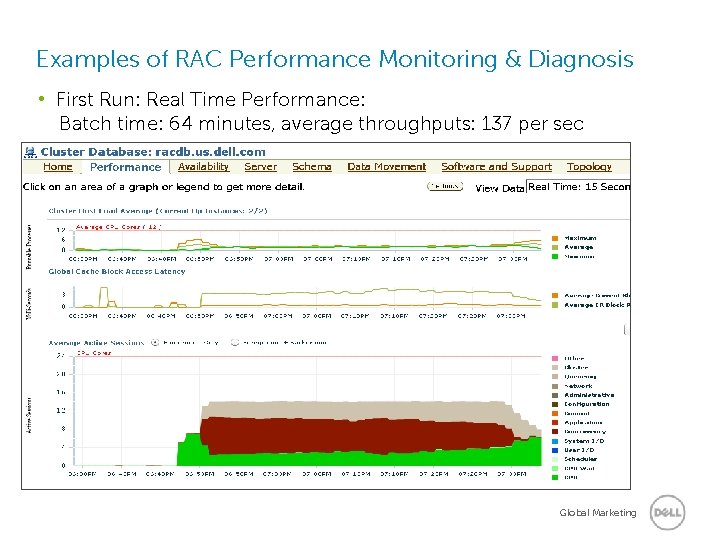
Examples of RAC Performance Monitoring & Diagnosis • First Run: Real Time Performance: Batch time: 64 minutes, average throughputs: 137 per sec Global Marketing

Examples of RAC Performance Monitoring & Diagnosis • First Run: Real Time Performance: Batch time: 64 minutes, average throughputs: 137 per sec ADDM findings: Global Marketing

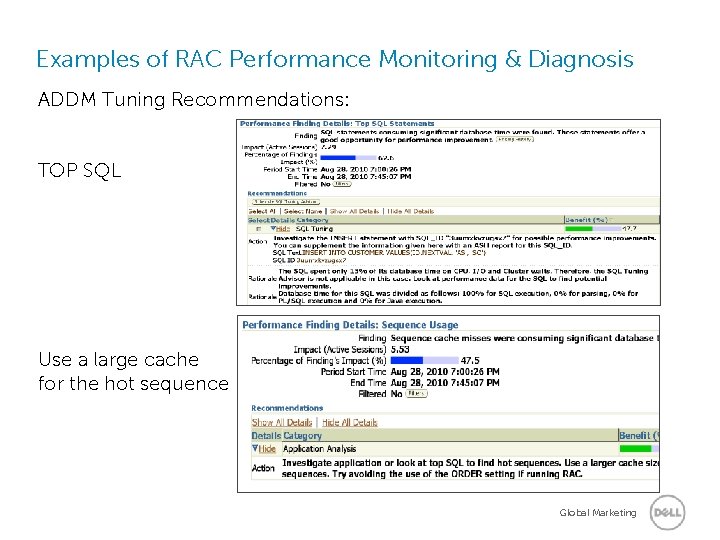
Examples of RAC Performance Monitoring & Diagnosis ADDM Tuning Recommendations: TOP SQL Use a large cache for the hot sequence Global Marketing

Examples of RAC Performance Monitoring & Diagnosis ADDM Recommendations Investigate “row cache lock” wait Use a higher value for Pctfree Of customer table create sequence id start with 1 increment by 1 nomaxvalue cache 9000; Rebuild table customer use higher PCTFREE value (20) Global Marketing

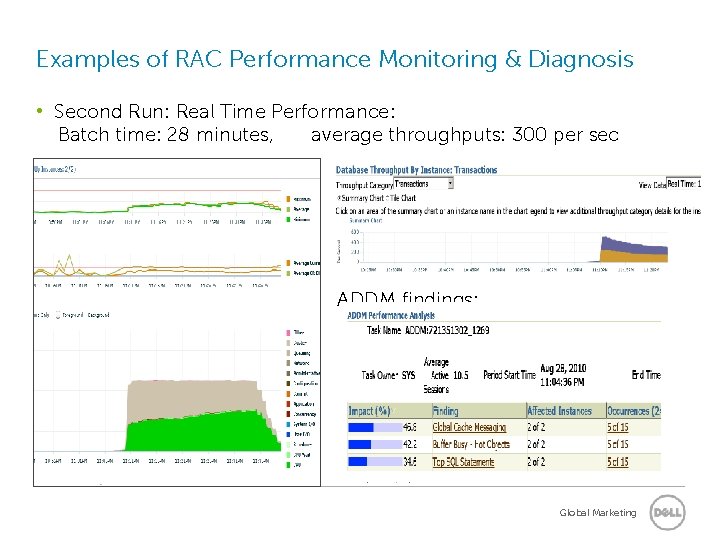
Examples of RAC Performance Monitoring & Diagnosis • Second Run: Real Time Performance: Batch time: 28 minutes, average throughputs: 300 per sec ADDM findings: Global Marketing

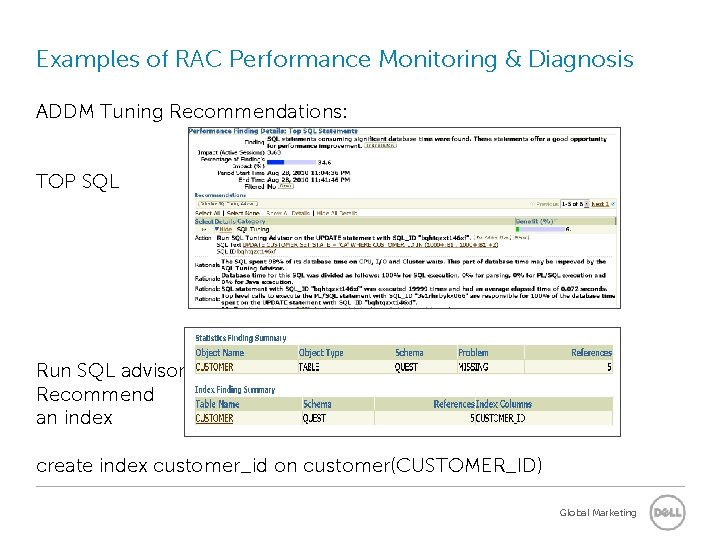
Examples of RAC Performance Monitoring & Diagnosis ADDM Tuning Recommendations: TOP SQL Run SQL advisor Recommend an index create index customer_id on customer(CUSTOMER_ID) Global Marketing

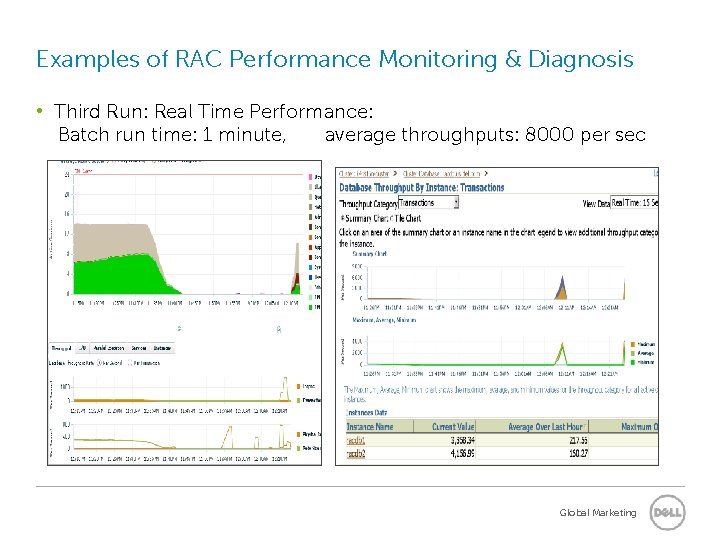
Examples of RAC Performance Monitoring & Diagnosis • Third Run: Real Time Performance: Batch run time: 1 minute, average throughputs: 8000 per sec Global Marketing

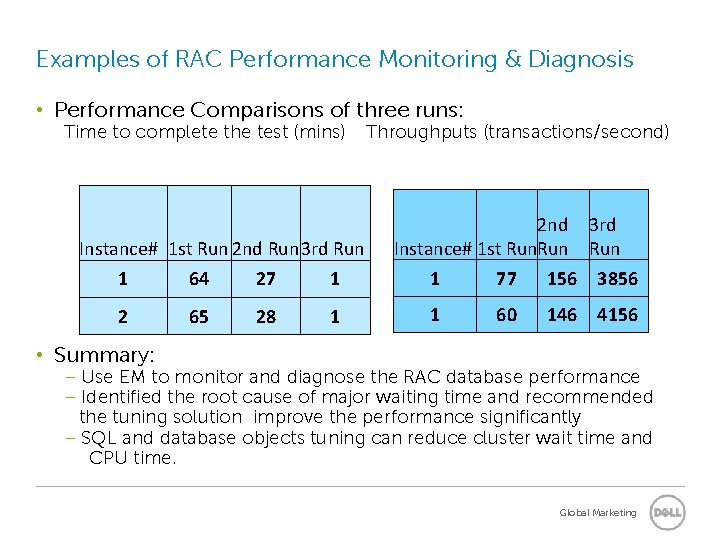
Examples of RAC Performance Monitoring & Diagnosis • Performance Comparisons of three runs: Time to complete the test (mins) Throughputs (transactions/second) Instance# 1 st Run 2 nd Run 3 rd Run 2 nd Instance# 1 st Run 3 rd Run 1 64 27 1 1 77 156 3856 2 65 28 1 1 60 146 4156 • Summary: – Use EM to monitor and diagnose the RAC database performance – Identified the root cause of major waiting time and recommended the tuning solution improve the performance significantly – SQL and database objects tuning can reduce cluster wait time and CPU time. Global Marketing

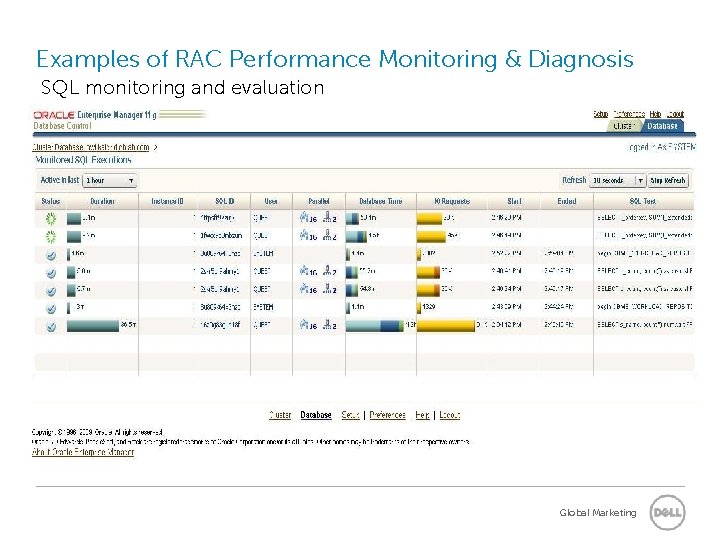
Examples of RAC Performance Monitoring & Diagnosis • Example 12 Data warehouse Work Load – TPCH test running two streams: › 1 st Test: Use EM to diagnose bottleneck › 2 nd Test: Final results First Run: Partitioned table Global Marketing

Examples of RAC Performance Monitoring & Diagnosis • Data warehouse performance analysis Global Marketing

Examples of RAC Performance Monitoring & Diagnosis SQL monitoring and evaluation Global Marketing

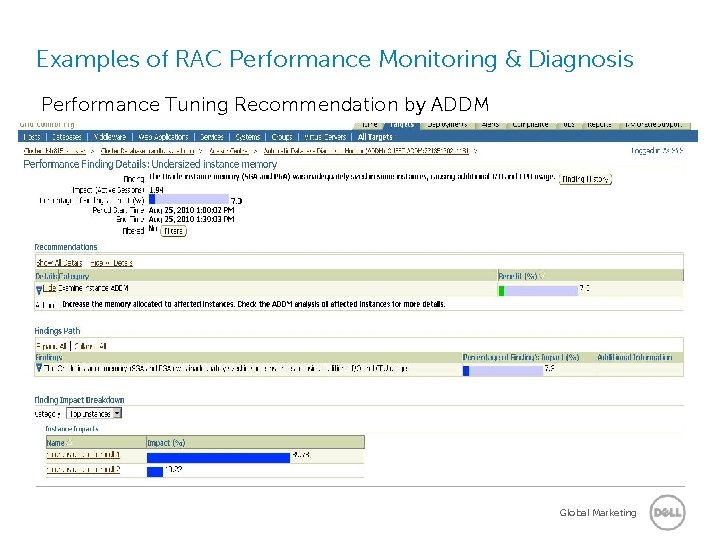
Examples of RAC Performance Monitoring & Diagnosis Performance Tuning Recommendation by ADDM Global Marketing

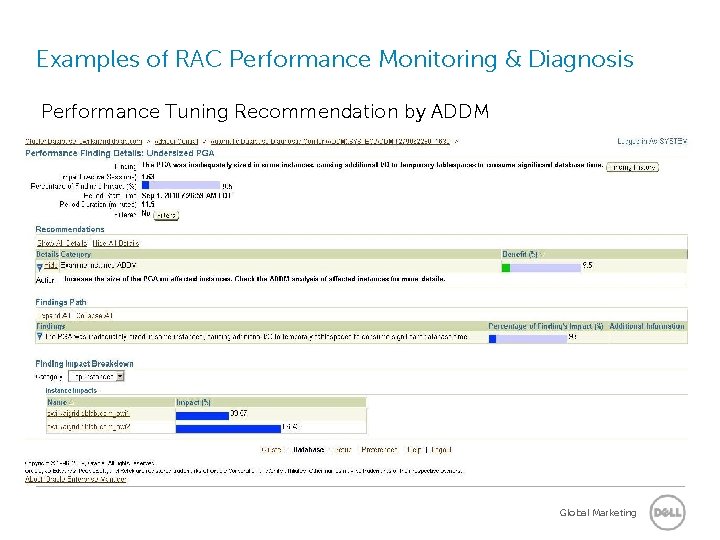
Examples of RAC Performance Monitoring & Diagnosis Performance Tuning Recommendation by ADDM Global Marketing

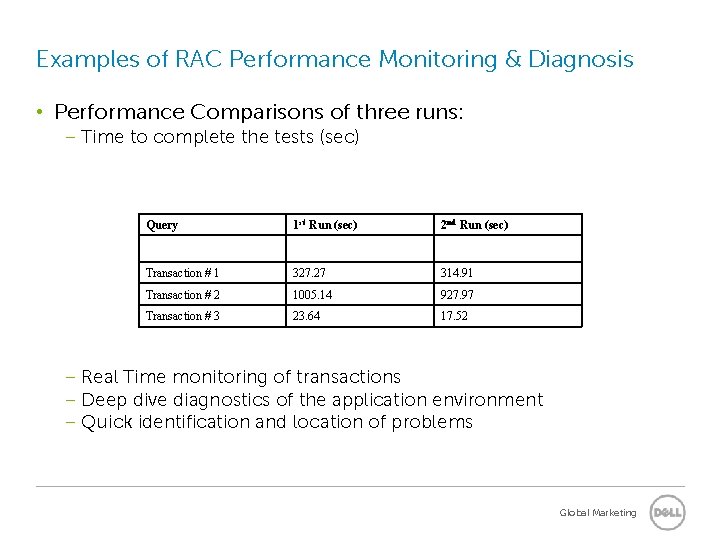
Examples of RAC Performance Monitoring & Diagnosis • Performance Comparisons of three runs: – Time to complete the tests (sec) Instance# Query 1 st Run (sec) 2 nd Run (sec) Transaction # 1 327. 27 314. 91 Transaction # 2 1005. 14 927. 97 Transaction # 3 23. 64 17. 52 – Real Time monitoring of transactions – Deep dive diagnostics of the application environment – Quick identification and location of problems Global Marketing

To learn more about how Dell can help you drive an Efficient Enterprise visit: • Dell’s onsite TSR for a free quote • Michael Dell’s keynote on Wednesday at 8 a. m. • One of Dell’s 20 conference sessions • www. dell. com/oracle 27 Confidential Global Marketing