Monitoring and Debugging DryadLINQ Applications with Daphne Vilas

Monitoring and Debugging Dryad(LINQ) Applications with Daphne Vilas Jagannath, Zuoning Yin, Mihai Budiu University of Illinois, Microsoft Research SVC International Workshop on High-Level Parallel Programming Models and Supportive Environments (HIPS) 2011
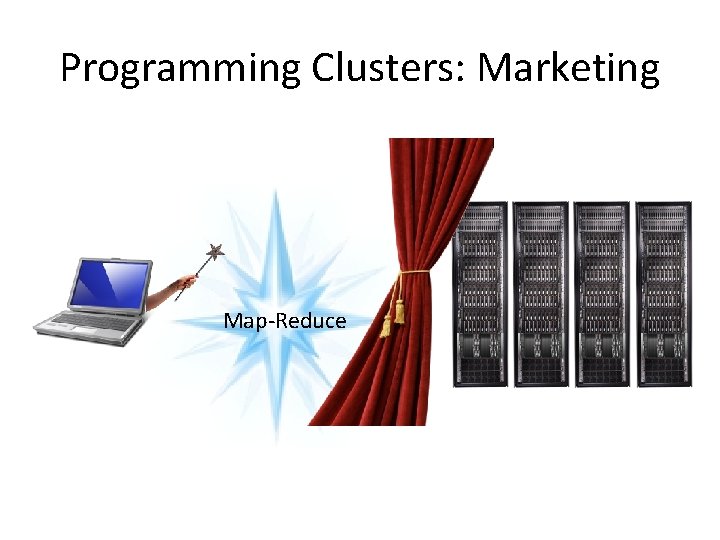
Programming Clusters: Marketing Map-Reduce
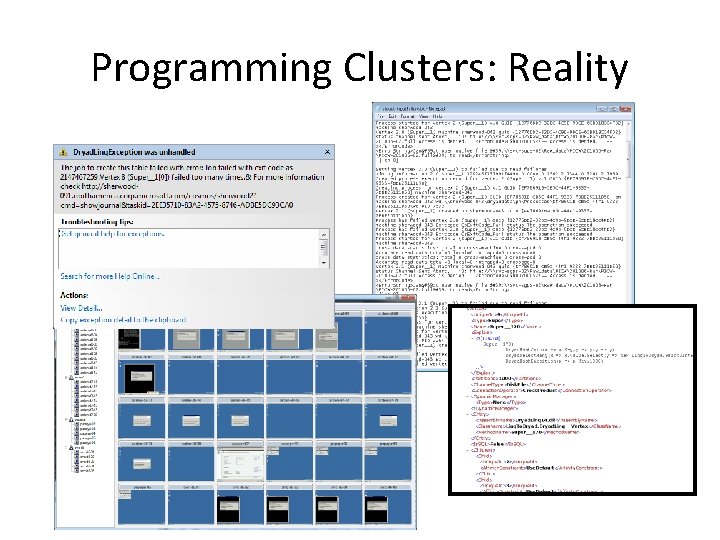
Programming Clusters: Reality
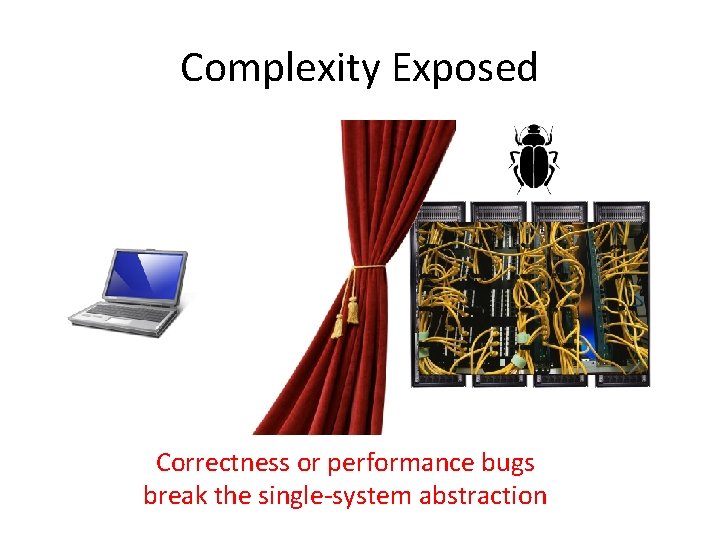
Complexity Exposed Correctness or performance bugs break the single-system abstraction
Outline • • • Motivation Job structure The Job Object Model Tools for job understanding Conclusions

Data-Parallel Computation Application Language Execution Storage Sawzall, Java Sawzall, Flume. Java ≈SQL Pig, Hive Map. Reduce Hadoop GFS Big. Table HDFS S 3 LINQ, SQL Dryad. LINQ Scope Dryad Cosmos Azure HPC 6
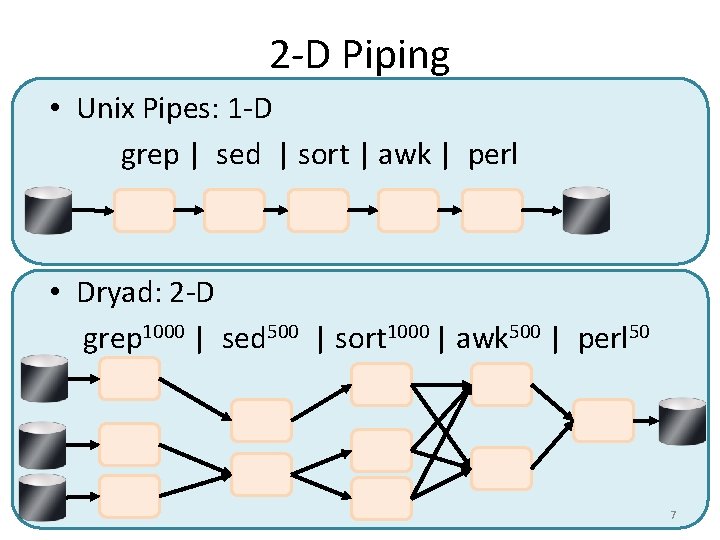
2 -D Piping • Unix Pipes: 1 -D grep | sed | sort | awk | perl • Dryad: 2 -D grep 1000 | sed 500 | sort 1000 | awk 500 | perl 50 7
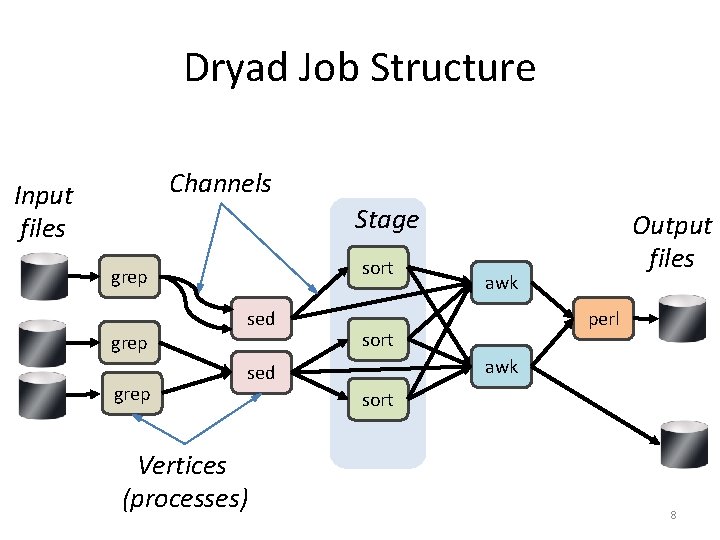
Dryad Job Structure Channels Input files Stage sort grep sed awk perl sort awk sed Vertices (processes) Output files sort 8
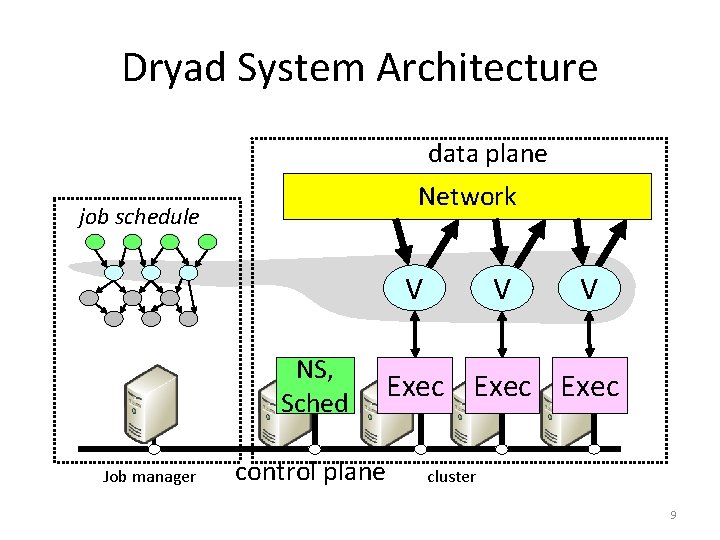
Dryad System Architecture data plane Network job schedule V NS, Sched Job manager V V Exec control plane cluster 9
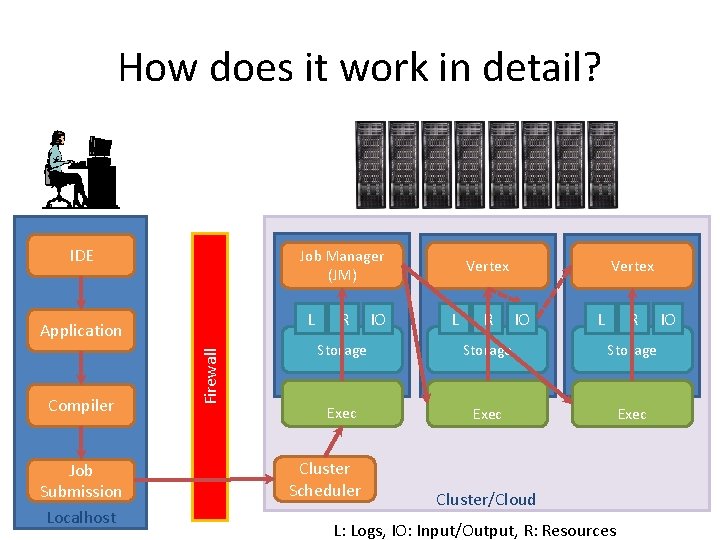
How does it work in detail? IDE Job Manager (JM) L Compiler Job Submission Localhost Firewall Application R IO Vertex L R Vertex IO L R Storage Exec Cluster Scheduler Cluster/Cloud L: Logs, IO: Input/Output, R: Resources IO
Logs – lots of them • Job-related – Plan (xml), status, resources • Job-manager – stdout. txt, stderr. txt, *. log • Vertex – stdout. txt, *. log, *. xml, *. cmd
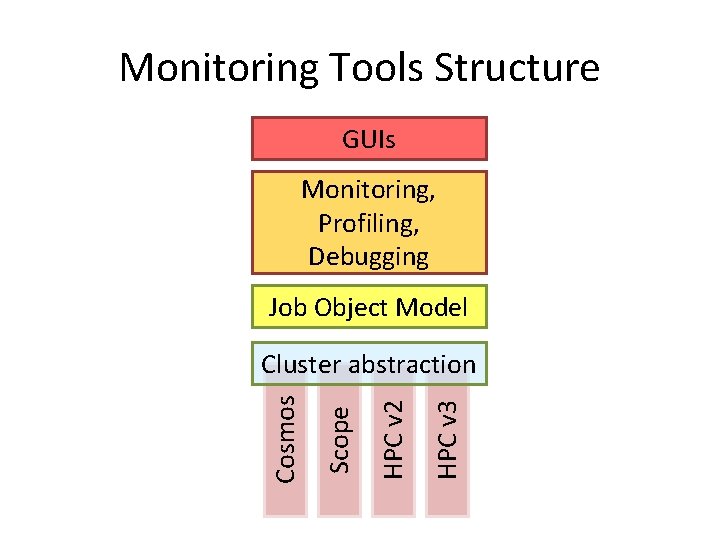
Monitoring Tools Structure GUIs Monitoring, Profiling, Debugging Job Object Model HPC v 3 HPC v 2 Scope Cosmos Cluster abstraction
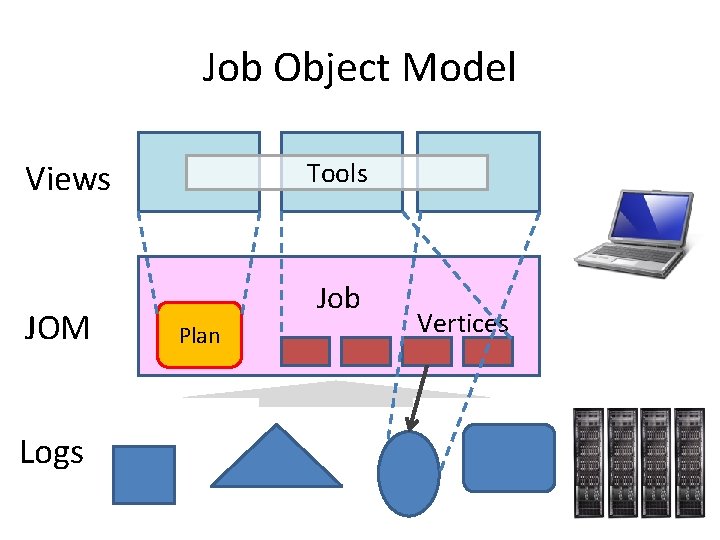
Job Object Model Tools Views JOM Logs Job Plan Vertices
Outline • • • Motivation Job structure The Job Object Model Tools for job understanding Conclusions
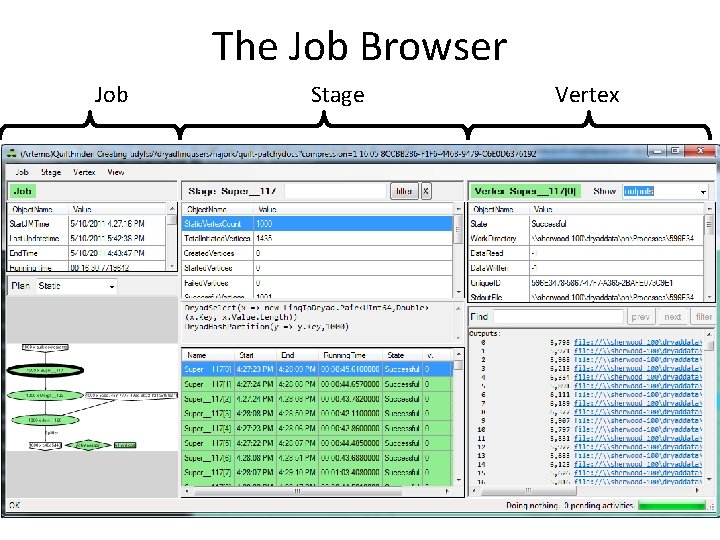
The Job Browser Job Stage Vertex
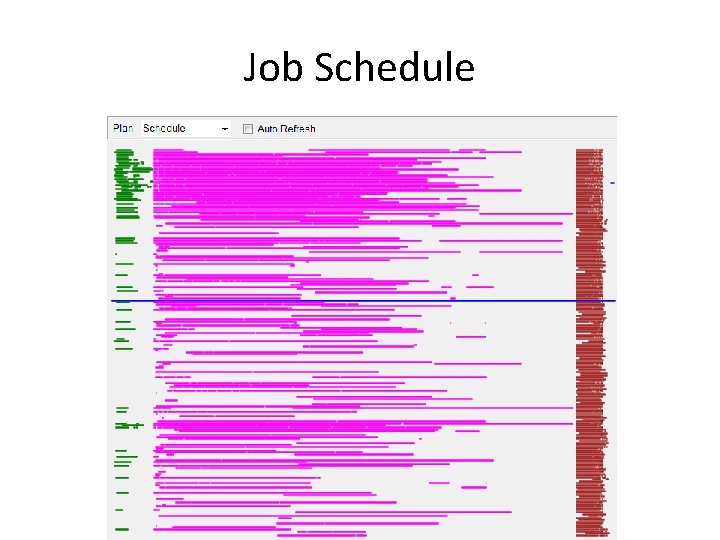
Job Schedule
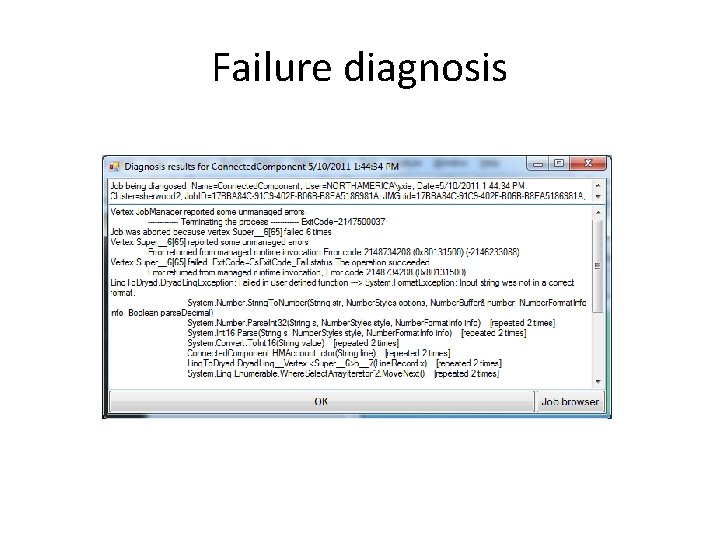
Failure diagnosis
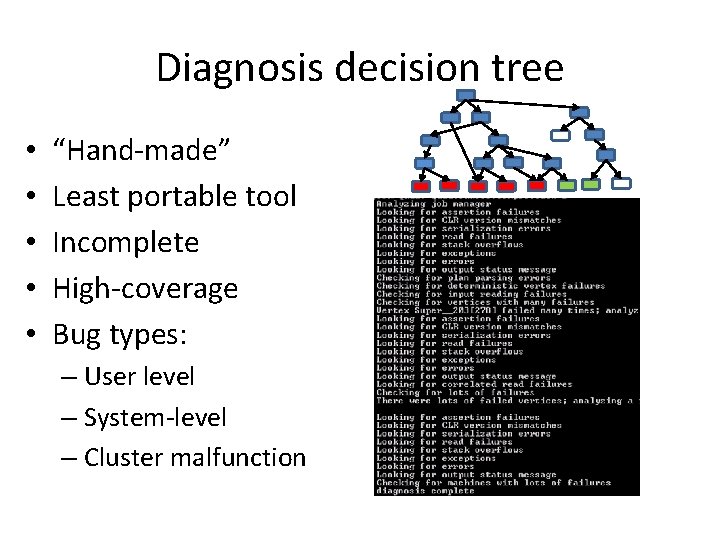
Diagnosis decision tree • • • “Hand-made” Least portable tool Incomplete High-coverage Bug types: – User level – System-level – Cluster malfunction
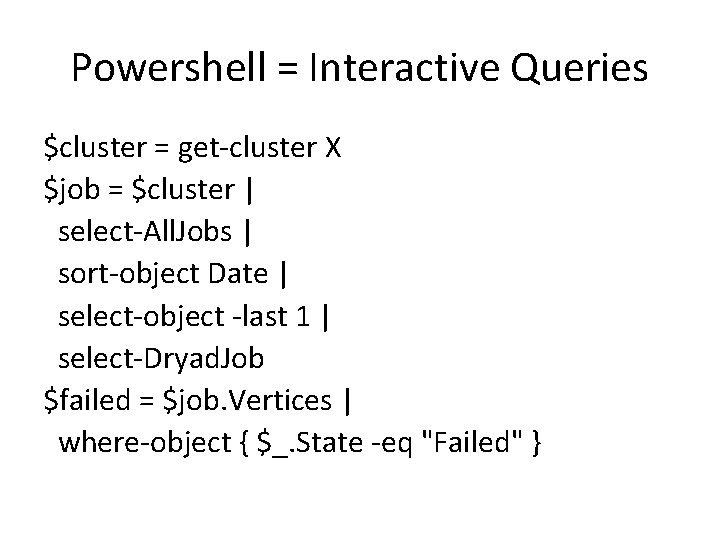
Powershell = Interactive Queries $cluster = get-cluster X $job = $cluster | select-All. Jobs | sort-object Date | select-object -last 1 | select-Dryad. Job $failed = $job. Vertices | where-object { $_. State -eq "Failed" }
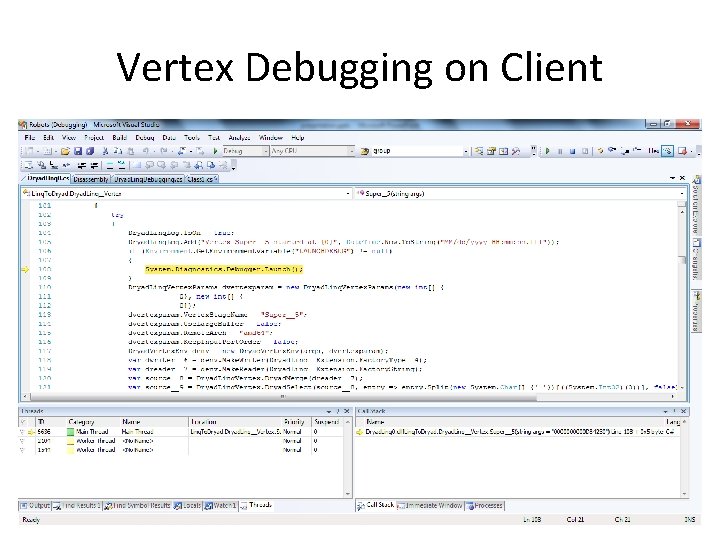
Vertex Debugging on Client
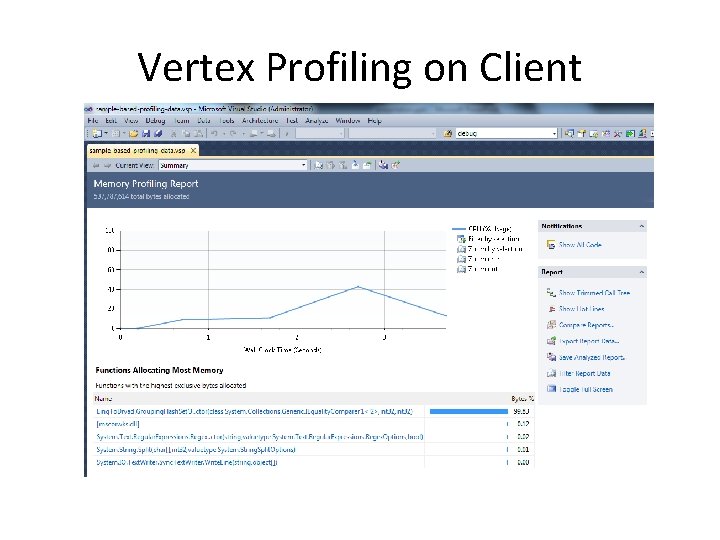
Vertex Profiling on Client
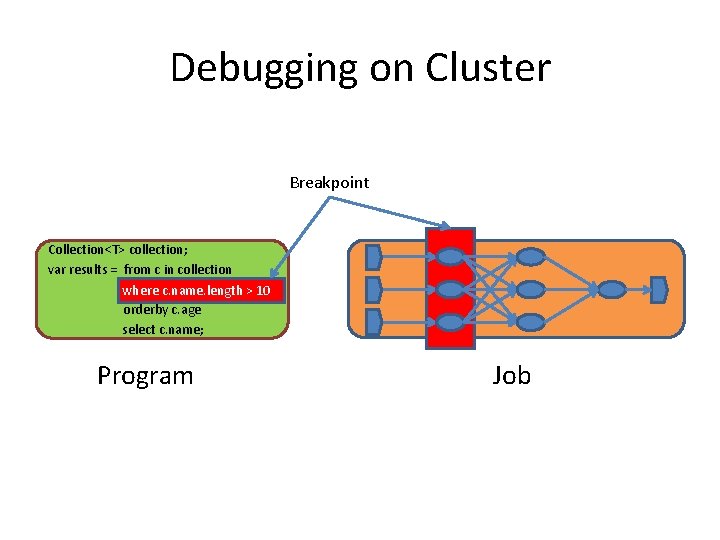
Debugging on Cluster Breakpoint Collection<T> collection; var results = from c in collection where c. name. length > 10 orderby c. age select c. name; Program Job
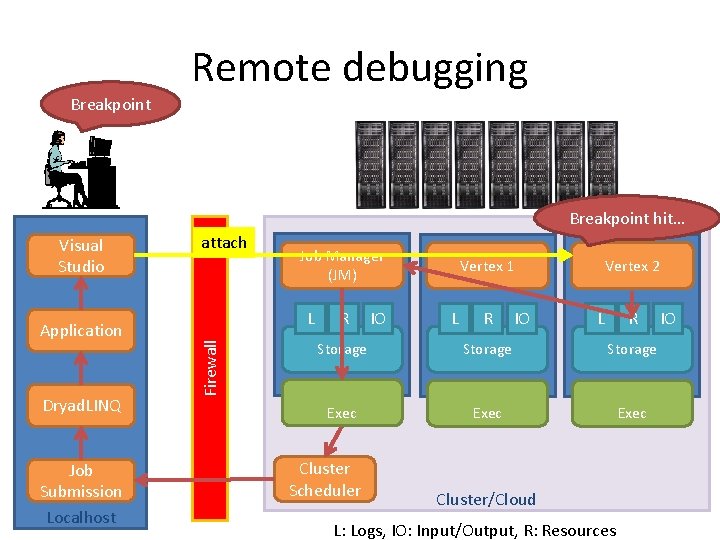
Breakpoint Remote debugging Breakpoint hit… Application Dryad. LINQ Job Submission Localhost attach Job Manager (JM) L Firewall Visual Studio R IO Vertex 1 L R IO Vertex 2 L R Storage Exec Cluster Scheduler Cluster/Cloud L: Logs, IO: Input/Output, R: Resources IO
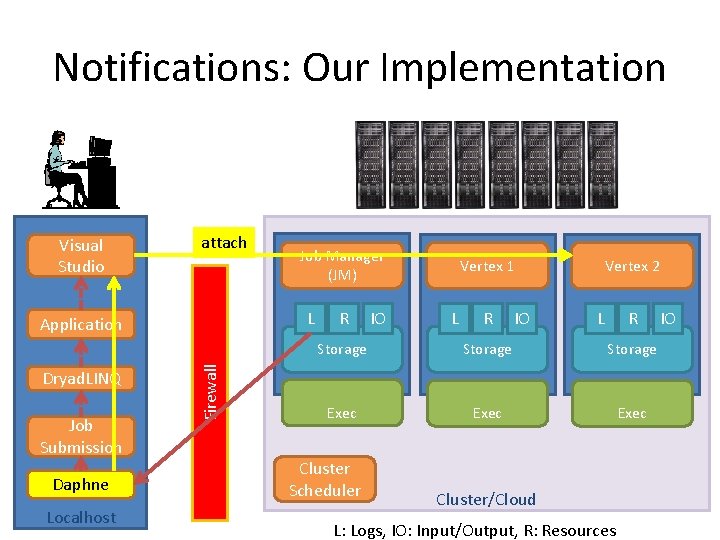
Notifications: Our Implementation Visual Studio attach L Job Submission Daphne Localhost Firewall Application Dryad. LINQ Job Manager (JM) R IO Vertex 1 L R IO Vertex 2 L R Storage Exec Cluster Scheduler Cluster/Cloud L: Logs, IO: Input/Output, R: Resources IO
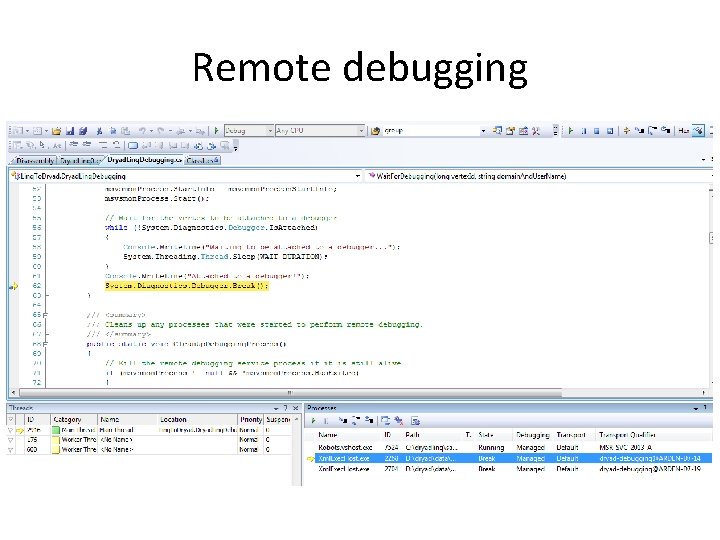
Remote debugging
Open Problems • What happens when 100, 000 processes hit a breakpoint? • How to evaluate expressions in the debugger when state is distributed? • How to do large-scale performance debugging? • How to preserve map between distributed state and original program state? • How much can the illusion of a single system be preserved?
Conclusions • Single-machine abstractions break down in the presence of (performance/correctness) bugs • Job Object Model insulates tools from messy details • Design the cluster runtime to make it easy to build a JOM • Rich interactive tools easily built on top of JOM • Much more work needed for debugging at scale
- Slides: 27