Monitoraggio Geodetico e Telerilevamento Introduction to course Prof


 emits electromagnetic")

")


")


- Slides: 25
Monitoraggio Geodetico e Telerilevamento Introduction to course Prof. Carla Braitenberg University of Trieste . .
Carla braitenberg@units. it 3398290713 Studenti 2017 2018 Brandolin Francesco franzbrando 95@gmail. com LT Stefan Ferdinando ferdinando. stefan@gmail. com LT Federica Armellin Federica. Armellin@hotmail. it STAT Francesca Razza fra. razza@gmail. com STAT Francesco Bernardi berna 1988@gmail. com LM GA Alex Paganin Paga 1993@gmail. com LM GA Roncoroni Giacomo g. roncoroni@hotmail. com LM gianmarco signanini gianmarco. signanini@alice. it LM daniele malagugini danielemalagugini@gmail. com LM 7 march 2018
Orario e nota • Mercoledi’ mattina 11 -13 • Giovedi’ pomeriggio 14 -16 • Nota: Il filo conduttore del Corso e’ il documento Introduction to remote Sensing disponibile in pdf. Le schede Powerpoint sono di supporto al testo, dove esso risulta carente di dettagli. Sia pdf che schede Powerpoint fanno parte del materiale didattico del corso e coprono il contenuto del corso. Il testo e’ prevalentemente in lingua Inglese.
Long term monitoring is useful • Parameter changes and geometry changes in time must be monitored. • Allow to plan actions for adapting to environmental changes • Monitoring techniques: • Space-borne: from satellite. • Advantage: global coverage • Disadvantage: smaller precision and spatial resolution.
Terrestrial observations Terrestrial: highest precision achievable. Time consuming. Local measurement. May be not representative. Bias due to close positioning of measurements to civil cites. • Improvement: networks. • Redundancy of data is advisable againstrumental failure and anomaly identification. • •
Course • Introduction to remote sensing. Take advantage of recent publication of complete Landsat images over near to 50 years. • Accessible through new Earth Engine of Google. • Hands on experiences using public domain images.
Introduction to Remote Sensing • Material: the introduction is based on a course recommended by NASA as official introduction to Remote Sensing. • Source: Canada Centre for remote Sensing • Permission for Use • “This educational material within these tutorials is provided as is and may be copied in any form and used for non-commercial purposes provided that the content of the original material is not altered and it is clearly indicated that the Canada Centre for Mapping and Earth Observation (or Canada Centre for remote Sensing), Natural Resources Canada is the originator of this material. ” • Link: Fundamentals of Remote Sensing - Tutorial • http: //www. nrcan. gc. ca/earth-sciences/geographyboundary/remote-sensing/fundamentals/1430
Introduction to Remote Sensing • • • Recommended Textbook: Remote Sensing and Image Interpretation Lillesand, Kiefer, Chipman, 2015, Wiley, 7° edition. Published as ebook and softcover. Cambio: 41, 66 £ = 47, 95 EUR Please be advised that the e-book version of this tile is priced at £ 41. 66. Please see the following link to look at this title on our website: http: //eu. wiley. com/Wiley. CDA/Wiley. Title/product. Cd-EHEP 003336. html Should you require any further assistance please do not hesitate to contact me. Kind regards, Caitlin Alder Wiley New Era Estate, Oldlands Way Bognor Regis, PO 22 9 NQ U. K. www. wiley. com T: 01243 843291 F: 01243 843303 calder@wiley. com
Notes in parallel to text of remote sensing tutorial • Integration to Page 8 of the Tutorial.
Practical to check understanding of Frequency, wavelength • Give the equations that relate frequency, wavelength and velocity of wave • Give the mathematical espression for sinusoidal wave
Radiation of black body • All matter with T> absolute zero (-273°C) emits electromagnetic radiation. • Stefan-Boltzmann law M= total radiant exitance from surface, watts (W/m 2) s= Stefan –Boltzmann constant, 5. 6697 10 -8 W/m 2/K 4 T= absolute temperature (K) of emitting material Total energy emitted increases rapidly with T. Blackbody: ideal radiator, that totally absorbs incoming radiation and emits radiation according to its temperature. 14 march 2018
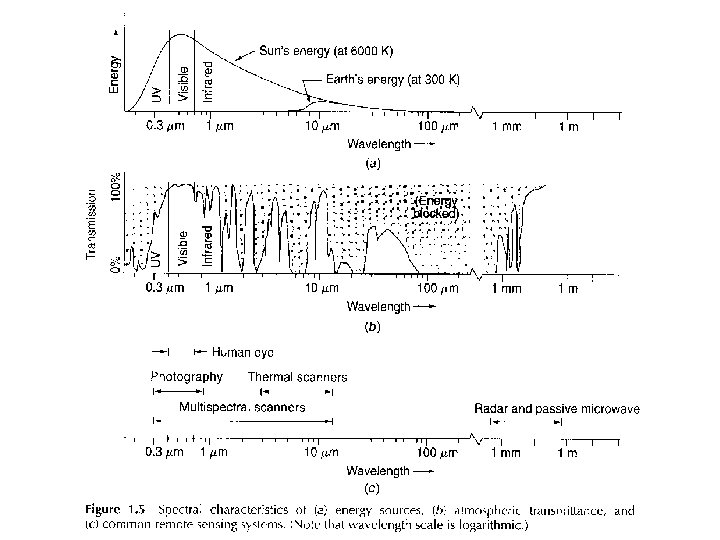
Dominant emitted wavelength • Spectral distribution of emitted radiation depends on Temperature • Curves in next slide show radiant power from blackbody for 1 mm interval. Unit of curve: W/m 2/mm • Area under the curve equals total radiant exitance M. • Dominant wavelength (Wien law):
From (Lillesand et al. , 2015)
• Integration to Page 12 of the Tutorial.
Earth’s atmosphere layers Layering governed by temperature profile • Exosphere: 700 to 10, 000 km; composed of extremely low densities of hydrogen (idrogeno, H), helium (elio, He) and several heavier molecules including nitrogen (azoto, N), oxygen (ossigeno, O) and carbon dioxide. (biossido di carbonio, CO 2) No meteorological events possible. • Thermosphere: 80 to 700 km; the lower part of thermosphere, from 80 to 550 kilometers height contains the Ionosphere (layer of electrically charged particles, ionized by short wavelength solar radiation). Temperature increases with height. International Space Station orbits at 320 to 380 km height. .
Earth’s atmosphere layers • Mesosphere: 50 to 80 km; Temperatures drop with increasing altitude. Coldest place on Earth (average -85°C). Layer in which meteors burn when entering. • Stratosphere: 12 to 50 km; contains ozone layer. Temperature rises with increasing height, caused by absorption of UV radiation in Ozone layer. Temperature profile creates stable conditions, that prevents air turbulence. Highest layer that can be accessed by jet-powered aircraft.
Thermal structure of atmosphere http: //www. centennialofflight. net/essay/Theories_of_Flight/atmosphere/TH 1 G 1. htm
Ozone layer • Ozone: O 3. Pale blue gas. Formed from dioxygen (O 2) by absorption of ultraviolet light and atmospheric electric discharges. • Present in Earth’s atmosphere. Ozone is powerful oxidant. • Causes damage to mucous and respiratory tissues of animals. • Ozone layer: region of stratosphere that absorbs UV radiation from sun
Earth’s atmosphere layers • Troposphere: 0 to 12 km; temperature declines with height. Heating from energy transfer from earth surface. Vertical mixing of air. Contains 80% of mass of atmosphere. Only layer that can be accessed with propeller driven aircraft.
Atmosphere seen in space Shuttle Endeavour orbiting in thermosphere. Because of the angle of the photo, it appears to straddle the stratosphere and mesosphere that actually lie more than 250 km below. The orange layer is the troposphere, the whitish the stratosphere and the blue is mesosphere “In a very unique setting over Earth's colorful horizon, the silhouette of the space shuttle Endeavour is featured in this photo by an Expedition 22 crew member on board the International Space Station, as the shuttle approached for its docking on Feb. 9 during the STS-130 mission”. Image Credit: NASA http: //www. nasa. gov/multimedia/imagegallery/image_feature_1592. html
Atmosphere composition • Atmosphere: layer of gases retained to earth by gravity. Acts as solar UV absorption and warming the surface with heat retention, which equivals to greenhouse effect. Reduces temperature extremes of diurnal temperature variation.
Volume percent of atmosphere composition • • • dry air contains: 78. 09% nitrogen (N) 20. 95% oxygen (O) 0. 93% argon (Ar) 0. 039% carbon dioxide (CO 2) Small amounts of other gases. Air also contains a variable amount of water vapor, on average around 1% at sea level, and 0. 4% over the entire atmosphere.
• Integration to Page 14 of the Tutorial.
Greenhouse gases absorption spectra Atmospheric absorption and scattering at different wavelengths of electromagnetic waves. The largest absorption band of carbon dioxide is in the infrared. Wikipedia_en Greenhouse gases