
Monetary Policy and a Stock Market BoomBust Cycle
Monetary Policy and a Stock Market Boom-Bust Cycle Lawrence Christiano, Roberto Motto and Massimo Rostagno
• Inflation has been relatively stable for a while • Attention has shifted to other issues: stock market volatility
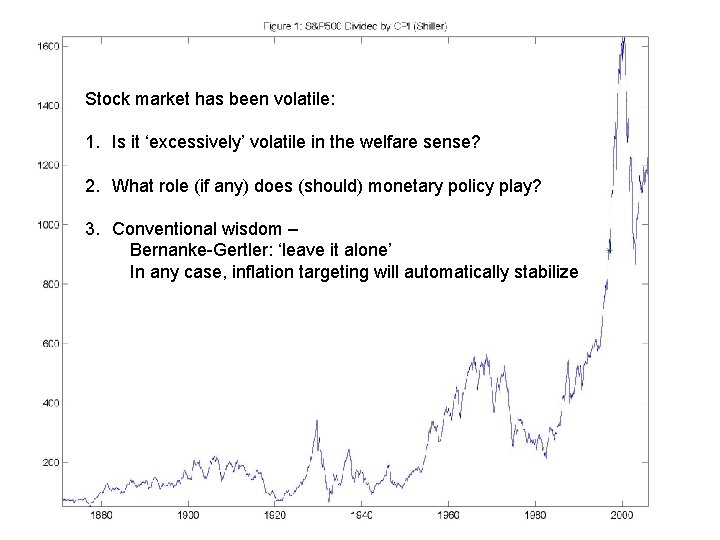
Stock market has been volatile: 1. Is it ‘excessively’ volatile in the welfare sense? 2. What role (if any) does (should) monetary policy play? 3. Conventional wisdom – Bernanke-Gertler: ‘leave it alone’ In any case, inflation targeting will automatically stabilize
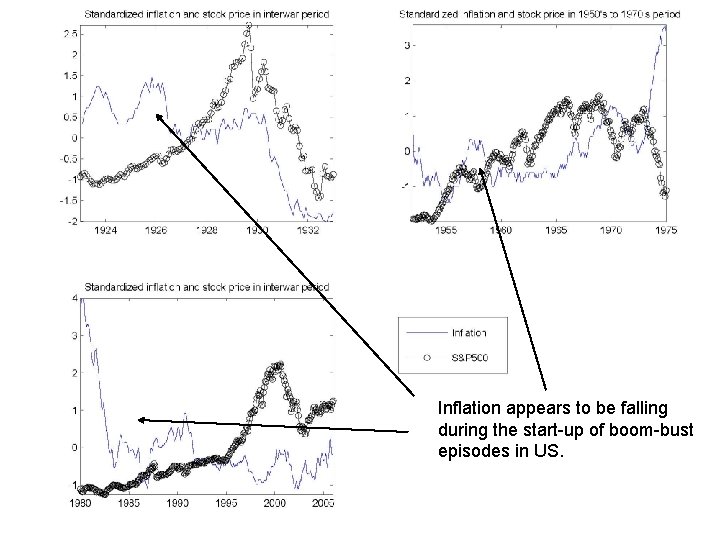
Inflation appears to be falling during the start-up of boom-bust episodes in US.
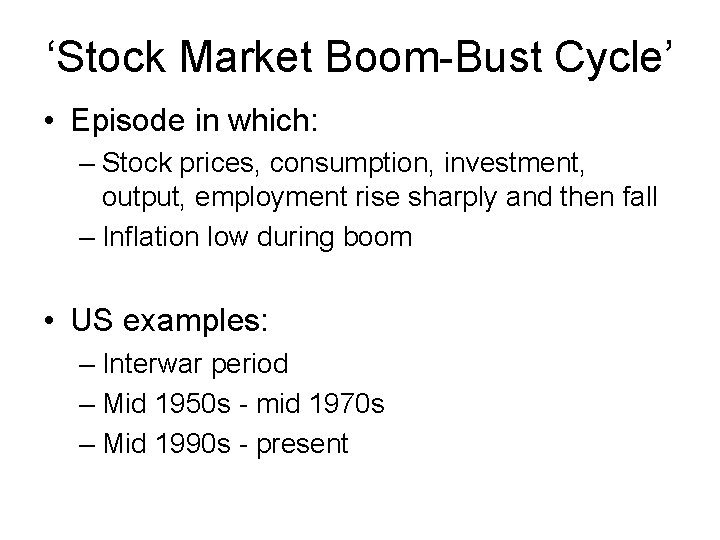
‘Stock Market Boom-Bust Cycle’ • Episode in which: – Stock prices, consumption, investment, output, employment rise sharply and then fall – Inflation low during boom • US examples: – Interwar period – Mid 1950 s - mid 1970 s – Mid 1990 s - present

Rational Theory of Boom-Bust • Follow Beaudry-Portier (see also more recently Jaimovich-Rebelo) – Boom-bust cycle triggered by: • Expectation that technology will be strong in future • Expectation ultimately not realized • Examples: – Fiber-optic cable – Motorola satellites
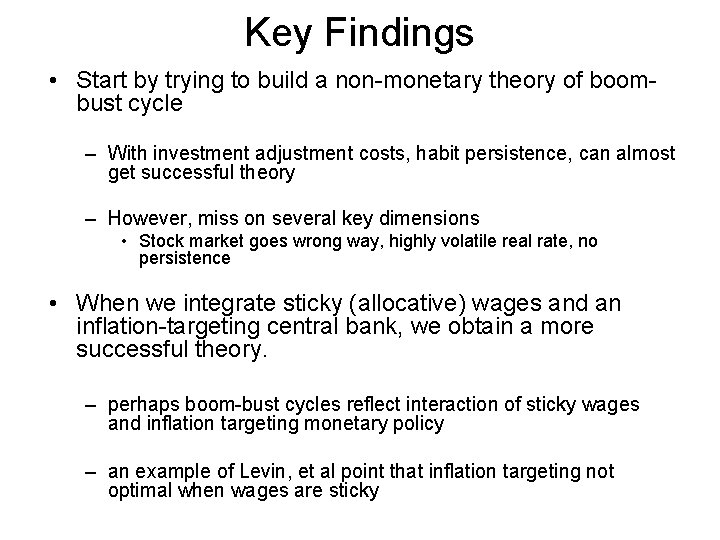
Key Findings • Start by trying to build a non-monetary theory of boombust cycle – With investment adjustment costs, habit persistence, can almost get successful theory – However, miss on several key dimensions • Stock market goes wrong way, highly volatile real rate, no persistence • When we integrate sticky (allocative) wages and an inflation-targeting central bank, we obtain a more successful theory. – perhaps boom-bust cycles reflect interaction of sticky wages and inflation targeting monetary policy – an example of Levin, et al point that inflation targeting not optimal when wages are sticky
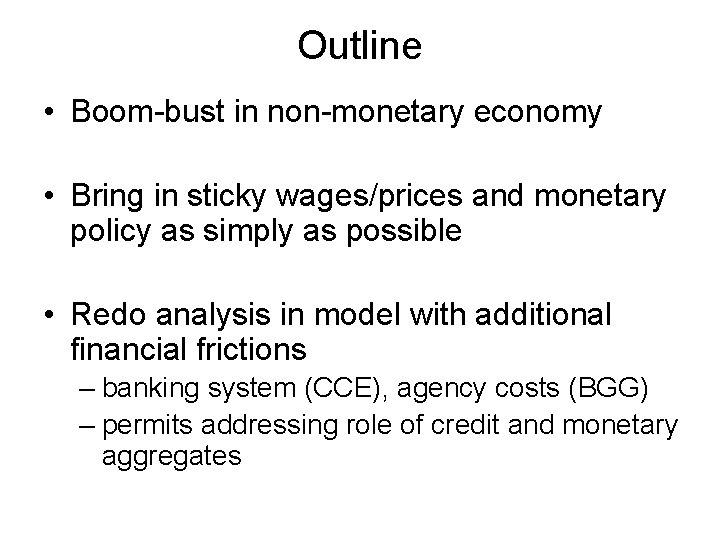
Outline • Boom-bust in non-monetary economy • Bring in sticky wages/prices and monetary policy as simply as possible • Redo analysis in model with additional financial frictions – banking system (CCE), agency costs (BGG) – permits addressing role of credit and monetary aggregates
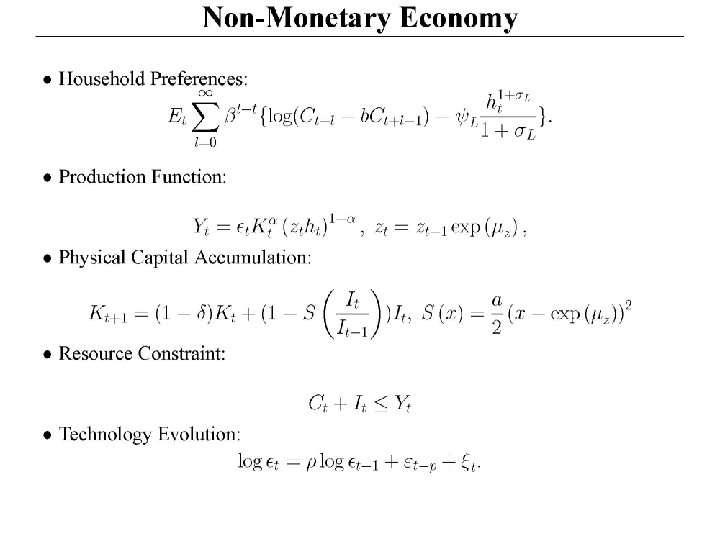
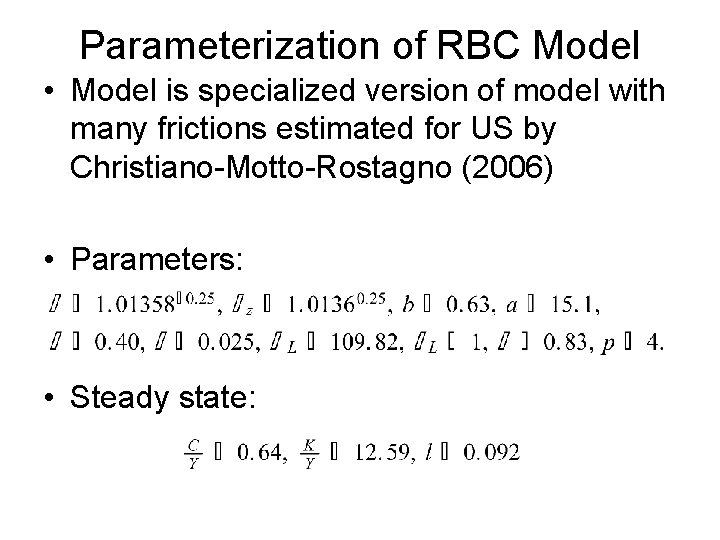
Parameterization of RBC Model • Model is specialized version of model with many frictions estimated for US by Christiano-Motto-Rostagno (2006) • Parameters: • Steady state:
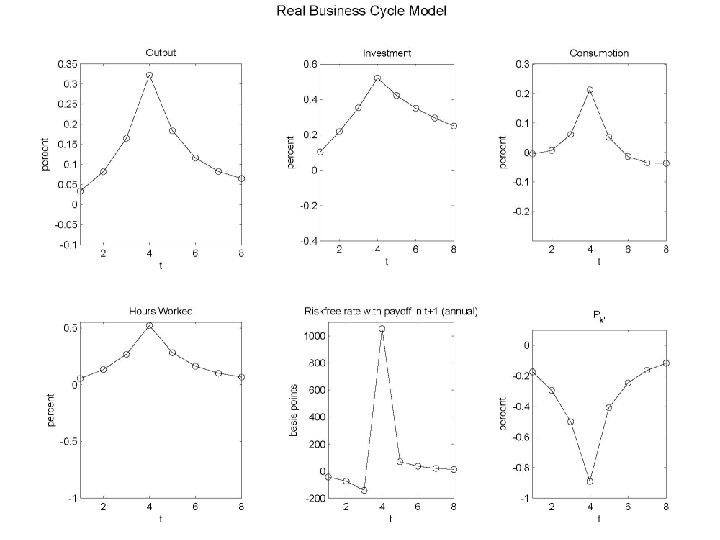
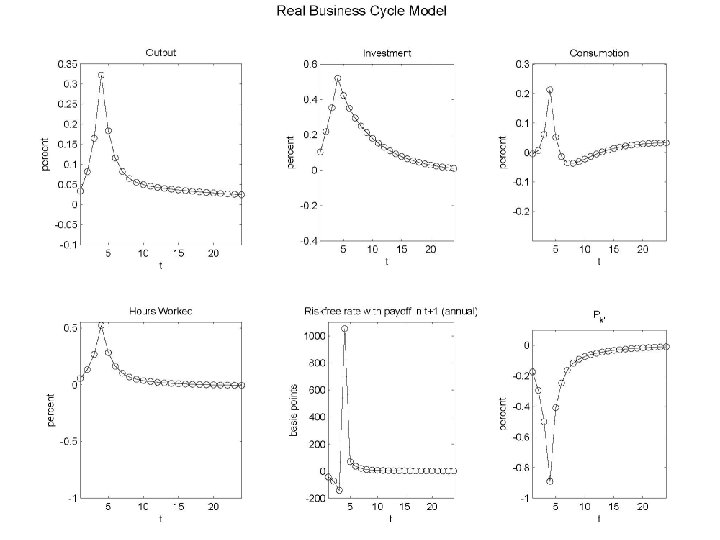
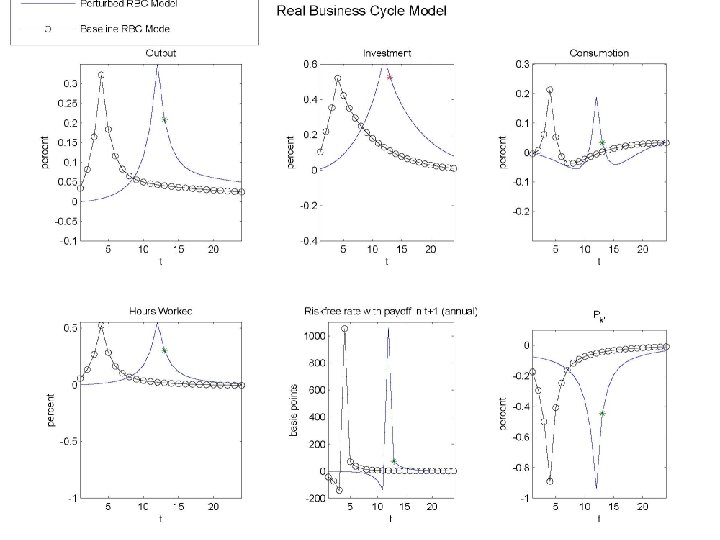
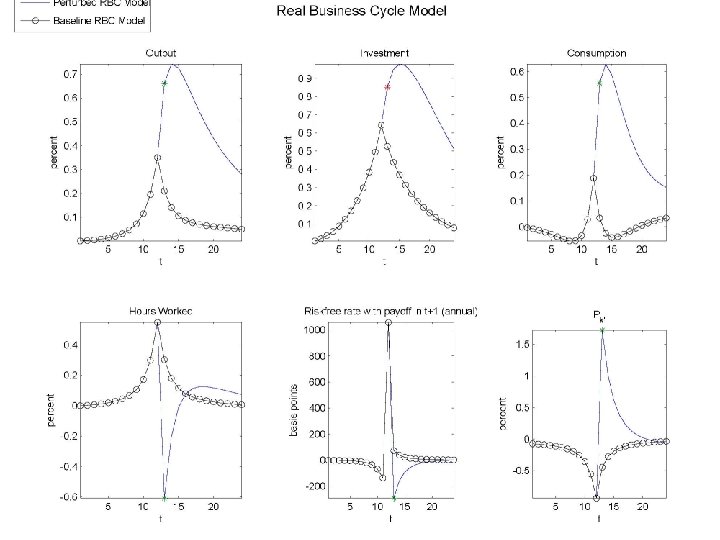
Results for RBC Model • Habit persistence in preference and adjustment costs on change in investment crucial for getting ‘close’ to stock-market boom-bust… • However, – Stock market wrong – Real interest rate highly volatile – No persistence
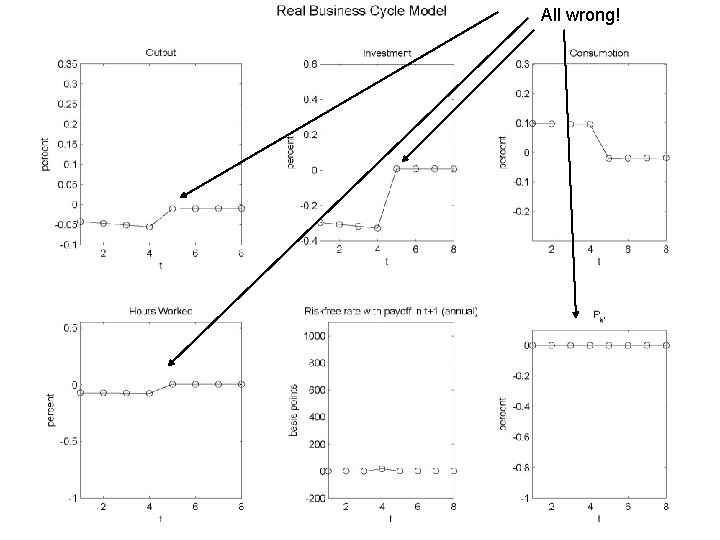
All wrong!
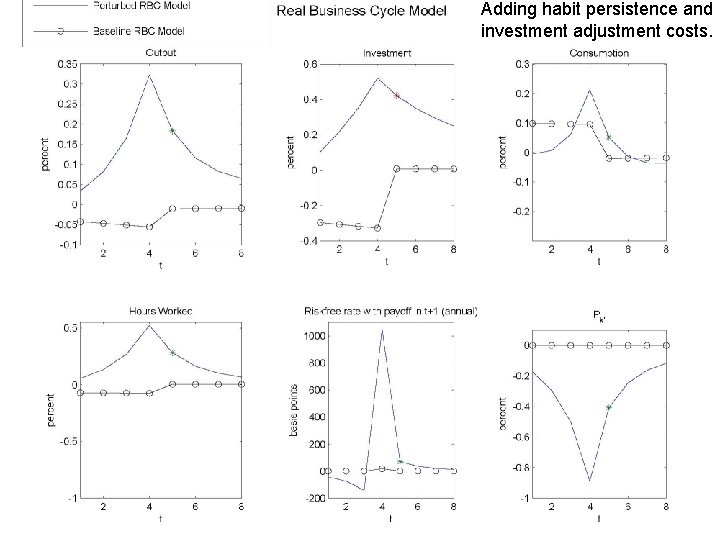
Adding habit persistence and investment adjustment costs.
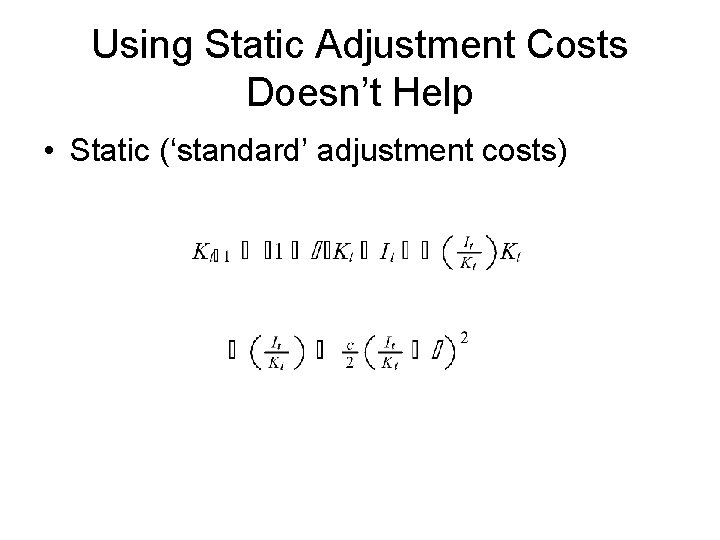
Using Static Adjustment Costs Doesn’t Help • Static (‘standard’ adjustment costs)
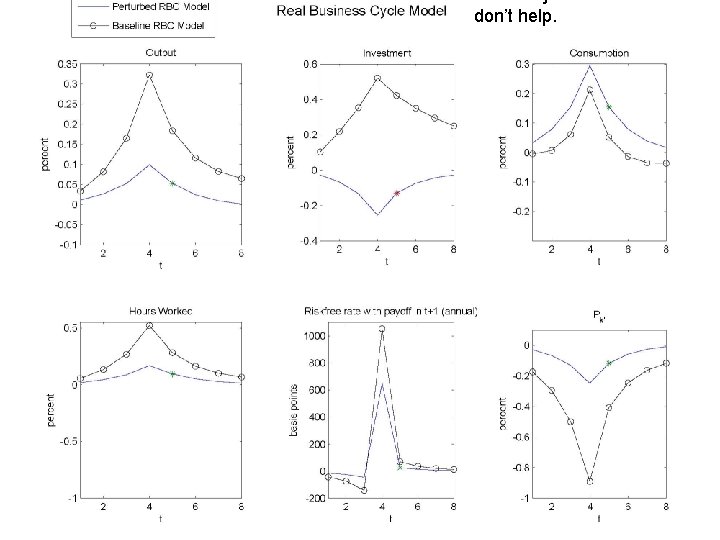
don’t help.
Conclusions so far: • Need: – habit persistence – need adjustment costs in changing the flow of investment (for economic interpretation of this formulation, see Matsuyama and Lucca). • Still, not good enough…. . not great on persistence • Increase lead time in signal (p) from 4 to 12
What do Agents Expect After Seeing a Signal?
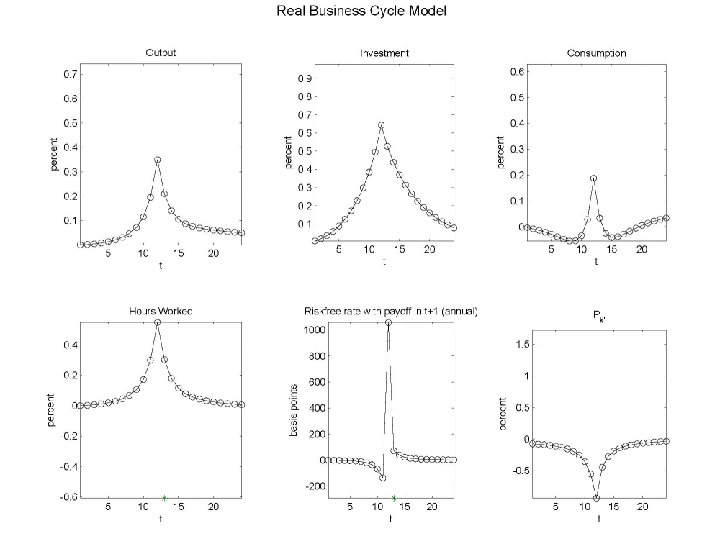
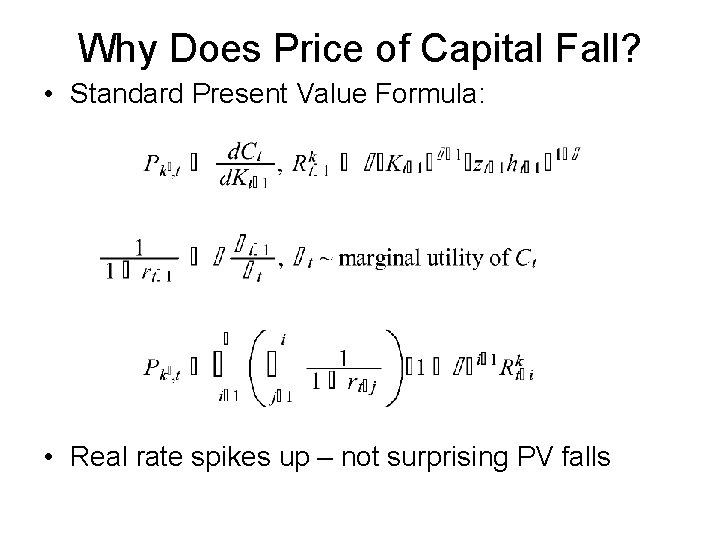
Why Does Price of Capital Fall? • Standard Present Value Formula: • Real rate spikes up – not surprising PV falls
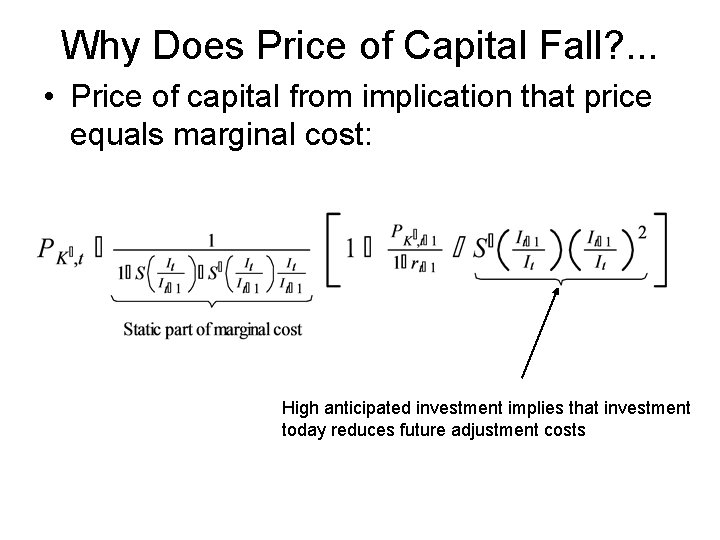
Why Does Price of Capital Fall? . . . • Price of capital from implication that price equals marginal cost: High anticipated investment implies that investment today reduces future adjustment costs
‘Monetizing the Model’ • We add: – Calvo sticky price setup (‘Phillips curve’) – Calvo sticky wage equations – Intertemporal Euler equation for bonds – Take limit where money demand goes to zero – Monetary policy rule
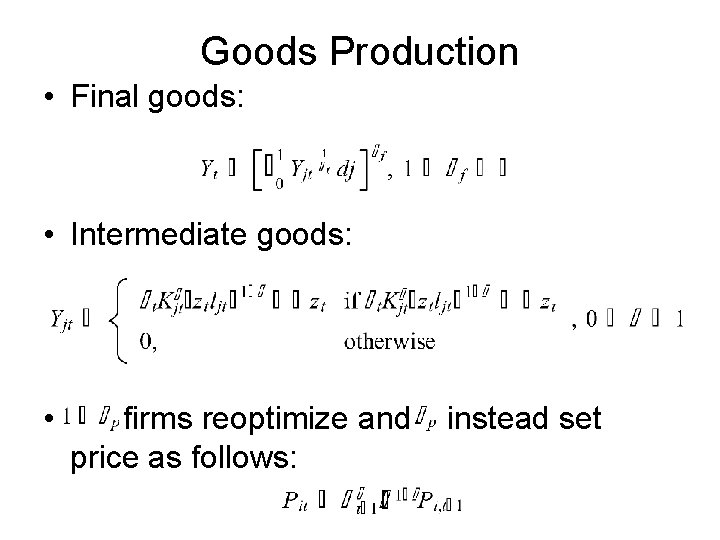
Goods Production • Final goods: • Intermediate goods: • firms reoptimize and price as follows: instead set
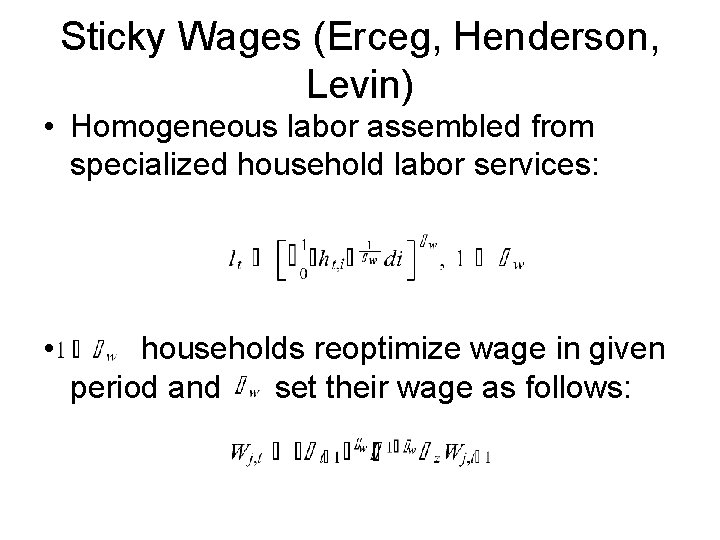
Sticky Wages (Erceg, Henderson, Levin) • Homogeneous labor assembled from specialized household labor services: • households reoptimize wage in given period and set their wage as follows:
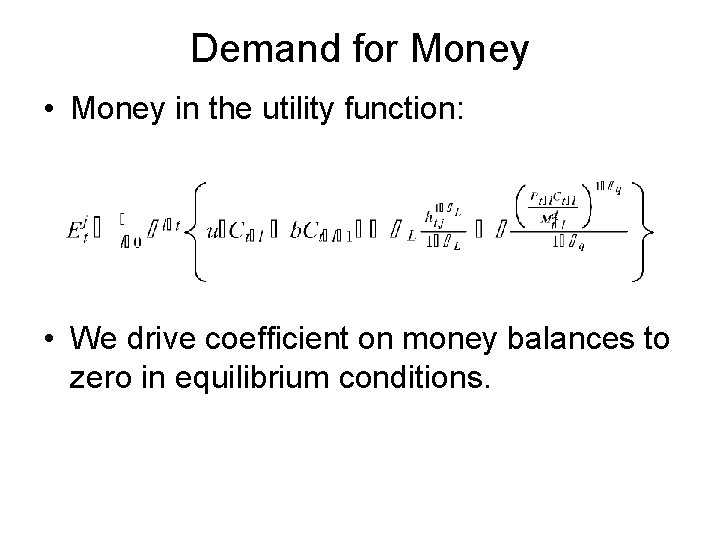
Demand for Money • Money in the utility function: • We drive coefficient on money balances to zero in equilibrium conditions.
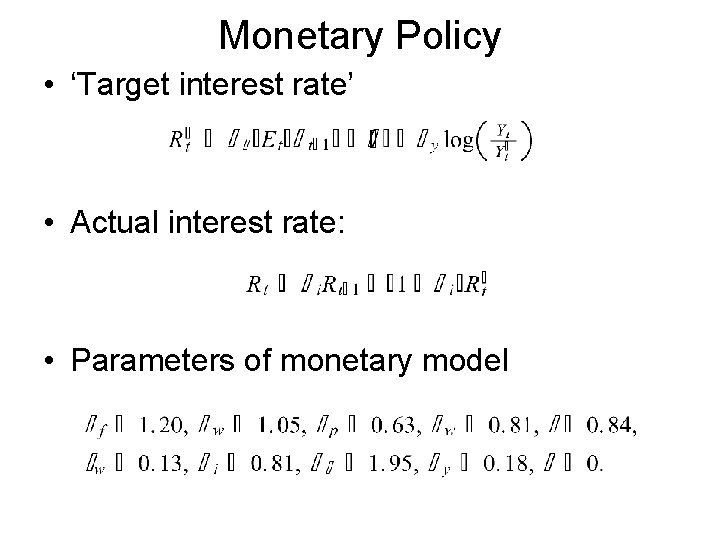
Monetary Policy • ‘Target interest rate’ • Actual interest rate: • Parameters of monetary model
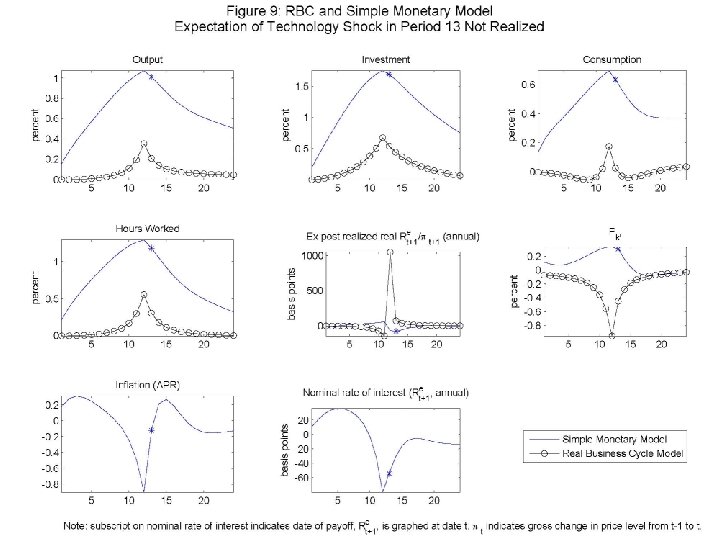
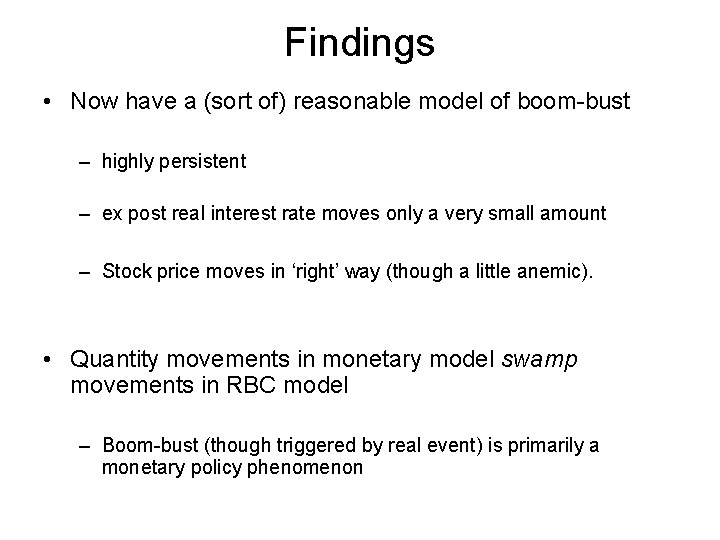
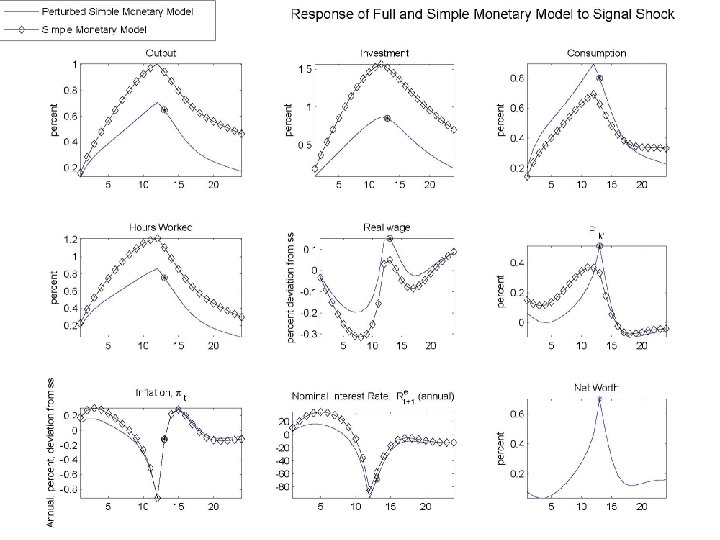
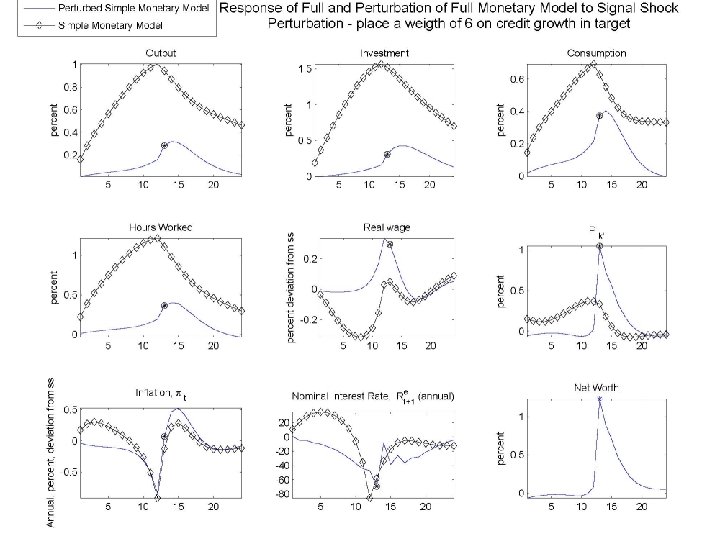
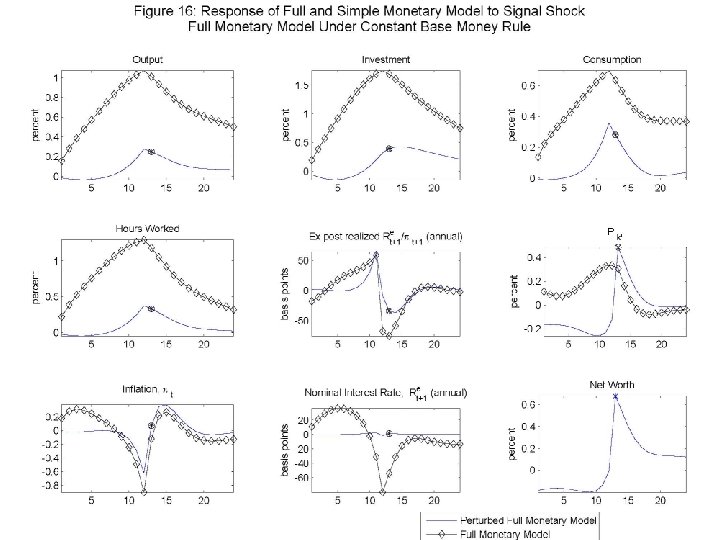
Findings • Now have a (sort of) reasonable model of boom-bust – highly persistent – ex post real interest rate moves only a very small amount – Stock price moves in ‘right’ way (though a little anemic). • Quantity movements in monetary model swamp movements in RBC model – Boom-bust (though triggered by real event) is primarily a monetary policy phenomenon
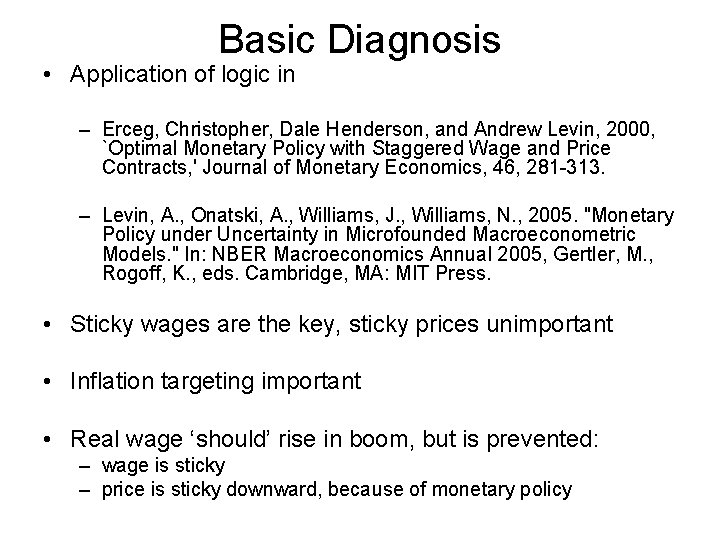
Basic Diagnosis • Application of logic in – Erceg, Christopher, Dale Henderson, and Andrew Levin, 2000, `Optimal Monetary Policy with Staggered Wage and Price Contracts, ' Journal of Monetary Economics, 46, 281 -313. – Levin, A. , Onatski, A. , Williams, J. , Williams, N. , 2005. "Monetary Policy under Uncertainty in Microfounded Macroeconometric Models. " In: NBER Macroeconomics Annual 2005, Gertler, M. , Rogoff, K. , eds. Cambridge, MA: MIT Press. • Sticky wages are the key, sticky prices unimportant • Inflation targeting important • Real wage ‘should’ rise in boom, but is prevented: – wage is sticky – price is sticky downward, because of monetary policy
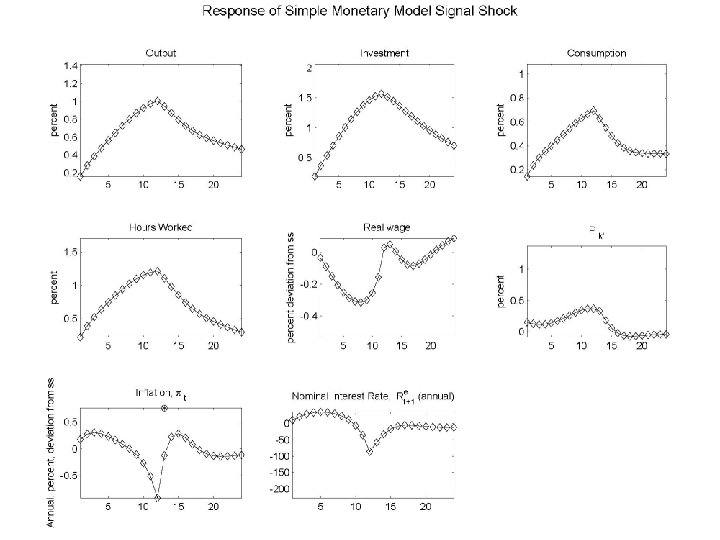
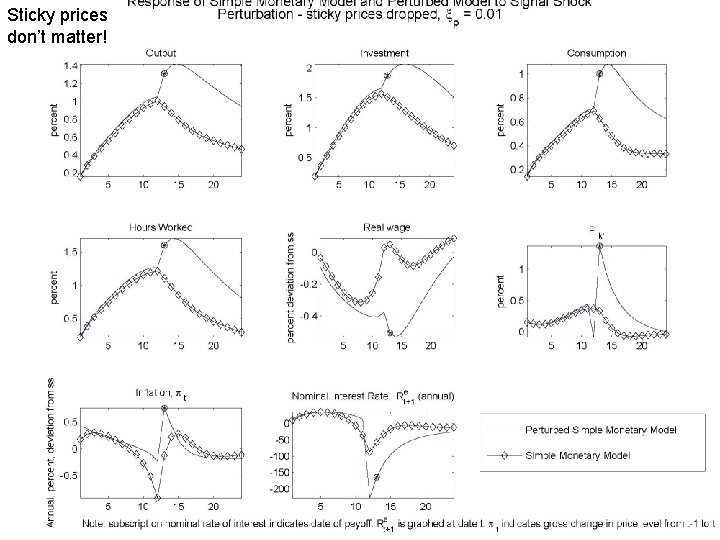
Sticky prices don’t matter!
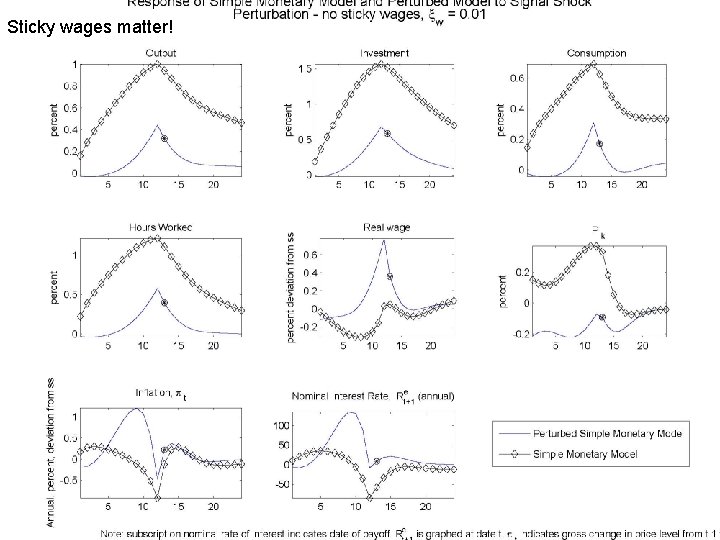
Sticky wages matter!
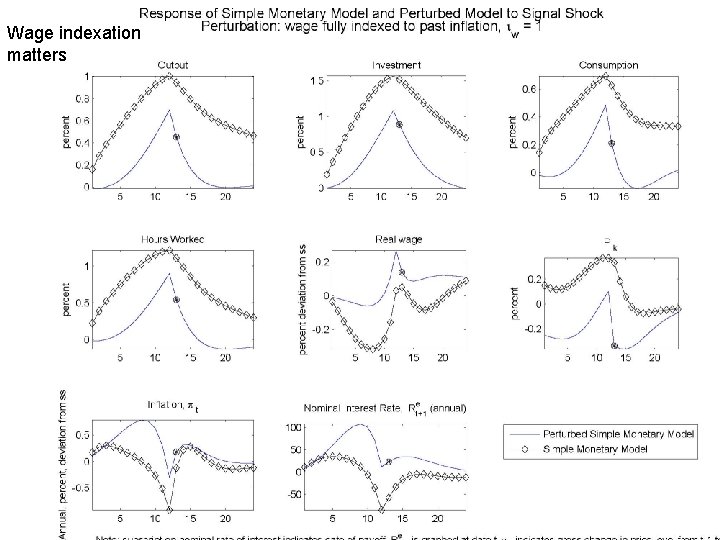
Wage indexation matters
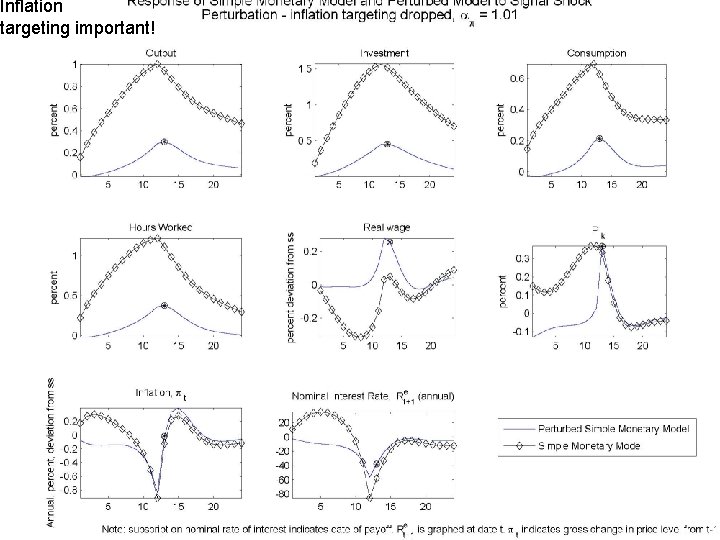
Inflation targeting important!
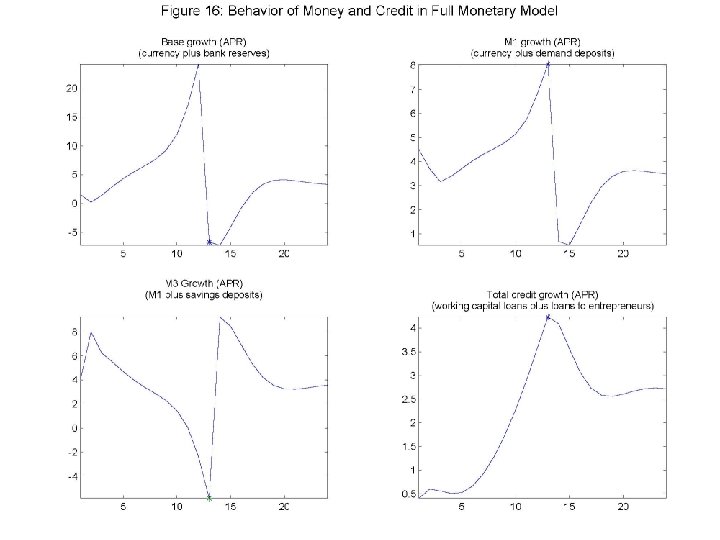
‘Full’ Model has Credit, Monetary Aggregates • Model incorporates banking sector, as in Chari, Christiano and Eichenbaum. – M 1, M 3, demand deposits, currency, bank reserves. • Financial frictions as in Bernanke, Gertler and Gilchrist. • Total credit (borrowing of working capital by banks, plus loans to entrepreneurs).
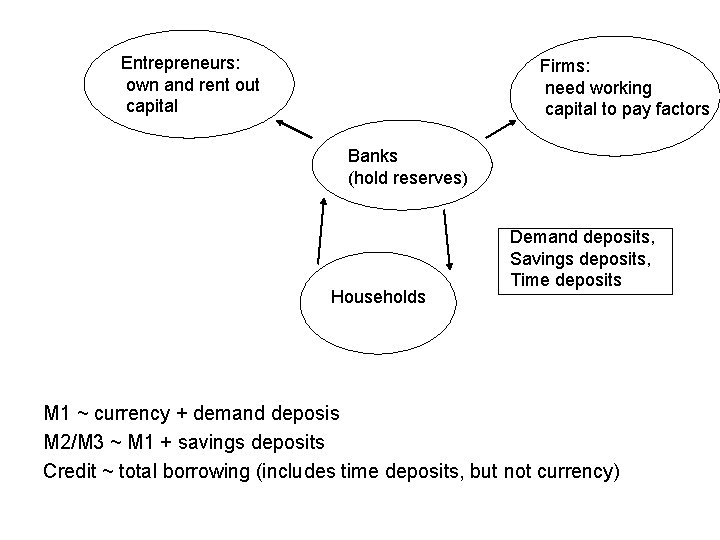
Entrepreneurs: own and rent out capital Firms: need working capital to pay factors Banks (hold reserves) Households Demand deposits, Savings deposits, Time deposits M 1 ~ currency + demand deposis M 2/M 3 ~ M 1 + savings deposits Credit ~ total borrowing (includes time deposits, but not currency)
Findings • BGG financial frictions attenuate somewhat the effects of boom-bust • Rationalizes monetary policy of looking at credit.
Conclusion • With habit persistence and cost-of-change adjustment costs, can make progress on generating stock market boom-bust. – But, problems… • Bring in sticky wages and inflation targeting, and can generate boom-bust • Perhaps monetary policy should react to other variables, such as credit growth.
- Slides: 45