
Molecular Replacement Tracey Barrett November 8 th 2018

Molecular Replacement Tracey Barrett, November 8 th, 2018
Molecular Replacement has applications in: Crystallography -Most widely used Structure determination technique. Requires the structure of a related homologue. EM -Placing atomic models into density derived from negative stain and Cryo EM maps. Will focus on crystallographic applications.
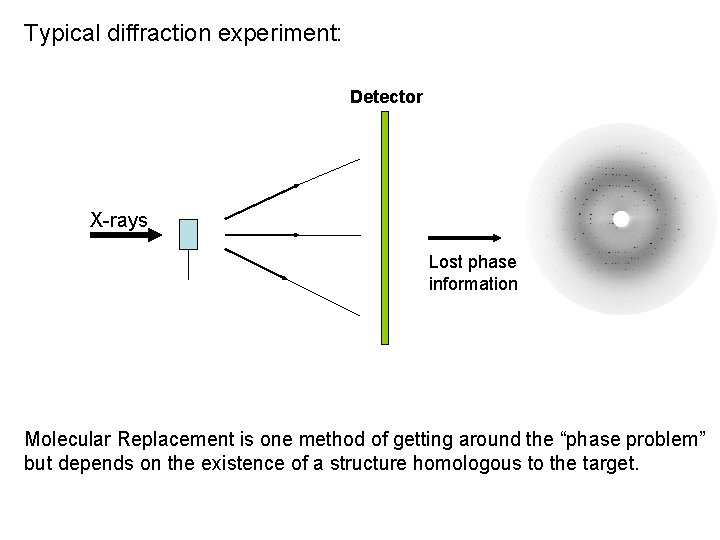
Typical diffraction experiment: Detector X-rays Lost phase information Molecular Replacement is one method of getting around the “phase problem” but depends on the existence of a structure homologous to the target.
Model factors that need to be taken into account when thinking about Molecular Replacement is more likely to fail for low homology models (ie < 30%). However, only 20% homology can sometimes result in success. Can now generate good quality homology models using programs that incorporate molecular dynamics such as ROSETTA. There are various tools available to “improve” existing homologues by removing loops or truncating side chains.
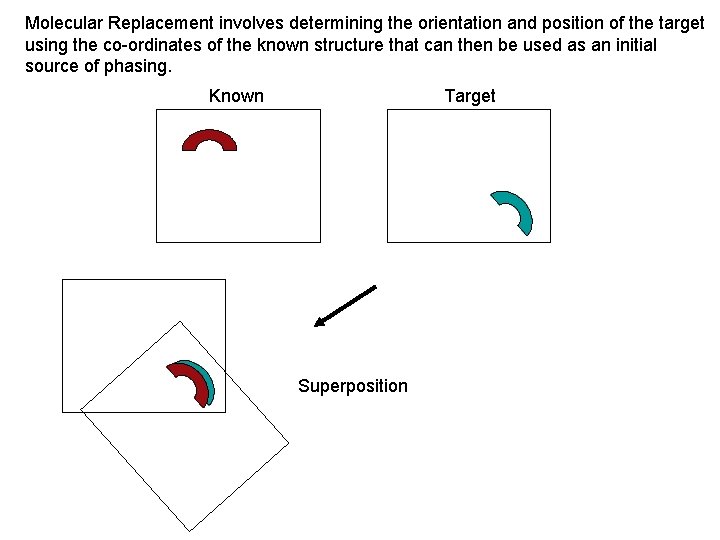
Molecular Replacement involves determining the orientation and position of the target using the co-ordinates of the known structure that can then be used as an initial source of phasing. Known Target Superposition
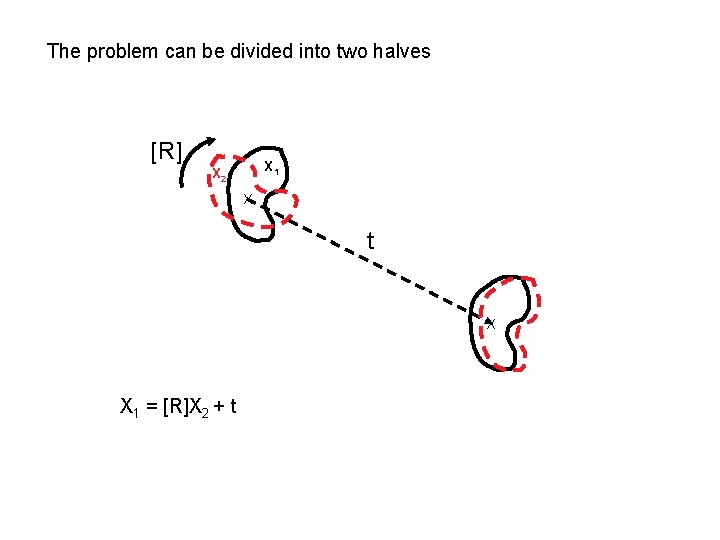
The problem can be divided into two halves [R] X 1 X 2 X t X X 1 = [R]X 2 + t
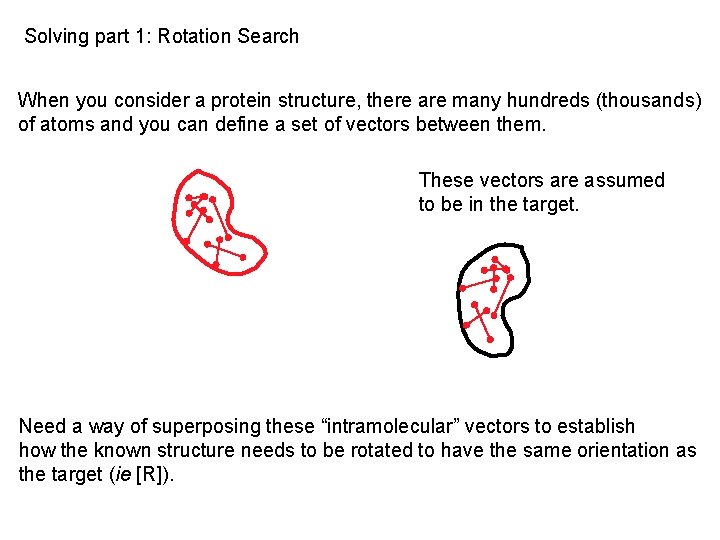
Solving part 1: Rotation Search When you consider a protein structure, there are many hundreds (thousands) of atoms and you can define a set of vectors between them. These vectors are assumed to be in the target. Need a way of superposing these “intramolecular” vectors to establish how the known structure needs to be rotated to have the same orientation as the target (ie [R]).
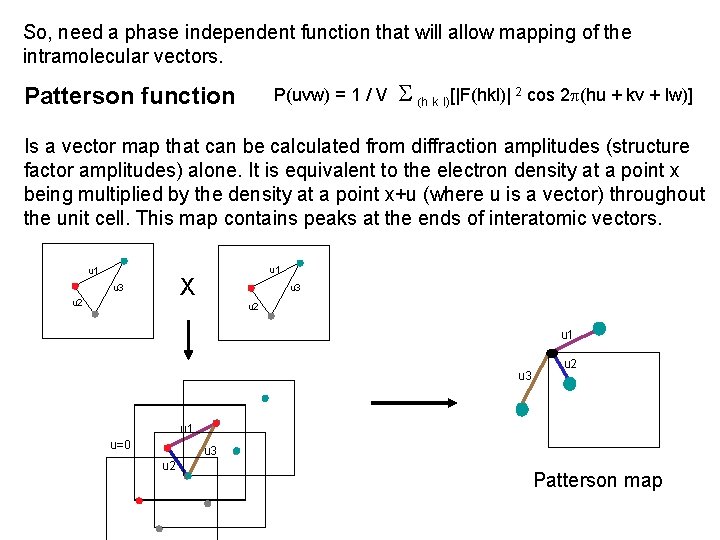
So, need a phase independent function that will allow mapping of the intramolecular vectors. Patterson function P(uvw) = 1 / V (h k l)[|F(hkl)| 2 cos 2 p(hu + kv + lw)] Is a vector map that can be calculated from diffraction amplitudes (structure factor amplitudes) alone. It is equivalent to the electron density at a point x being multiplied by the density at a point x+u (where u is a vector) throughout the unit cell. This map contains peaks at the ends of interatomic vectors. u 1 X u 3 u 2 u 1 u=0 u 3 u 2 Patterson map
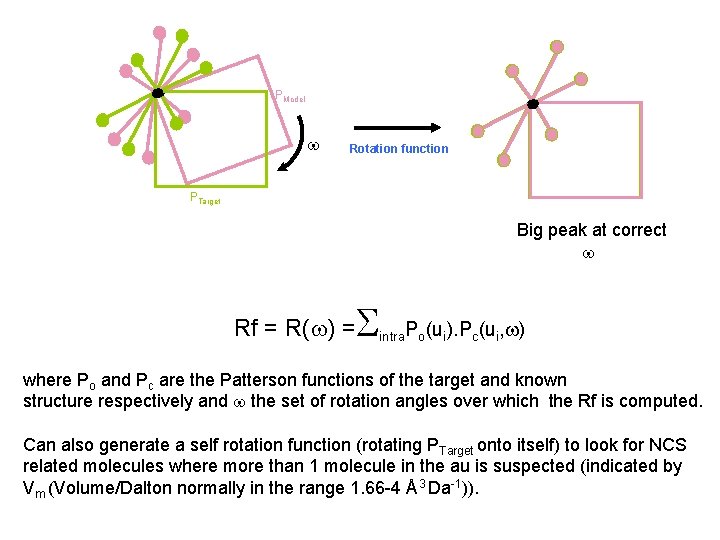
PModel Rotation function PTarget Big peak at correct Rf = R( ) = intra. Po(ui). Pc(ui, ) where Po and Pc are the Patterson functions of the target and known structure respectively and the set of rotation angles over which the Rf is computed. Can also generate a self rotation function (rotating PTarget onto itself) to look for NCS related molecules where more than 1 molecule in the au is suspected (indicated by Vm (Volume/Dalton normally in the range 1. 66 -4 Å3 Da-1)).
Factors that can influence the success of the rotation search Data completeness The data should be ≥ 95% complete, especially at the low resolution end, since the greatest contributions to Pattersons are the high intensity Fobs terms. Resolution The Rf is normally computed using data between 10 and 3Å. The low resolution cutoff is chosen so as to exclude solvent and other low resolution effects that can introduce errors into the Fobs data and the high, to minimise the effects of differences between the model and target that are more prominent above 3Å. Both have the potential to introduce noise.
The realities…………… The rotation function will often produce a list of peaks, so which ones are real? Rf/sigma. An indication will be the height of the peak above the background and/or the correlation coefficient associated with that solution. Here, absolute values are not important, but the level of discrimination (ie the drop between top peak(s) and the others in the listing). Caution: Large peaks can sometimes be due to noise! Persistance of peaks when certain Rf parameters are varied If a solution is real, it will still remain in the peak listing when parameters such as the resolution are varied, even if it changes position. But what happens if there is no discrimination, ie the landscape is flat? Continue! Sometimes, it is only in the later stages of the procedure when dealing with the translation search that the correct solution becomes clear.
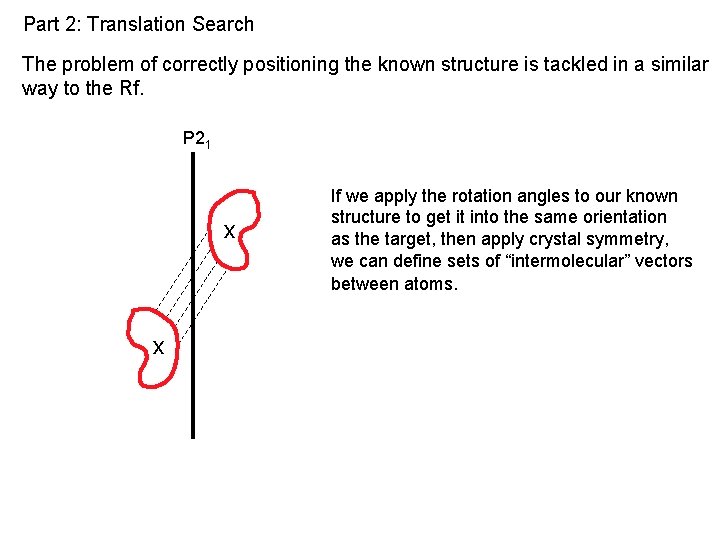
Part 2: Translation Search The problem of correctly positioning the known structure is tackled in a similar way to the Rf. P 21 x x If we apply the rotation angles to our known structure to get it into the same orientation as the target, then apply crystal symmetry, we can define sets of “intermolecular” vectors between atoms.
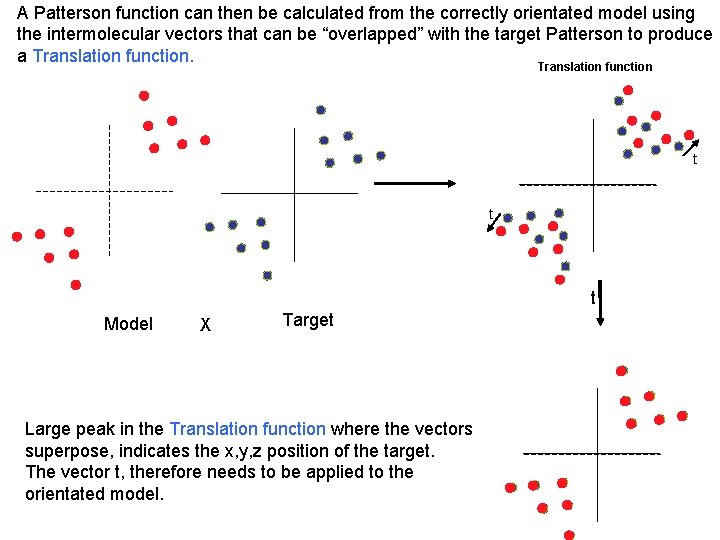
A Patterson function can then be calculated from the correctly orientated model using the intermolecular vectors that can be “overlapped” with the target Patterson to produce a Translation function t t t Model X Target Large peak in the Translation function where the vectors superpose, indicates the x, y, z position of the target. The vector t, therefore needs to be applied to the orientated model.
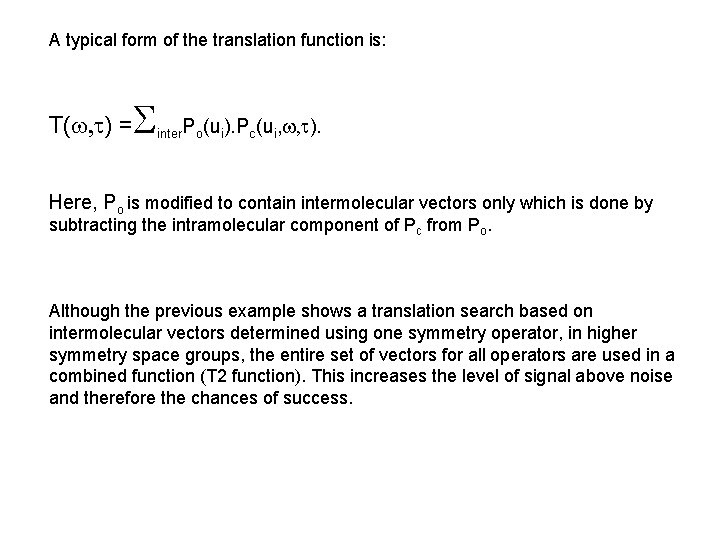
A typical form of the translation function is: T( ) = inter. Po(ui). Pc(ui, ). Here, Po is modified to contain intermolecular vectors only which is done by subtracting the intramolecular component of Pc from Po. Although the previous example shows a translation search based on intermolecular vectors determined using one symmetry operator, in higher symmetry space groups, the entire set of vectors for all operators are used in a combined function (T 2 function). This increases the level of signal above noise and therefore the chances of success.
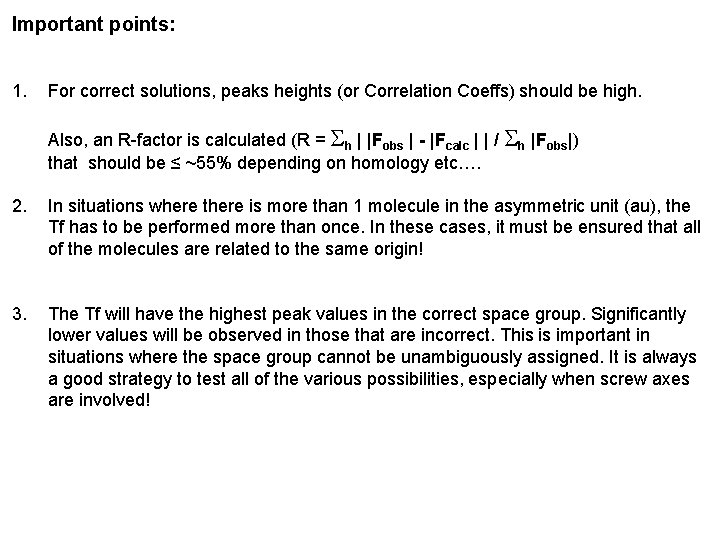
Important points: 1. For correct solutions, peaks heights (or Correlation Coeffs) should be high. Also, an R-factor is calculated (R = h | |Fobs | - |Fcalc | | / h |Fobs|) that should be ≤ ~55% depending on homology etc…. 2. In situations where there is more than 1 molecule in the asymmetric unit (au), the Tf has to be performed more than once. In these cases, it must be ensured that all of the molecules are related to the same origin! 3. The Tf will have the highest peak values in the correct space group. Significantly lower values will be observed in those that are incorrect. This is important in situations where the space group cannot be unambiguously assigned. It is always a good strategy to test all of the various possibilities, especially when screw axes are involved!
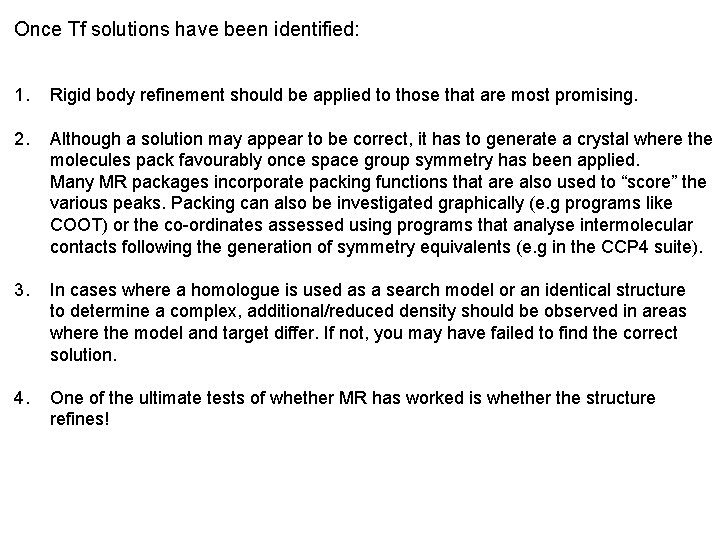
Once Tf solutions have been identified: 1. Rigid body refinement should be applied to those that are most promising. 2. Although a solution may appear to be correct, it has to generate a crystal where the molecules pack favourably once space group symmetry has been applied. Many MR packages incorporate packing functions that are also used to “score” the various peaks. Packing can also be investigated graphically (e. g programs like COOT) or the co-ordinates assessed using programs that analyse intermolecular contacts following the generation of symmetry equivalents (e. g in the CCP 4 suite). 3. In cases where a homologue is used as a search model or an identical structure to determine a complex, additional/reduced density should be observed in areas where the model and target differ. If not, you may have failed to find the correct solution. 4. One of the ultimate tests of whether MR has worked is whether the structure refines!
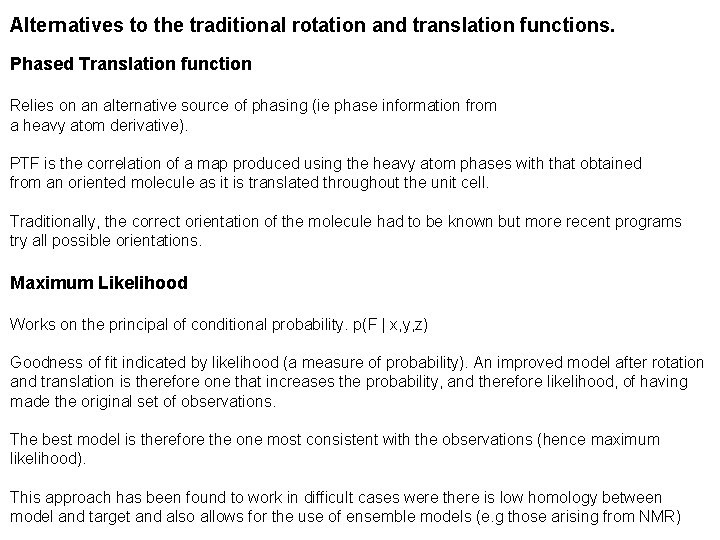
Alternatives to the traditional rotation and translation functions. Phased Translation function Relies on an alternative source of phasing (ie phase information from a heavy atom derivative). PTF is the correlation of a map produced using the heavy atom phases with that obtained from an oriented molecule as it is translated throughout the unit cell. Traditionally, the correct orientation of the molecule had to be known but more recent programs try all possible orientations. Maximum Likelihood Works on the principal of conditional probability. p(F | x, y, z) Goodness of fit indicated by likelihood (a measure of probability). An improved model after rotation and translation is therefore one that increases the probability, and therefore likelihood, of having made the original set of observations. The best model is therefore the one most consistent with the observations (hence maximum likelihood). This approach has been found to work in difficult cases were there is low homology between model and target and also allows for the use of ensemble models (e. g those arising from NMR)
Widely used Molecular Replacement programs- Traditional AMo. Re Classical Molecular Replacement using rotation and translation functions together with fitting routines. Can be used to orient and position models based on EM maps. For standard Molecular Replacement, AMo. Re is now a bit out of date but can be run from the CCP 4 gui by typing CCP 4 i 2. Molrep Standard package. Very straightforward to use. Some implementation of Maximum Likelihood and also a packing function. Can use EM maps. Molrep forms the basis of the following case study. Can be run from the CCP 4 Gui. Phaser Full maximum Likelihood approach using likelihood based rotation and translation functions. Also incorporates a packing function and fitting routines. Can perform six dimensional searches on a limited grid and allows the use of molecules of known orientation. The newest version also allows use of EM maps as search models. Can be run from the CCP 4 Gui.
Mr. BUMP Automated Molecular Replacement script using Phaser and/or Molrep, but with more “optimised” models produced using CHAINSAW and other software based on the amino acid sequence of the target. AMPLE Ab initio generation of models using Rosetta followed by molecular replacement and model building using other software (e. g ARP/w. ARP, Buccaneer) Como Does a full 6 D search and has a Gui interface in which various parameters can be set. Como is slow. Hasn’t been updated since 2006. EPMR Doesn’t use any of the traditional Molecular Replacement methods but is based on an “evolutionary protocol”. A large number of “solutions” are generated by randomly positioning the target throughout the unit cell followed by Molecular dynamics. Their correlation to the observed data are then determined and poor solutions excluded before the process is repeated. A solution can never be guaranteed, even with 100% identity! This approach, however, has proved successful when others have failed but relies on the correct solution being at an energy minimum.
Wide Search Molecular Replacement (WSMR) Available via the SBgrid Science portal (hosted by the SBgrid consortium that provides web enabled Structural Biology software). Given a set of reflections, >100, 000 domains within the protein data bank are sequentially trialed in Molecular Replacement searches using Phaser. These are then ranked by likelihood and score. Has been shown to be a particular useful method in situations where there is weak or poor homology, especially if it wasn’t previously detected. It is also a good way of placing domains. Drawback. Can take up to 4 weeks for a job to be run owing to the length of the queue!
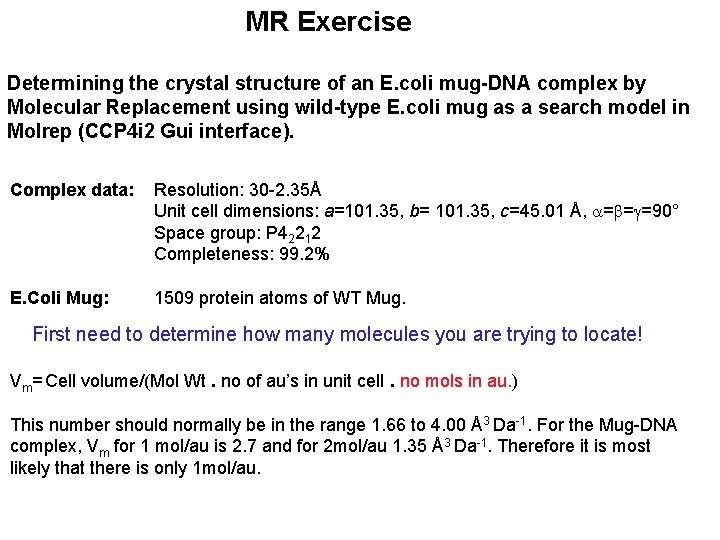
MR Exercise Determining the crystal structure of an E. coli mug-DNA complex by Molecular Replacement using wild-type E. coli mug as a search model in Molrep (CCP 4 i 2 Gui interface). Complex data: Resolution: 30 -2. 35Å Unit cell dimensions: a=101. 35, b= 101. 35, c=45. 01 Å, = = =90° Space group: P 42212 Completeness: 99. 2% E. Coli Mug: 1509 protein atoms of WT Mug. First need to determine how many molecules you are trying to locate! Vm= Cell volume/(Mol Wt. no of au’s in unit cell. no mols in au. ) This number should normally be in the range 1. 66 to 4. 00 Å3 Da-1. For the Mug-DNA complex, Vm for 1 mol/au is 2. 7 and for 2 mol/au 1. 35 Å3 Da-1. Therefore it is most likely that there is only 1 mol/au.
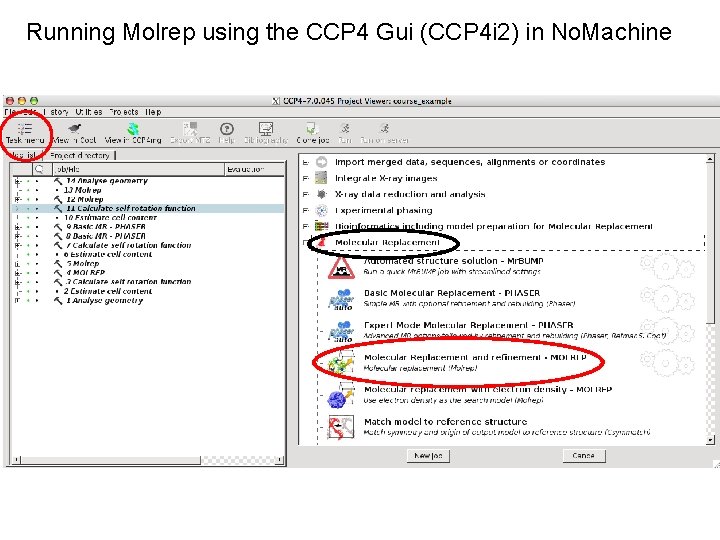
Running Molrep using the CCP 4 Gui (CCP 4 i 2) in No. Machine
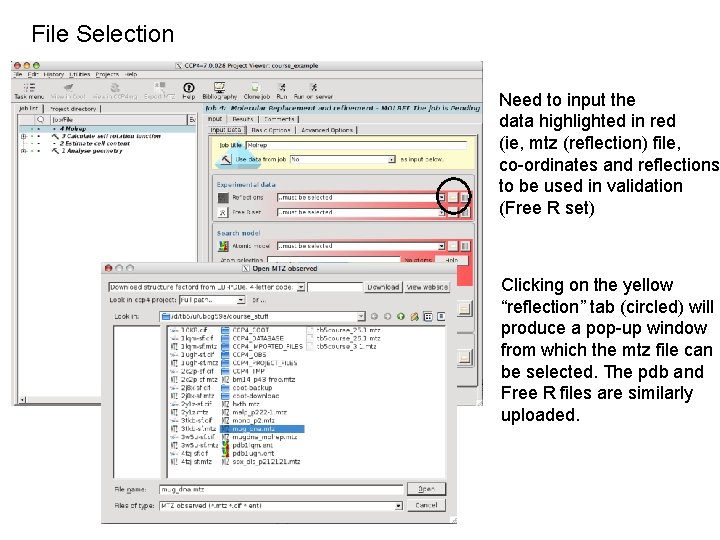
File Selection Need to input the data highlighted in red (ie, mtz (reflection) file, co-ordinates and reflections to be used in validation (Free R set) Clicking on the yellow “reflection” tab (circled) will produce a pop-up window from which the mtz file can be selected. The pdb and Free R files are similarly uploaded.
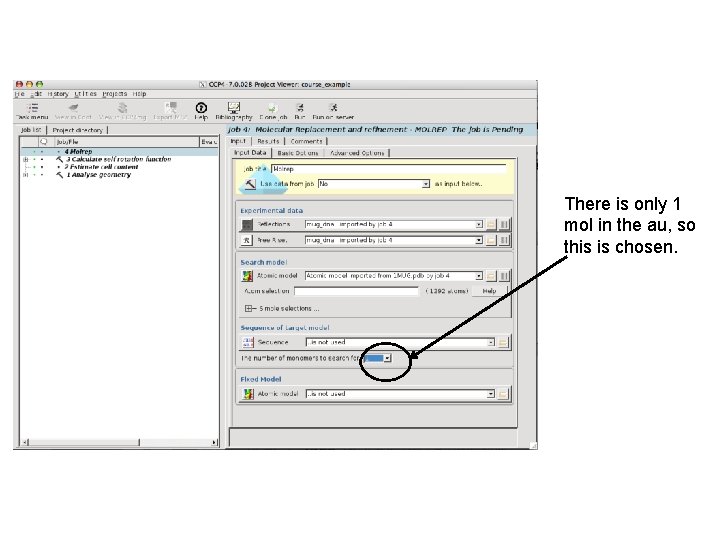
There is only 1 mol in the au, so this is chosen.
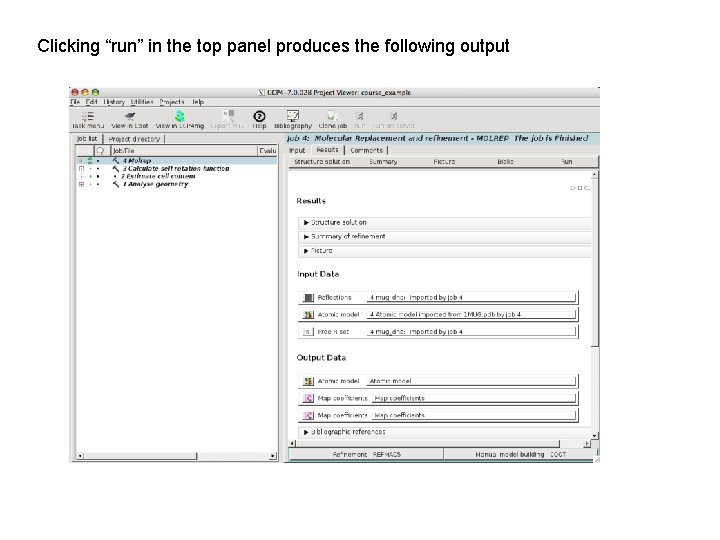
Clicking “run” in the top panel produces the following output
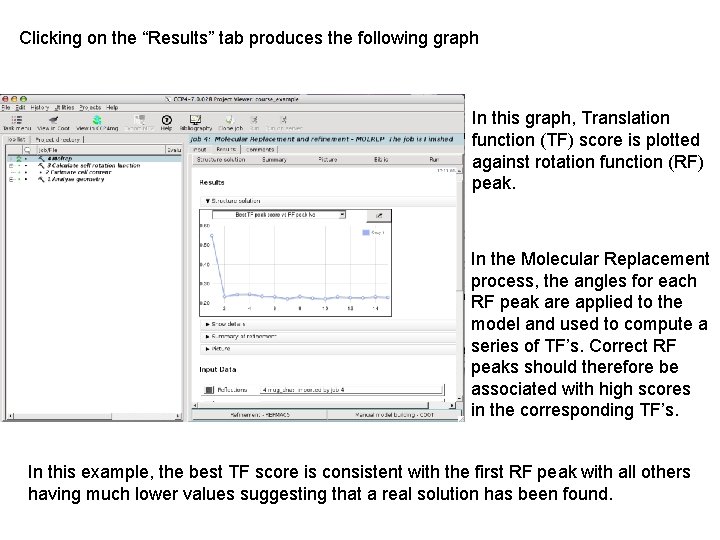
Clicking on the “Results” tab produces the following graph In this graph, Translation function (TF) score is plotted against rotation function (RF) peak. In the Molecular Replacement process, the angles for each RF peak are applied to the model and used to compute a series of TF’s. Correct RF peaks should therefore be associated with high scores in the corresponding TF’s. In this example, the best TF score is consistent with the first RF peak with all others having much lower values suggesting that a real solution has been found.
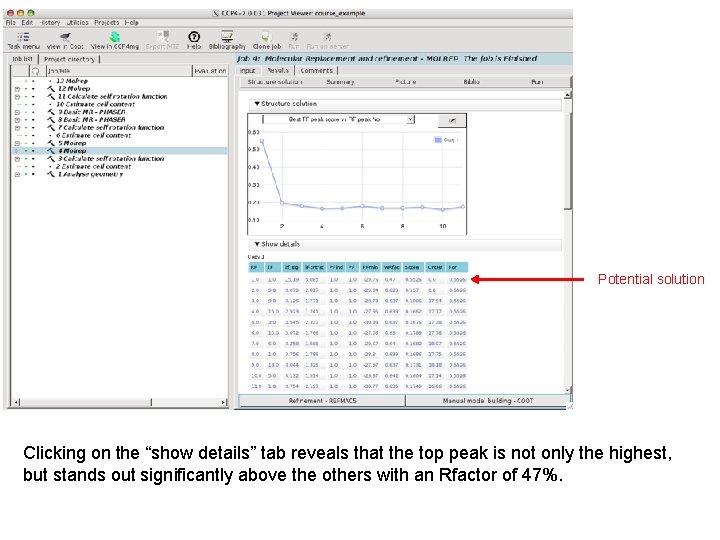
Potential solution Clicking on the “show details” tab reveals that the top peak is not only the highest, but stands out significantly above the others with an Rfactor of 47%.
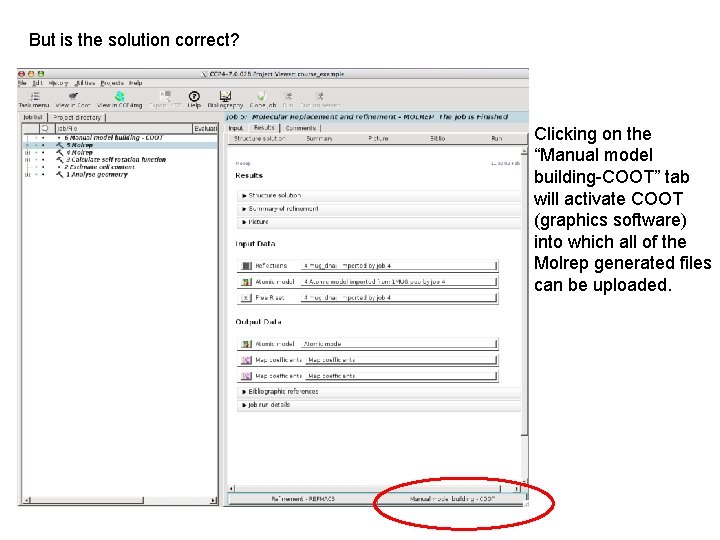
But is the solution correct? Clicking on the “Manual model building-COOT” tab will activate COOT (graphics software) into which all of the Molrep generated files can be uploaded.
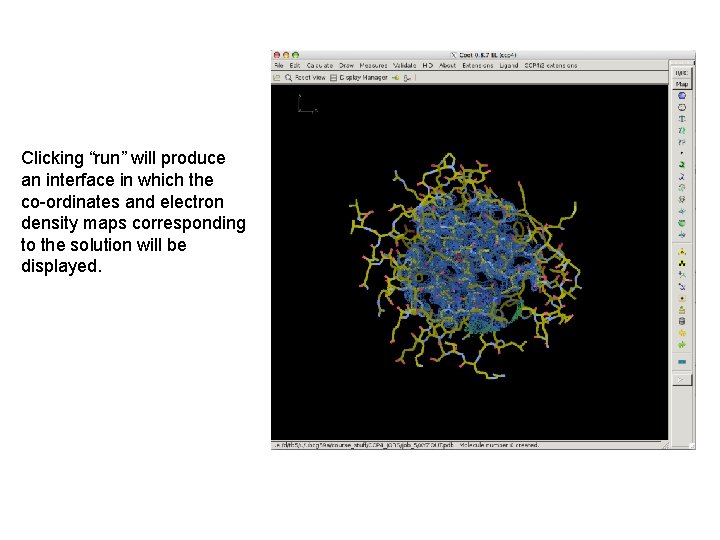
Clicking “run” will produce an interface in which the co-ordinates and electron density maps corresponding to the solution will be displayed.
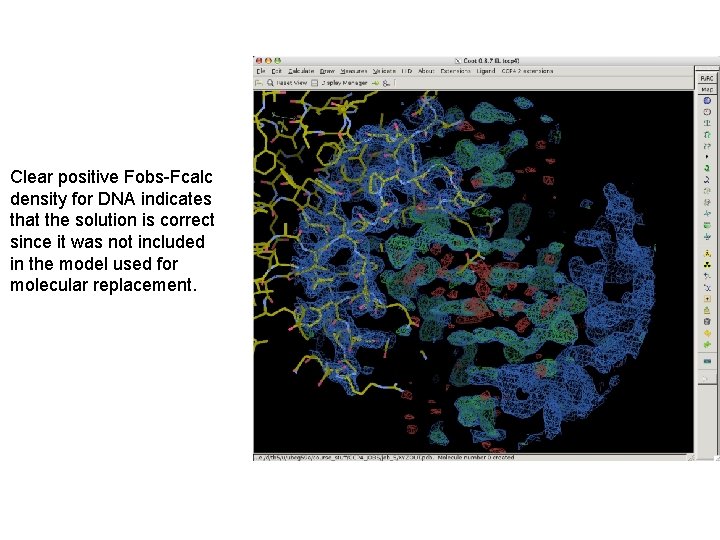
Clear positive Fobs-Fcalc density for DNA indicates that the solution is correct since it was not included in the model used for molecular replacement.
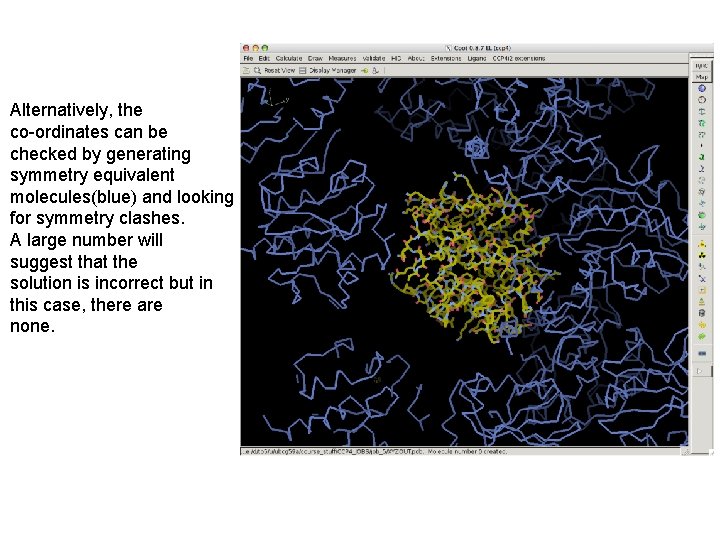
Alternatively, the co-ordinates can be checked by generating symmetry equivalent molecules(blue) and looking for symmetry clashes. A large number will suggest that the solution is incorrect but in this case, there are none.
- Slides: 31