Molecular phylogeny PHYLOGENTIC TREES ARE HYPOTHESES of how

")

 1. Alignments – taxon sampling Alignment is a matrix: • Rows")


, Unweighted Pair Group Method")

 -It is a hyerarchical clustering algorithm.")
 more taxa more tree topologies (!) = more bipartitions")

 2) 3) 4) Identify the shortest distance in")


/transversions (4) ! Protein")
 is the alignment of three or more biological sequences (protein")

 is a principle of")


 character state tree (evolutionary")


 stepwise branch-addition only")
 The best, shortest")

 No major changes could get stuck on local")


 Model selected: Model = TIM 2+I+G partition")


 process which happen in chains according the Markov-process (e.")


: offers a measure of how much the data support the relationships depicted")

- Slides: 54
Molecular phylogeny PHYLOGENTIC TREES ARE HYPOTHESES of how ‘things’ are related through evolution. HOW DO WE FIND THE BEST HYPOTHESIS? 1. Alignment(s) taxon sampling !!! 2. Selection of the analysis method(s) 3. Model of nucleotide substitution 4. Inferring phylogeny(ies) 5. Interpretation of the results (evolution, speciation, …)
Molecular systematics - Molecular phylogenies Scope of the study 1. Appropiate selection of gene(s) target 2. Collection of enought sequence data 3. 4. Sufficient taxon sampling for the problem of interest Selection and use of accurate analytical method(s) nucleotide sequences (protein coding/ nuclear + conserved (ITS, LSU, SSU, Cox, …) / mitochondrial / plastidial; amino acid sequence
Molecular phylogeny Collection of enought sequence data Include more samples than those which would be enought (!) “Data erosion” PCR and sequencing (do not underestimate the failure rate!)
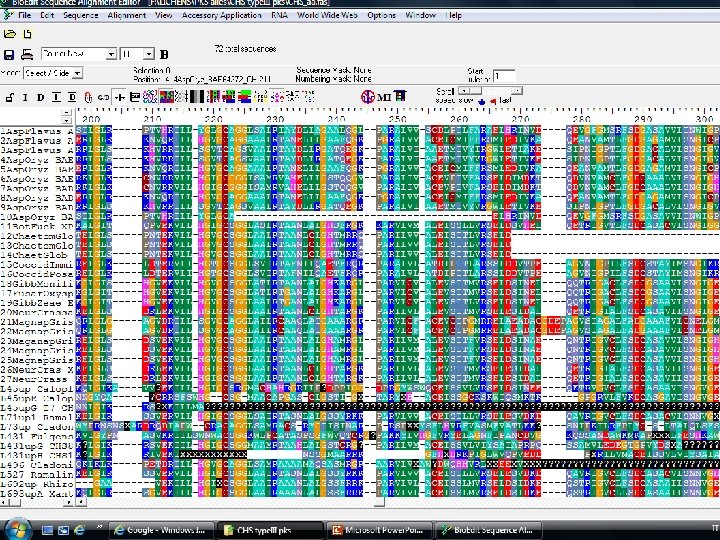
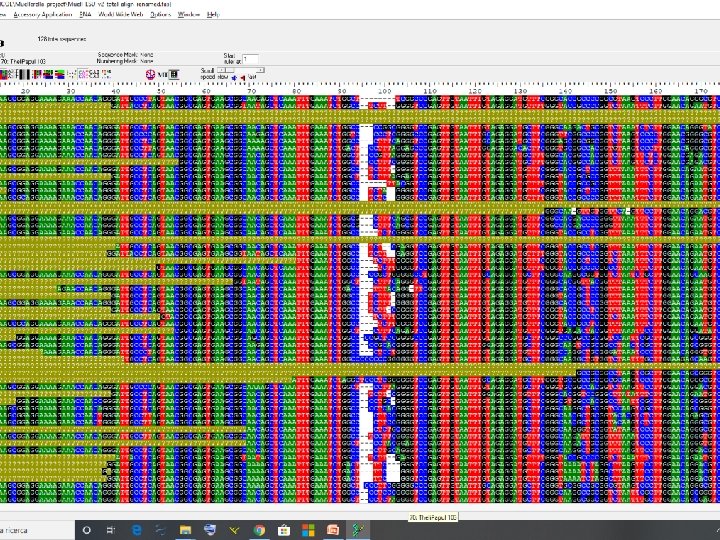
Molecular phylogeny (4) 1. Alignments – taxon sampling Alignment is a matrix: • Rows are OTU • Columns are characters Bio. Edit MEGA (PAUP, NEXUS format)
ISSUES in molecular systematics 1. 1. Accumulation of difference in different lineages usually does not occur uniformly. Evolution -as a branching process- is an oversimplification (models!): sexual recombination, lateral gene transfer, genes duplication, deletion… Homoplasy VS Homology: Convergent and parallel evolution
Molecular phylogeny Taxon sampling More taxa or more loci? d. B = Accuracy of phylogenetic method = # of correct taxon bipartitions found on the estimated tree total # of taxon bipartitions found for S taxa • More taxa more accuracy breaking of long branches More loci/ longer sequences more accuracy breaking of long branches •
Molecular phylogeny Taxon sampling More taxa more accuracy • More taxa more tree topologies (!) •
Molecular phylogeny Taxon sampling More loci or longer sequences more accuracy • Pollock et al. (2002) see Rosenberg & Kumar (2001)
Molecular phylogeny Methods of analysis Distance-based methods: Neighbour Joining (NJ), Unweighted Pair Group Method with Arithmetic Mean (UPGMA) 1) Character-based methods: Maximum Parsimony, Maximum Likelihood, Bayesian 1) Non parametric (non statistical): MP TCS – DAMBE - Split. Trees -PAUP Parametric (statistical): ML, Bayesian RAx. ML – Phy. L - Tree. Puzzle – PAML - Mr. Bayes – BEAST - BEST
Molecular phylogeny Distance methods Principle: Organism sharing a common ancestor should, on average, be more similar to each other than organism whose last common ancestor was more ancient. Infos in the sequences pairwise distance matrix phylogenetic tree in which the evolution of the sequences mirrors their distances How to use the distance matrix? distance-based algorithms: 1)UPGMA (Unweighted Pair Group Method with Arithmetic Mean) It’s a clustering algorithm: aims at grouping the most similar sequences, regardless of their evolutionary rate or phylogenetic affinities 2)NJ Neighbour Joining
UPGMA (Unweighted Pair Group Method with Arithmetic mean) -It is a hyerarchical clustering algorithm. - It aims at grouping the most similar sequences, regardless of their evolutionary rate or phylogenetic affinities a b c d e a 0 17 21 31 23 b 17 0 30 34 21 c 21 30 0 28 39 d 31 34 28 0 43 e 23 21 39 43 0 ((a, b), e) (c, d) 0 33 33 0 (a, b) e c d 0 25. 5 32. 5 22 c 25. 5 0 28 39 d 32. 5 28 0 43 e 22 39 43 0 (a, b) (21+30)/2=25. 5 (31+34)/2=32. 5 (23+21)/2=22 ((a, b), e) c d 0 30 36 c 30 0 28 d 36 28 0 ((a, b), e)
Distance-based methods: Neighbour Joining (NJ) more taxa more tree topologies (!) = more bipartitions • Exhaustive search: make ALL trees first, and then see which one best fits the data (you need an optimality criterion).
CAN WE CONSIDER ALL POSSIBLE TREES? ? Heuristic tree search!! Try to find a way to find an optimal tree (hopefully the best) without testing them all. You need an optimality criterion, you are not guaranteed to find the best, but you save time.
Progressive clustering methods : UPGMA 1) 2) 3) 4) Identify the shortest distance in the matrix among our taxa Cluster those taxa in one as a single OUT Calculate the new distance matrix in relation to the new taxon Repeat 1 -2 -3 Neighbour Joining 1) 2) 3) 4) 5) 6) All OTUs branching from a single central node Calculate S as: sum of distance between an OUT and every other divided by n-2 (n: number of taxa) Calculate Mij and create a node that joins the OUTs with the lowest distance: Mij=Dij-Si-Sj Calculate branch lengths Calculate new distance matrix with i and j joined (U 1). Repeat
Distance-based method Disadvantages Advantages • • Fast, computationally light Based only on a simple distance matrix • • Loss of information (alignment distance matrix) The number of differences can not accumulate linearly with time (saturation) underestimation of distance
MOLECULAR CLOCK Is a figurative term for a technique that uses the mutation rate of biomolecules to deduce the time in prehistory when two or more life forms diverged. - strict vs relaxed -
…a step backward!! Distance-based method • Similarity between sequences transitions (2)/transversions (4) ! Protein sequences: degeneracy (redundancy) of the genetic code (synonym d. S vs. non-synonimous substitution d. N) purifying selection positive selection <1 = d. N/d. S purifying selection: amino acid change is deleterious, selection reduces its fixation
Multiple Sequence Alignment (MSA) is the alignment of three or more biological sequences (protein or nucleic acid) of similar length: Output homology evolutionary relationships between the sequences. Pairwise Sequence Alignment tools are used to identify regions of similarity that may indicate functional, structural and/or evolutionary relationships between two biological sequences. Global vs. local Clustal. W, MAFFT, MUSCLE, Bio. Edit, MEGA, etc……
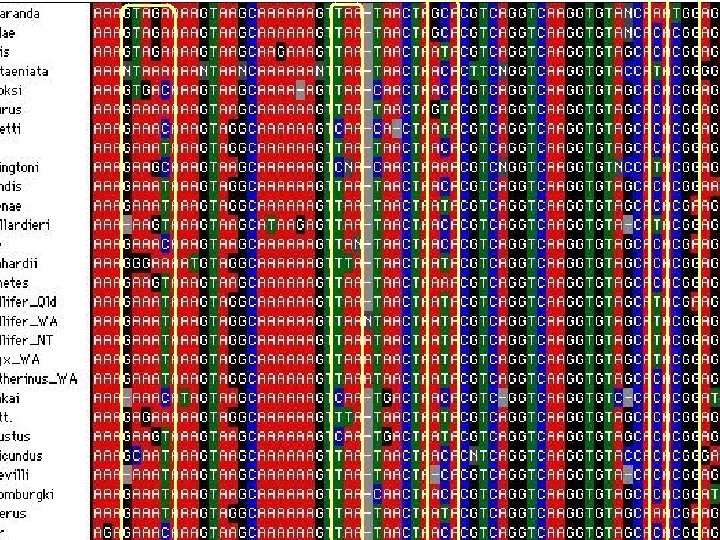
Variable region intron
Molecular phylogeny MP Ockham's razor: from Williamof Ockham (lex parsimoniae) is a principle of parsimony, economy used in logic and problem-solving. «Among competing hypotheses which predict equally well, the hypothesis with the fewest assumptions should be selected. » Heuristic: experience-based techniques for problem solving, learning, discovery; gives a solution which is not guaranteed to be optimal satisfactory solution! in science: preference of simples solutions/methods more and easier testable!!! falsifiability
Molecular phylogeny MP characters = positions in the aligments Steps = evolutionary steps minimum number of state changes (costs) constant / invariable characters (sites) = not informative Parsimony informative characters ( at least 2 char. states and >2 taxa!!!) Frequent, concentrate homoplasy wrong phylogeny
Molecular phylogeny MP Tree lenght or parsimony score = sum of the number of steps necessary to obtain that tree (the shortest!!) Most parsimonious tree Discrete characters character state binary multistate ordered unordered
Molecular phylogeny binary MP linearly ordered (transfromation treated as additive) character state tree (evolutionary relationships among character states) matrix character (ordered) change of state cost (differently weighted) change of state reversible
In protein coding sequences: Saturation all sites have undergone so many changes that the sequence does no longer contain any evolutionary information. Saturation = the point at which multiple substitutions have occurred at the same degenerate codon position, such that it is not possible to accurately estimate sequence divergence. What about sequences saturation along evolutionary time?
How does the MP method work? 1. 2. 3. 4. 5. Generate all possible topologies Overlay alignment column 1 on tree Ancestral character state reconstruction Count state changes: less steps �more parsimonious tree Repeat for the entire alignment and all possible tree (? ? ? )
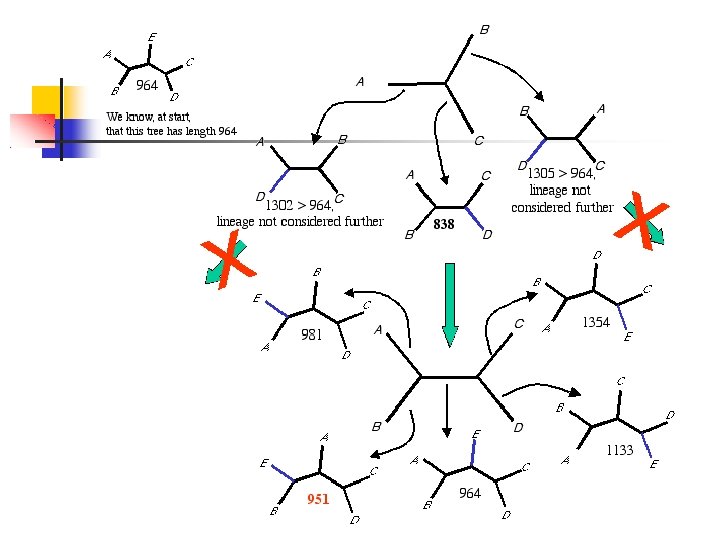
Heuristic search MP Optimality criterion exhaustive search (branchand-bound; OR heuristic search) stepwise branch-addition only local optimum !
Molecular phylogeny MP Heuristic search star decomposition Star decomposition (seldom used!) The best, shortest tree is the starting point for the next run only local optimum !
Molecular phylogeny MP Heuristic search branch swapping algorithms: branches of a certain tree are re-arranged an the new score is checked for improvement (or not) Nearest Neighbour Interchanges (NNI) Subtree Pruning Recrafting (SPR) Tree bisection and Reconnection (TBR)
Molecular phylogeny Nearest Neighbour Interchanges (NNI) No major changes could get stuck on local optima Subtree Pruning and Regrafting (SPR) MP
Nucleotide Substitution models How to generate the distance matrix from alignment? N = number of states (DNA=4) Lambda = proportion of sites which are different ASRV = Among Site Rate Variation Uncorrected distance nucleotide substitution models • Relative substitution rate • Nucleotide frequencies = base composition ( A, G, T, C)
Nucleotide Substitution models A model is a trade-off between bias, variance and computation expense; it should ideally be chosen by a careful consideration of its role on the analysis rather than mechanistic use of a model selection procedure homogeneous modeling vs heterogeneous modeling Homogeneous models: do not account for compositional variation and exchange rate variation across the phylogeny (between species in the alignment) or across the data (e. g. , between sites in the alignment)…. . TOO SIMPLISTIC!!!
Substitution models Softwares for model estimation: j. Model. Test, Modelgenerator Partition. Finder … Partition by codon / by genes j. Model. Test 42, Modelgenerator 43 or Partition. Finder 4 Heterogeneous models: account for compositional variation and exchange rate variation (HETEROGENEITY) in sequences data MORE REALISTIC!!! sites in the same partition have similar evolutionary characteristics while those in different partitions have different characteristics
Substitution models I: invariant sites Γ: ASRV π: base frequencies Φ: substitution rates
JC 69: Jukes&Cantor 1969 Substitution models low Is the simplest model. It assumes equal base frequencies in a sequence/ alignment ( A= G= C= T=1/4) and equal mutation rate. K 80: Kimura two parameters (1980) It assumes equal base frequencies in a sequence/ alignment ( A= G= C= T=1/4). Transitions and transversions. F 81: Felsenstein (1981) It assumes variable base frequencies in a sequence/ alignment ( A G C T 1/4). complexity GTR: General Time Reversible substitution is the most general neutral, independent, finite-sites, timereversible model possible quilibrium base frequency vector for A G T C. Equal transitions and transversions rates high
Substitution models Substitution rate heterogeneity between different alignment positions Invariable site vs. highly variabe positions «Rate heterogenity among site rate» Gamma distribution: (scale parameter: height) and (shape!!) general low substitution rate small rates differ significantly between sites: few sites having high rates and others being practically invariant. GTR+ +
Substitution models 1. What are models? Models as estimators of evolutionary changes lineage divergence 1. Mutation are independent 2. Tree-like evolution 3. Stationarity of mutational process 4. Reversibility 5. Mutations are not influenced by previous mutations
Substitution models 2. Must a model be exact? Improving the fit of a model (best fit model) model addition of more parameters improvements of likelihood values increased complexity more difficult estimation of evolutionary histories: better “good” than “exact”! potential optimum
Substitution models 3. What applications rely on best fit models? Estimation of branch lenght; alteration of the inference of mutational changes interpretation of inferred tree!!! 4. … if a model is wrong? Underfitting vs. overfitting topological errors, poor branch lenght estimation Underfitting long-branch attraction !! (inadeguate taxon sampling coupled with faster mutation rate in some lineages) Overfitting too many non-essential parameters: unjustified use of the most complex models available to maximize the fitness of the model to the data.
In statistics and machine learning, one of the most common tasks is to fit a "model" to a set of training data, so as to be able to make reliable predictions on general untrained data. In overfitting, a statistical model describes random error or noise instead of the underlying relationship. Overfitting occurs when a model is excessively complex, such as having too many parameters relative to the number of observations. A model that has been overfit has poor predictive performance, as it overreacts to minor fluctuations in the training data. The possibility of overfitting exists because the criterion used for training the model is not the same as the criterion used to judge the efficacy of a model. In particular, a model is typically trained by maximizing its performance on some set of training data. However, its efficacy is determined not by its performance on the training data but by its ability to perform well on unseen data. Overfitting occurs when a model begins to "memorize" training data rather than "learning" to generalize from trend. As an extreme example, if the number of parameters is the same as or greater than the number of observations, a simple model or learning process can perfectly predict the training data simply by memorizing the training data in its entirety, but such a model will typically fail drastically when making predictions about new or unseen data, since the simple model has not learned to generalize at all. Wiki
Substitution models the parameters θ, τ and ν affect the calculations but do need not to be estimated
Substitution models 5. How are models selected for nucleotides? Likelihood value describe the fit of a model to the data. 1) 2) 3) LRT (Likelihood ratio test): comparison of nested candidate models (L 0 vs. L 1) maximised likelihood estimates and resonable topology – hypothesis testing, p-values for significance (in Model. Test, now in JModeltest) AIC (Akaike Information Criterion): similar to LRT, NO hypothesis testing, p-values for significance BIC (Bayesian Information Criterion): use of model priors (penality term BIC>AIC)
Substitution models * AKAIKE INFORMATION CRITERION (AIC) Model selected: Model = TIM 2+I+G partition = 010232 -ln. L = 8774. 9764 K = 462 freq. A = 0. 1971 freq. C = 0. 3088 freq. G = 0. 2626 K: number of free parameters of the model. AIC accounts for the overfitting the lowest AIC score will be the best choice to maximize the trade-off between goodness of fit and precision of parameters estimates. freq. T = 0. 2315 R(a) [AC] = 1. 7566 R(b) [AG] = 3. 8010 R(c) [AT] = 1. 7566 R(d) [CG] = 1. 0000 R(e) [CT] = 6. 3178 R(f) [GT] = 1. 0000 p-inv = 0. 1600 gamma shape = 0. 9310 High substitution rate fast divergence of two sequences Each position has own substitution rate among site rate variation Codon substitution model
Likelihood ratio test Always ≥ 0!! l 1 = maximum log likelihood under the parameter-richer, more complex model (alternative hypothesis) l 0 = maximum log likelihood under the less parameter-rich, simpler model (null hypothesis). Value of LRT is significantly large the inclusion of additional parameters in the alternative model increases the likelihood of the data significantly the use of the more complex model is favored Bayesian information criterion K: number of free parameters of the model. n: alignment size The smaller the BIC, the better the fit of the model to the data. Given equal priors for all competing models, choosing the model with the smallest BIC is equivalent to selecting the model with the maximum posterior probability. Because with standard alignments the natural log of n is usually >2, the BIC tends to choose simpler models than the AIC.
ML Estimation of a certain phylogenetic hypothesis according its probability tree with highest probability is preferred ML methods assume that each site in the alignment evolves independently. Contrasting hypotheses sequences in alignments (D) and trees (H) P(D|TREE) = L -log. L Markov-process: the likelihood that the next change depends only from the present state (independent from previous changes) memoryless
ML Markov-chains: stocastic (random determined) process which happen in chains according the Markov-process (e. g. 4 states for DNA, 20 states for amino acid). Branch lenght dependent of long evolutionary time OR high substitution rate. Substitution rate is constant across all the taxa molecular clock time is responsible for branch lenght.
ML ML: estimate of a phylogeny is the tree for which the observed data are most probable (data= aligned DNA sequences for n taxa) finding edge lengths that maximize the likelihood given a particular topology to find a tree topology that maximizes the likelihood stepwise-addition algorithm: An initial tree is created by starting with three randomly chosen taxa only one possible topology for a set of three taxa a fourth randomly chosen taxon is attached, in turn, to each branch of the initial tree the tree with the highest score is used as the starting tree for adding a fifth randomly chosen taxon.
Hill-climbing algorithms Arbitrary solution to a problem incrementally change of single element better solution (? ) repeated until no better solution is found They are RECURSIVE!!!
Molecular phylogeny ASSESS A PHYLOGENETIC HYPOTESIS: how well does the tree represent all the underlying data? Resampling: bootstrap and jackknife multiple, random and Is not a measure of how accurate is independent resampling of the original data. our tree! if data are biased we Variation of the replicates bootstrap matrix could have high support for an Jackknife: during the replicates a certain amount of characters incorrect tree are deleted
Bootstraping (bs): offers a measure of how much the data support the relationships depicted in the tree; generation of pseudo-replicates (resampling) Cut-off: usually > 70% , also as prediction of recovering the same results if more data are added. High bs necessary but not sufficient for confidence.
Bootstrap