Molecular orbital MO theory An analogy between light
 theory")
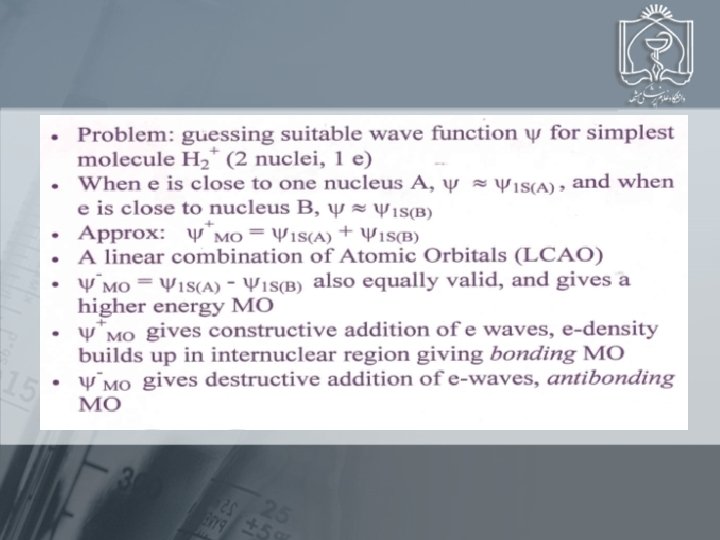
Molecular orbital (MO) theory
 used to describe electron")
An analogy between light waves and wave functions ( ) used to describe electron waves from interacting atomic orbitals. NOTE: +/- signs show PHASES of waves, NOT CHARGES! A B Amplitudes of wave functions added A + B B A Amplitudes of wave functions subtracted. A - B

A B In phase 1 SA + 1 SB = bonding MO Out of phase 1 SA- 1 SB = antibonding MO 1 S *1 S
 in H 2.")
Contours and energies of the bonding and antibonding molecular orbitals (MOs) in H 2. Axially symmetric OUT OF PHASE E-density = blue IN PHASE Axially symmetric H Atomic orbitals Molecular orbitals of H 2

The MO diagram for H 2 # ANTIBONDING e’s = 0 # BONDING e’s = 2

2 H. H: H
 Theory ANTBONDING These two new orbitals have different energies. BONDING The")
Moleculuar Orbital (MO) Theory ANTBONDING These two new orbitals have different energies. BONDING The one that is lower in energy is called the bonding orbital, The one higher in energy is called an antibonding orbital.

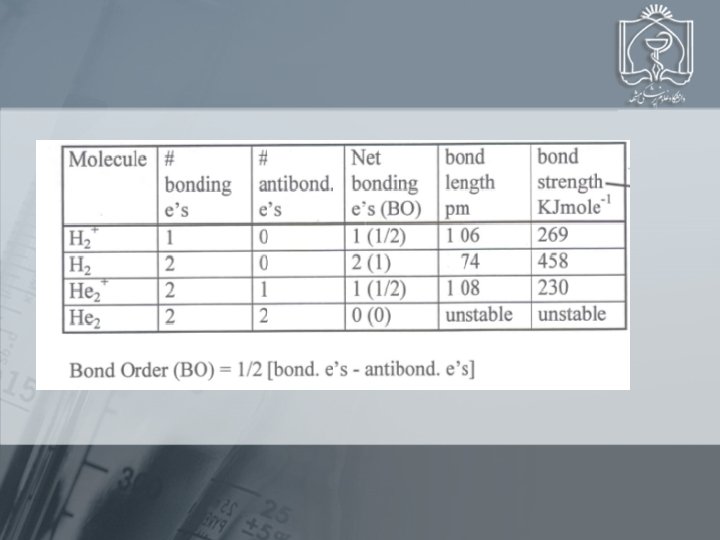
MO diagram for He 2+ and He 2 *1 s 1 s 1 s Energy *1 s 1 s 1 s AO of He MO of He+ 1 s AO of He+ He 2+ bond order = 1/2 AO of He MO of He 2 AO of He He 2 bond order = 0 He 2 does not exist!

x y . z z y . x Note that “z” is the internuclear direction Axial symmetry means bond Non-axial symmetry means bond Bonding/antibonding combinations of the three p atomic orbitals

Relative MO energy levels for Period 2 homonuclear diatomic molecules. without big 2 s 2 p repulsion MO energy levels for O 2, F 2, and Ne 2 with big 2 s-2 p repulsion MO energy levels for B 2, C 2, and N 2
-E(2 s): N 12. 4 e. V O 16. 5 e. V F")
E(2 p)-E(2 s): N 12. 4 e. V O 16. 5 e. V F 31. 6 e. V For N: “small” 2 p/2 s separation “big” *(2 s) / (2 pz) repulsion
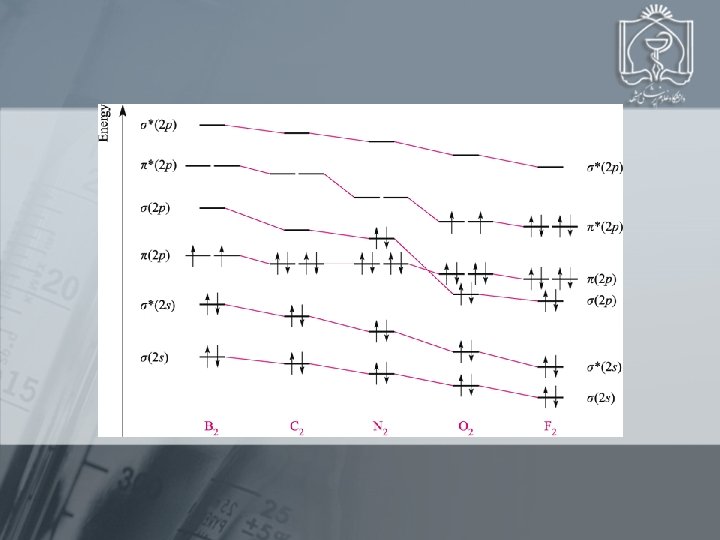

Bond order MO occupancy and molecular properties for B 2 through Ne 2 1 2 3 2 1 0

Using MO Theory to Explain Bond Properties PROBLEM: As the following data show, removing an electron from N 2 forms an ion with a weaker, longer bond than in the parent molecules, whereas the ion formed from O 2 has a stronger, shorter bond: N 2 + O 2 + Bond energy (k. J/mol) 945 841 498 623 Bond length (pm) 110 112 121 112 Explain these facts with diagrams that show the sequence and occupancy of MOs. N 2 loses 2 p bonding e O 2 loses *2 p antibonding e

The MO diagram for HF Energy Two non-bonding orbitals are the lone pairs on F seen in The Lewis structure for HF 1 s Note the H 1 S is less stable than the F 2 P 2 px 2 py 2 p AO of H MO of HF AO of F

The MO diagram for NO PARAMAGNETIC 1 unpaired e *2 pz Energy *2 pxy 2 p 2 p 2 pz 2 pxy Note AO’s of the more electronegative O are More stable than those of N *2 s 2 s AO’s of N 2 s 2 s MO of NO AO’s of O
- Slides: 19