Molecular Epidemiology Biomarkers II Emerging Technologies and Validity
: Emerging Technologies and Validity and Confirmation of Association Ioanna Tzoulaki")
Molecular Epidemiology Biomarkers (II): Emerging Technologies and Validity and Confirmation of Association Ioanna Tzoulaki itzoulak@cc. uoi. gr With thanks to David C. Muller and Marc Gunter for developing much of this material

Learning Outcomes • Understand the importance of newly emerging technologies that are being currently applied in population-based study designs • Describe the application of newly emerging ‘omics’ technologies in molecular epidemiology research • Understand some of the major issues relating to the generation and analysis of high-density molecular data • Understand that biomarker studies often lead to the generation of high density data sets and are prone to false positive/negative findings • Understand that the false discovery rate is an important concept for molecular epidemiology research and the design of studies that limit its impact is an important issue for researchers

Limitations of current biomarker studies • Some markers are not very reliable (e. g. high interlaboratory variation for adducts) • Biological meaning not always clear (e. g. mutations in plasma DNA) • Long gap between marker development and its validation • Time relationships between exposure, marker measurement, disease • Usually one spot biosample available (little is known on intra-individual variation) • Little is known on potential confounders

Emerging Biomarkers in Epidemiologic Research • Until recently most molecular epidemiologic research was restricted to assessment of several individual biomarkers in relation to particular exposure/endpoint. • Major developments in molecular biology and technologies (and decreasing costs) have enabled measurement of hundreds and thousands of biological measurements in high throughput manner. . ’omics’ • Presents new challenges to epidemiologists and statisticians

Emerging Biomarkers in Epidemiologic Research • Only tiny fraction of all information obtained from ‘omics’ analyses likely to have relevance to end-point under study • Sorting out signal from noise is major focus. . . ’datamining algorithms’. . test-retest procedures • Deviation from hypothesis-driven research -> agnostic/data-driven research

Examples of Biomarkers of Exposure and Effect Biomarker Type Biomarker Category Examples Carcinogens and their metabolites Exposure-internal dose Urinary biomarkers (e. g. aflatoxins, tobacco-specific nitrosamines); faecal Nnitroso-compounds, blood lead levels Nutrients Urinary sugars, flavinoids, serum vitamins Circulating antibodies Hepatitis B, HPV DNA Adducts Exposure-biologically effective dose Protein Adducts Genetic Alterations Bulky DNA adducts, DNA strand breaks Amino-biphenyl Hb; aflatoxin albumin Biomarkers of Effect Chromosomal aberrations, somatic cell mutations Altered Proteins Altered growth factors (e. g. IGF-I) cytokines Altered Gene Expression Lymphocyte CYP 1 A 1 expression, microarray

“Omics” Technologies Newly emerging high throughput technologies generate hundreds, thousands, millions of data points……significant amount of noise and statistical headaches
 • More")
Advantages of -omics • Quantitative rather than discrete markers (e. g. genotype) • More strictly related to the phenotype • More accurate representation of geneenvironment interactions? • High-throughput methods, large numbers of molecules measured in small amounts of biological material
 102 ABI Taq. Man ABI")
Progress in Genotyping Technology Cost per genotype (Cents, USD) 102 ABI Taq. Man ABI SNPlex 10 Illumina Golden Gate Affymetrix 10 K Affymetrix Meg. Allele Illumina Infinium/Sentrix 1 Perlegen Affymetrix 100 K/500 K 1 10 2001 102 103 104 105 2005 106 # SNPs
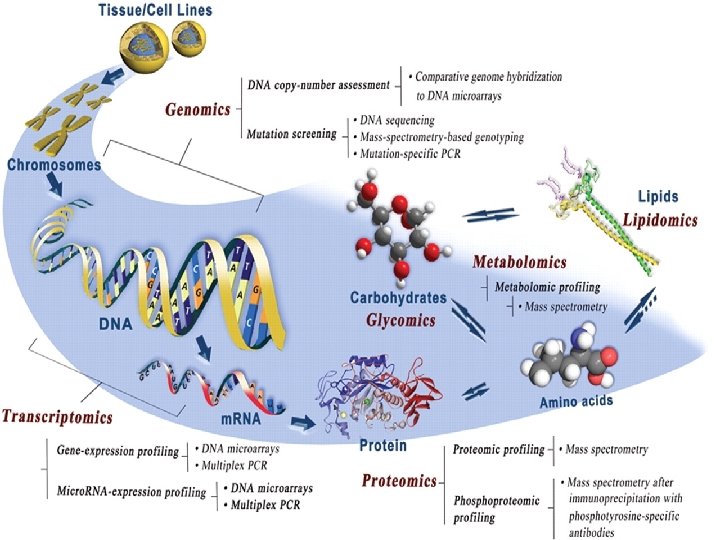
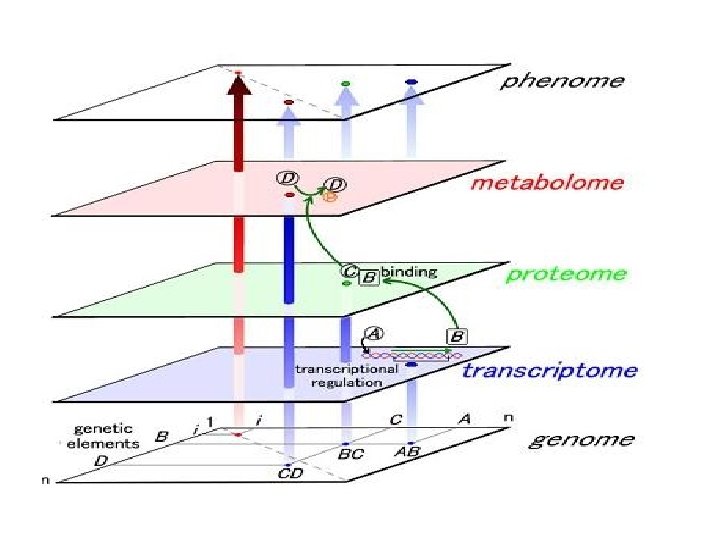

Definition of “Omics” Terms • Genome. The complete set of genetic material of a cell or organism. • Genomics The study of the genome. • Proteomics The study of the entire set of proteins in a cell or organism. • Metabolomics The study of the complete set of low-molecular weight metabolites in a cell or organism at any one time.
 • Transcriptome. All the m. RNAs produced by a cell or")
Definitions (cont. ) • Transcriptome. All the m. RNAs produced by a cell or a population of cells. This is the total expression of the genes in that cell or population of cells. • Proteome The entire set of proteins expressed in a cell or population of cells (coded for by the RNA)
 • Epigenetics Changes in gene expression that are NOT due to")
Definitions (cont. ) • Epigenetics Changes in gene expression that are NOT due to changes in DNA sequence. • Epigenetic changes include methylation of DNA (which represses gene expression), acetylation of histones (which enhances gene expression), and micro-RNAs (22 -base RNAs). • Dietary components, air pollution, lifestyle, etc. cause epigenetic changes in our genome. • Nutrigenomics. The study of the interaction of diet and the genome—and the consequent health outcomes of that interaction.

‘OMICS’ Technologies Technology Molecular Target Temporal Variance Influence by Disease Genotyping DNA None No Epigenomics DNA/ histones RNA Low/Moderate Probable High Yes Proteins High Yes Gene expression Proteomics Metabolomics Small molecules

The Exposome Rappaport & Smith Science 330: 460, 2010

Example: Envirogenomarkers Study

‘Meet in the Middle’ Approach to Biomarker Identification

Proteomics • Describes protein expression on global scale • Discover modified proteins, affected pathways -> biomarker development and disease prediction • More complex than nucleic acid measurement • Defining identities and quantities of entire proteome challenging

Proteomics • Sample complexity – About 25 K types of protein coding-genes present in human. IPI human database (v 3. 25) has 67, 250 entries, which could generate about 106 -8 peptides – More than one hundred post translational modifications (PTMs) could happen in a proteome • Large protein concentration difference – 107 -8 in human cells, and at least 1012 in human plasma – Dynamic range of a LC-MS is about 104 -6 • The top 12 high abundant proteins constitute approximately 95% of total protein mass of plasma/serum – Albumin, Ig. G, Fibrinogen, Transferrin, Ig. A, Ig. M, Haptoglobin, alpha 2 -Macroglobulin, alpha 1 -Acid Glycoprotein, alpha 1 Antitrypsin and HDL (Apo A-I & Apo A-II). • Dynamic system, large intra-individual variation

Biomarkers identified using Transcriptomics/Proteomics Biomarker Type Identification Condition KIM-1 DNA microarray Renal toxicity Adipsin DNA microarray GI toxicity CXC chemokines SELDI Benzene Exposure Troponin I 2 D gel-MS Myocardial infarction Annexin A 1 2 D gel-MS Radioimmunotherapy 12 lipid gene signature DNA microarray Drug-induced lipidosis Multigene blood signature DNA microarray Systemic sepsis
 or gene")
Epigenetics • Epigenetics is the study of inherited changes in phenotype (appearance) or gene expression caused by mechanisms other than changes in the underlying DNA sequence. • These changes may remain through cell divisions for the remainder of the cell's life and may also last for multiple generations. • Changes in gene expression that do not involve alterations in DNA base sequence

Are genes our destiny?

Epigenetics • Epigenetic mechanisms are regulatory mechanisms that regulate the gene expression • Epigenetics plays a role in cell development by establishing and maintaining the gene expression programs necessary, according to the unique functional roles of the cell • Recently, growing interest in link between epigenetic changes and complex human diseases

Molecular Basis of Epigenetics • Three primary mechanisms identified: 1. Modification to histone proteins (acetylation, methylation and phosphorylation) 2. Methylation of cytosine nucleotides in DNA 3. Posttranscriptional regulation by non-coding RNAs

Epigenetic Modification: DNA Methylation • ~4% of cytosines are methylated • 70% - 80% of Cp. G cytosines are methylated • Expected Frequency of CG = 4. 4% • Actual Frequency of CG = 1% • ~60% of genes have Cp. G island promoters, typically unmethylated • DNA methylation represses transcription directly (inhibits TF binding) • DNA methylation represses transcription indirectly by recruiting Me-Cp. Gbinding proteins
 • The idea behind EWAS is to systematically study all")
Epigenome-wide association study (EWAS) • The idea behind EWAS is to systematically study all epigenetic marks in relation to a trait or disease • EWAS are now very active, testing a wide variety of human diseases and other phenotypes • The most studied epigenetic mark is DNA methylation

DNA methylation and Cp. G • Methylation happens where a cytosine is followed by a guanine (Cp. G site) • The exact number of Cp. Gs in human cells is unknown, potentially tens of millions

Cp. G sites and Cp. G island • Cp. G sites are not randomly distributed in genome • Cp. G islands are regions of genome with high density of Cp. Gs (>60%) • Cp. G islands are mainly in the promoter region of genes • Cp. G islands are normally not methylated

Epigenetics and Cancer • Growing data on the importance of epigenetics in the aetiology and pathogenesis of cancer 1. DNA methylation • Gene specific hypermethylation (eg RASSF 1, MLH 1) • Genome-wide hypomethylation (4% down to 2 -3% of all cytosines) 2. Histone Modifications • Active vs Inactive histone marks • Polycomb group gene silencing (H 3 -K 27 -me 3) Cancer Epigenetics Paradox: Global Loss of DNA methylation in addition to locus-specific gain in methylation are causally linked to human cancer Many cancer risk factors cause epigenetic modifications

Epigenetics and The Environment • Epigenetic changes can be inherited mitotically in somatic cells • Pre-natal and early post-natal exposures can result in changes in risk of developing disease • • Nutrition Xenobiotic chemicals Behavioural Factors Reproductive Factors, Hormonal Exposures • Epigenetic alterations may also be inherited transgenerationally (developmental origins of adult-onset disease)

Epigenetics and The Environment • –Prenatal environment • Famine exposure, Folic acid use (Tobi et al HMG 2009, Steegers-Theunissen et al Plos One 2009) • –Adult methylome • • Smoking, Diet (Breitling AMHG 2011, Zhang Journal of Nutrition 2010) • –Cancer methylome • • Alcohol and folate (Christensen et al Plos genetics 2010) • –Methylation variability between monozygotic twins increases with age (Fraga et al PNAS 2005)

Epigenetics and disease Evidence for the link between epigenetic and disease: 1. Complex disorders are not the same in monozygotic twins. 2. Research on SLE and Autism has indicated the role of epigenetic 3. The incidence of several complex diseases (T 1 DM) is rising, especially in migrant populations 4. A suboptimal in utero or early childhood environment impacts disease risk (e. g. T 2 DM) in adulthood (developmental reprogramming)

Epigenetics: consequence or cause of disease • Epigenetic changes associated with the diseases could be the cause or the consequence • Its important to know since it will affect the potential utility of the findings in terms of diagnostics or therapeutics

How to measure DNA methylation? • Various techniques are available • Sequencing-based technologies are optimal, • Array-based methods are currently the most common method • Formerly 450 K, nowadays 850 K

How to describe methylation in EWAS • Methylation states can vary over cells within a tissue, over alleles within a cell and, in rare cases, over DNA strands within an allele • For a sample from one individual, the methylation state measured at a Cp. G site varies. • The mean percentage of methylation at this Cp. G site is expressed as Beta value (β) • Beta value (β) is a number between zero and one (an average over cells, alleles and strands)

Study designs for EWAS • Cross-sectional or Case–control • The most common approach • Case-control for diseases and cross sectional for continuous traits • Unrelated individuals are recruited • Sample availability is good

Study designs for EWAS • Twins • Monozygotic twins who are discordant for a disease of interest represent a useful resource for EWAS • Different epigenetic mark pattern are not due to genetic differences • Causal inference could not be made unless the twins are recruited longitudinally (resources available but limited)

Study designs for EWAS • Parent–offspring pairs • To identify trans-generational transmission of epigenetic marks • If paternal environment influences phenotypic outcomes in the offspring • Epigenomic profiling is done in parents and offspring to identify the altered loci • Profiling methods that are able to detect allele-specific methylation are needed • The study should be adequately powered and will need to have reliable measures of parental environmental exposures

Study designs for EWAS • Longitudinal cohorts • • • Recruit disease-free people (ideally from birth), Biological samples are taken once or repeatedly Exposures and disease events are recorded over time Longitudinal cohorts are expensive but are available Compared to case-control design, the confounding due to differences in the recruitment and measurements of cases and controls are less

Confounding in EWAS • In case-control design, there is a risk of systematic differences between handling or processing of cases and controls (Technical confounding) • Confounding can arise because the ancestry of cases differs systematically from that of controls (Population structure or cryptic relatedness) • Environmental factors can also directly confound an EWAS by affecting both epigenotype and phenotype (Conventional confounding)

Adjustments in EWAS • Potential confounders, such as age and smoking, should be adjusted for in the base model • Adjustment for principle coordinates of genome-wide methylation states may help to diminish confounding • If GWAS data are available, it may be appropriate to adjust for leading principle coordinates of genetic states

Reverse-causation in EWAS • Epigenetic differences between cases and controls could be the cause or consequence of the diseases • Distinguishing between the two processes presents a major challenge for EWAS

Choice of tissue for EWAS • Disease-associated epigenetic variation can be tissue-specific. • Large epidemiologic studies have access to certain tissues, such as blood, buccals, saliva, hair follicles, urine and faeces. • Tissue access is a major challenge in large scale EWAS (generalizability is always questioned)

Cell type considerations for EWAS • All tissues are composed of multiple cell types (for example, blood contains >50 distinct cell types). • Epigenetic patterns vary substantially across different cell types • Cell type composition is affected by: 1. Exogenous factors e. g. , smoking, diet, and medication 2. Endogenous factors e. g. , senescence 3. Pathogenic factors e. g. , inflammation, toxication

Cell type considerations for EWAS • If the association is restricted to a certain cell type that represents only a small proportion of the tissue sampled, then the association may not be detected. • The disease state itself can also alter the composition of cell types in a tissue, thus, the measured epigenetic differences between cases and controls may only reflect differences in cell-type composition and not true epigenetic differences. • Cell type heterogeneity should be considered in design and analysis of EWAS

Statistical considerations for EWAS • Significance thresholds • Multiple testing needs to be addressed in EWAS • Cp. Gs are correlated with each other in small regions but the patterns are not well studied (few kbs) • If a set of 500 K Cp. G sites was evenly spaced, the average spacing between sites may be large enough to allow an assumption of independence. • Based on Bonferroni correction, for epigenome-wide significance 0. 05 should be divided by the number of Cp. Gs (Typically between 10− 8 and 10− 7)

Statistical considerations for EWAS • Sample size and power • EWAS are demanding studies due to their higher significance threshold compared to classic epidemiologic studies • Most studies need hundreds or thousands of samples • By increasing the sample size, the number of Cp. Gs that could be identified are increased

Replication for EWAS • The function of hypothesis-free EWAS is hypothesis generating. • Replication is needed for all agnostic approaches • In epidemiologic studies replication is asked to be done in an independent sample

Replication for EWAS • The primary study needs to be well-powered i. e. researchers should not put samples aside for replication! • Ideally, lack of resources for replication should not preclude publication, but the need for further confirmation of results should be acknowledged. • Lookup with related phenotypes, and lab experiments are other approaches to validate the findings

Diet and gene promoter methylation in smokers
")
Dietary Folate Deficiency Causes Hypomethylation in Human Lymphocytes 1 - 3 H-Methyl Acceptance (%) 100 Jacob et al J. Nutr. 128: 1204, 1998 50 0 6 Day of Depletion 69

Smoking intensity is directly correlated with hypomethylation at AHRR and 2 q 37. 1 AHRR 1 x 10 -7 1 x 10 -5

P=0. 007 AHRR methylation seems to be a good marker of past exposure to smoking.

Dutch Hunger Winter 1944 -1945 • Famine in The Netherlands towards the end of WWII-caused by Nazi occupation (blockade) and severe winter; led to severe malnutrition in Dutch population • Dutch Famine Birth Cohort Study-prospectively studies offspring of mothers who were exposed to the famine • Offspring shown to be increased risk of diabetes, obesity, CVD • Offspring were smaller than those born to non-exposed mothers and then the children of these offspring were also, on average, smaller • Suggestive of transgenerational inheritance-epigenetics

Difference in DNA methylation of Cp. G dinucleotides in siblings discordant for periconceptional exposure to famine. • 60 individuals pre-natally exposed to famine compared with matched, unexposed siblings • Investigated several genes involved in metabolism • Positive difference indicates higher methylation level among exposed individuals Tobi E W et al. Hum. Mol. Genet. 2009; 18: 4046 -4053

Challenges for Biomarker Studies in the ‘Omics’ Era 1. Precious and limited biobanked material, not easily accessed 2. Single (spot) biological samples 3. Usually blood, not urine (which may be better e. g. for metabolomics) 4. No cohorts allow life-course epidemiology 5. In-depth exposure assessment is limited by feasibility 6. Lab measurements and omics have the same limitations related to sample size and feasibility 7. Biostatistical approaches and causal interpretation 8. Ethical issues

Threats to the Validity of Molecular Epidemiology Studies • Bias-systematic error • Information Bias (imprecision in measurements) • Confounding • Statistical Issues • Over-emphasis on P-values • Multiple Comparisons • Association ≠ Causation

Multiple Comparison Problem in ‘Omics’ studies Normal Disease Gene by gene 2 -tailed t-test; P<0. 05 significant

Multiple Comparison Problem in ‘Omics’ studies Normal Disease Conclude: Gene 16 associated with disease

Multiple Comparisons • However…. need to consider the number of tests performed-P<0. 05 means we accept the risk of erroneously rejecting H 0 in 5% of the cases (i. e. willing to accept 5% false positives) • Each comparisons carries a 5% error probability so if we perform 20 tests, likely to detect 1 false positive • The association between gene 16 and disease may be real but we do not have sufficient data to make that claim

Probability of ≥ 1 False Positives by Chance If set P-value at <0. 05 # Genes tested (N) Incidence False Positives Probability of detecting ≥ false +ves 1 1/20 5% 2 1/10 10% 20 1 64% 100 5 99. 4% 100(1 -0. 95 N)

Probability of Error and Number of Comparisons

Expected Number of Errors and Number of Comparisons

Multiple Comparison Problem in ‘Omics’ studies • On the ‘omics’ scale problem is magnified. . • ~10, 000 genes on an array • Each gene-disease association has 5% chance of being false positive (Type I error) • So by chance alone, we should detect 500 significant associations…. .

Sources of Multiple Comparisons Source Example Multiple outcomes a cohort study looking at the incidence of breast cancer, colon cancer, and lung cancer Multiple predictors an observational study with 40 dietary predictors or a trial with 4 randomization groups Subgroup analyses a randomized trial that tests the efficacy of an intervention in 20 subgroups based on prognostic factors Multiple definitions for the exposures and outcomes an observational study where the data analyst tests multiple different definitions for “moderate drinking” (e. g. , 5 drinks per week, 1 drink per day, 1 -2 drinks per day, etc. ) Multiple time points for the outcome (repeated measures) a study where a walking test is administered at 1 months, 3 months, 6 months, and 1 year Multiple looks at the data during sequential interim monitoring a 2 -year randomized trial where the efficacy of the treatment is evaluated by a Data Safety and Monitoring Board at 6 months, 1 year, and 18 months

Correction for Multiple Comparisons • Major research issue for biostatisticians…debate as to the best approach • Traditional methods for controlling for multiple testing such as Bonferroni correction (α/n) may be too conservative (↑ false negatives) • False discovery rate (FDR; Benjamin-Hochberg Test) now more commonly applied to ‘omics’ data sets
 Q is set to be 0 when R=0 FDR =")
False Discovery Rate (FDR) Q is set to be 0 when R=0 FDR = expectation of Q = E(V/R; R>0) Benjamin-Hochberg Test (rank all P-values)

Two-Stage Study Designs • Most widely accepted designs for ‘omics’ studies now…. • Discovery (training set): large sample size, identify discoveries (FDR) • Validation (test set): independent from discovery set
 Site 1 (100) Benign (50) Discovery")
Study design for biomarker discovery Stage I/II (20) Site 1 (100) Benign (50) Discovery 1 Control (30) Cross Comparison Stage I/II (35) Site 2 (176) Stage III/IV (2) Benign (90) Candidate Markers Discovery 2 Fitted Models Control (49) Site 3 (164) Model Derivation (multiple markers) Stage I/II (35) Stage III/IV (103) Benign (26) Independent Validation Site 4 (63) Control 63 Protein ID Ca (41) Other Ca 1 (20) Site 5 (142) Other Ca 2 (20) Other Ca 3 (20) Control (41) Independent Validation by Immunoassay Results: • Descriptive statistics • Two-group t-tests • Performance • ROC curve analysis

Working Solutions • Data analysis in ‘omics’ studies is challenging…. • Control for multiple testing is a necessity • The Gold Standard is biological replication • Training Sets and test sets should have no members in common • Set up design as rigorously as possible (in advance) • Training sets are proof of principle • Test sets are, theoretically, validation
 epidemiologic data 1. Analyses are exploratory. The authors")
Factors to consider in evaluating (molecular) epidemiologic data 1. Analyses are exploratory. The authors have mined the data for associations rather than testing a limited number of a priori hypotheses. 2. Many tests have been performed, but only a few p-values are “significant”. If there are no associations present, . 05*k significant p-values (p<. 05) are expected to arise just by chance, where k is the number of tests run. 3. The “significant” p-values are modest in size. The closer a p-value is to. 05, the more likely it is a chance finding. According to one estimate*, about 1 in 2 p-values <. 05 is a false positive, 1 in 6 p-values <. 01 is a false positive, and 1 in 56 p-values <. 0001 is a false positive. 4. The pattern of effect sizes is inconsistent. If the same association has been evaluated in multiple ways, an inconsistent pattern of effect sizes (e. g. , risk ratios both above and below 1) is indicative of chance. 5. The p-values are not adjusted for multiple comparisons Adjustment for multiple comparisons can help control the study-wide false positive rate.

Types of Validation for Biomarkers • Analytical validation • When there is a gold standard • Sensitivity, specificity • No gold standard • Reproducibility and robustness • Clinical validation • Does the biomarker predict what it’s supposed to predict for independent data • Clinical utility • Does use of the biomarker result in patient benefit • Depends on available treatments and practice standards
- Slides: 73