Module Micro 19 Econ 55 Firm Costs KRUGMANS


- Slides: 15

Module Micro: 19 Econ: 55 Firm Costs KRUGMAN'S MICROECONOMICS for AP* Margaret Ray and David Anderson

What you will learn in this Module: • The various types of cost a firm faces, including fixed cost, variable cost, and total cost • How a firm’s costs generate marginal cost curves and average cost curves

From the Production Function to Cost Curves The previous module covered the production function and diminishing returns. In the short run, there are variable inputs and at least one fixed input. To hire inputs for production, the firm will incur production costs which we represent with cost curves.

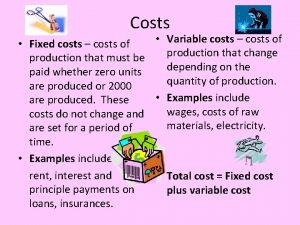
Total Costs • Fixed costs (FC) are costs whose total does not vary with changes in output. These are the payments to the fixed inputs in the production function. • Variable costs (VC) are costs that change with the level of output. These are the payments to the variable inputs in the production function. • Total cost (TC) is the sum of total fixed and total variable costs at each level of output. TC = FC + VC

Marginal cost • MC is the additional cost of producing one more unit of output. MC = ΔTC/ΔQ = Δ(VC + FC)/ΔQ = ΔVC/ΔQ

Average Cost • Average (AC) is the total cost divided by the level of output (it is also called average cost, unit cost, or per unit cost). ATC = TC/Q AVC = TVC/Q AFC = TFC/Q • Since TC = TFC + TVC, ATC= AFC + AVC

The relationship between MC and AC • The MC curve intersects the U-shaped ATC and AVC at their respective minimum points. • If the next (or marginal) value is above the average, it pulls the average up • If the next (or marginal) value is below the average, it pulls the average down.

Figure 55. 1 Total Cost Curve for George and Martha’s Farm Ray and Anderson: Krugman’s Economics for AP, First Edition Copyright © 2011 by Worth Publishers

Table 55. 1 Costs at Selena’s Gourmet Salsas Ray and Anderson: Krugman’s Economics for AP, First Edition Copyright © 2011 by Worth Publishers

Figure 55. 2 Total Cost and Marginal Cost Curves for Selena’s Gourmet Salsas Ray and Anderson: Krugman’s Economics for AP, First Edition Copyright © 2011 by Worth Publishers

Table 55. 2 Average Costs for Selena’s Gourmet Salsas Ray and Anderson: Krugman’s Economics for AP, First Edition Copyright © 2011 by Worth Publishers

Figure 55. 3 Average Total Cost Curve for Selena’s Gourmet Salsas Ray and Anderson: Krugman’s Economics for AP, First Edition Copyright © 2011 by Worth Publishers

Figure 55. 4 Marginal Cost and Average Cost Curves for Selena’s Gourmet Salsas Ray and Anderson: Krugman’s Economics for AP, First Edition Copyright © 2011 by Worth Publishers

Figure 55. 5 The Relationship Between the Average Total Cost and the Marginal Cost Curves Ray and Anderson: Krugman’s Economics for AP, First Edition Copyright © 2011 by Worth Publishers

Figure 55. 6 More Realistic Cost Curves Ray and Anderson: Krugman’s Economics for AP, First Edition Copyright © 2011 by Worth Publishers


