
Module 9 Part A Monitoring and Evaluation Image





- Slides: 41
Module 9 Part A: Monitoring and Evaluation *Image courtesy of: World Lung Foundation
Learning Objectives • Describe the difference between monitoring and evaluation • Explain why we monitor programmes • Explain how to monitor a TB programme – What to monitor – Principles and techniques • Describe how to conduct a supervisory visit
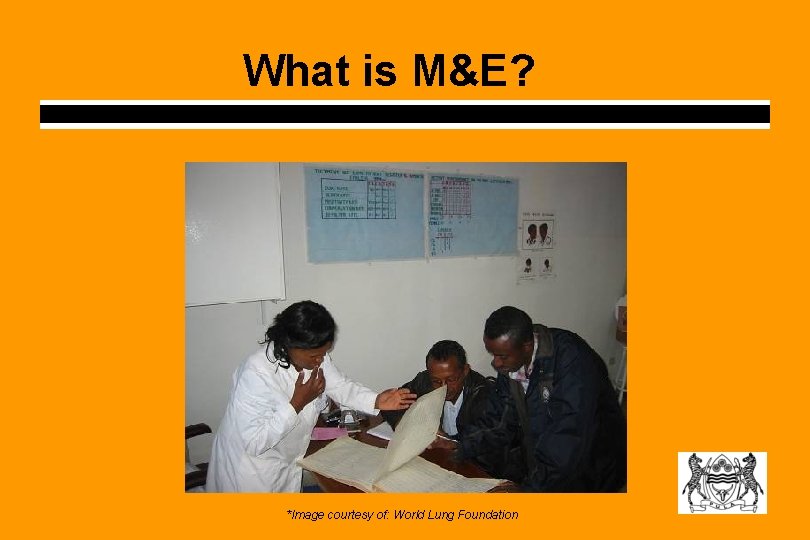
What is M&E? *Image courtesy of: World Lung Foundation
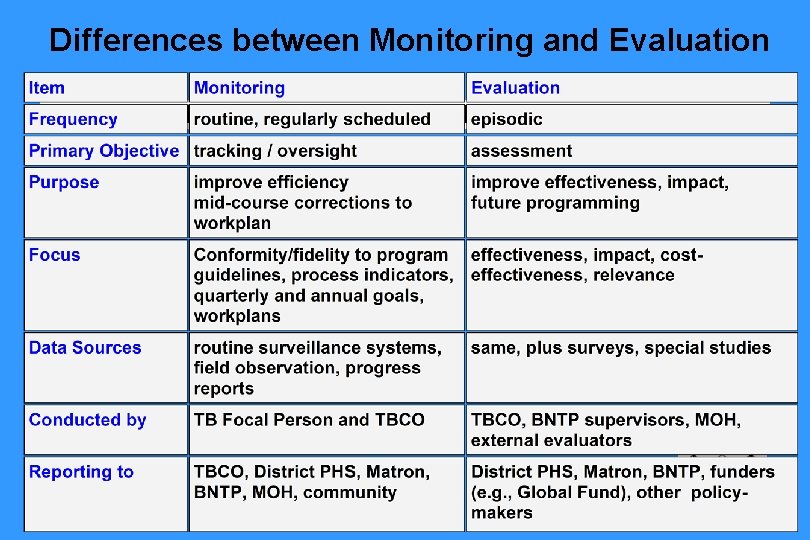
Differences between Monitoring and Evaluation
Why Monitor and Evaluate? 1. Collect accurate information about the TB Programme 2. Use that information to improve the TB Programme
Monitoring serves several purposes § § § Management Reporting Accountability Advocacy Evaluation
Why Evaluate? • Episodic assessment of specific indicators – determine effectiveness or impact of services or activities – during a given interval • Determine whether goals are being met • Assess impact of a specific service or intervention - HIV testing among TB patients • Advocacy
Benefit for BNTP • Determine if staff activities follow BNTP guidelines • Measure key indicators related to case detection, quality of diagnosis, and TB treatment • Identify problems in implementing TB control activities (e. g. , laboratory reporting delays) • Inform the annual evaluation of TB Programme • Use the findings to modify programme goals and strategies (e. g. , implementing RHT)
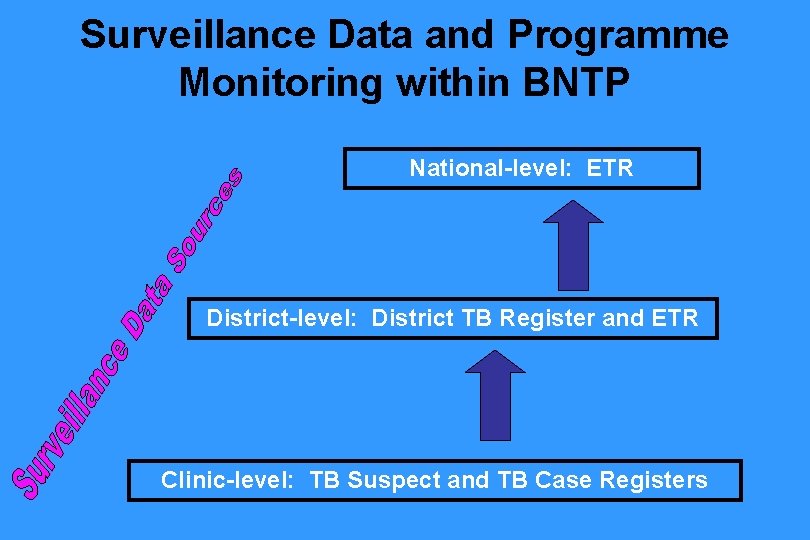
Surveillance Data and Programme Monitoring within BNTP National-level: ETR District-level: District TB Register and ETR Clinic-level: TB Suspect and TB Case Registers
How should I monitor?
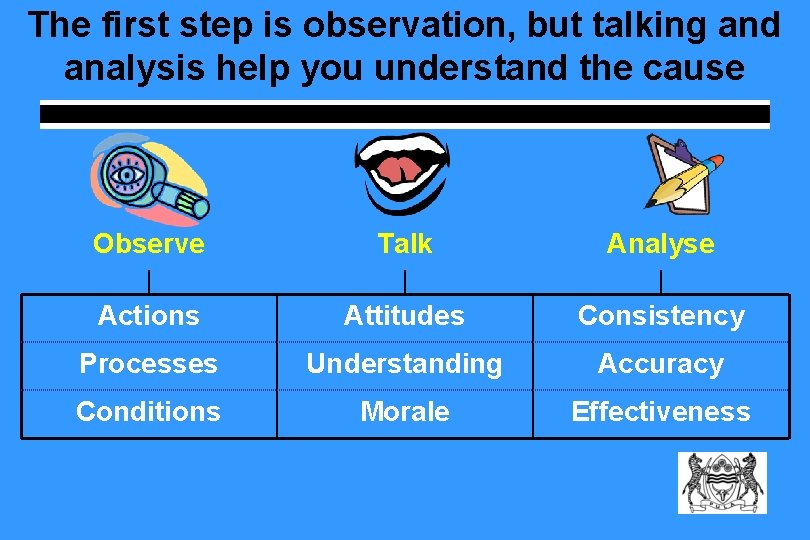
The first step is observation, but talking and analysis help you understand the cause Observe Talk Analyse Actions Attitudes Consistency Processes Understanding Accuracy Conditions Morale Effectiveness
Observe
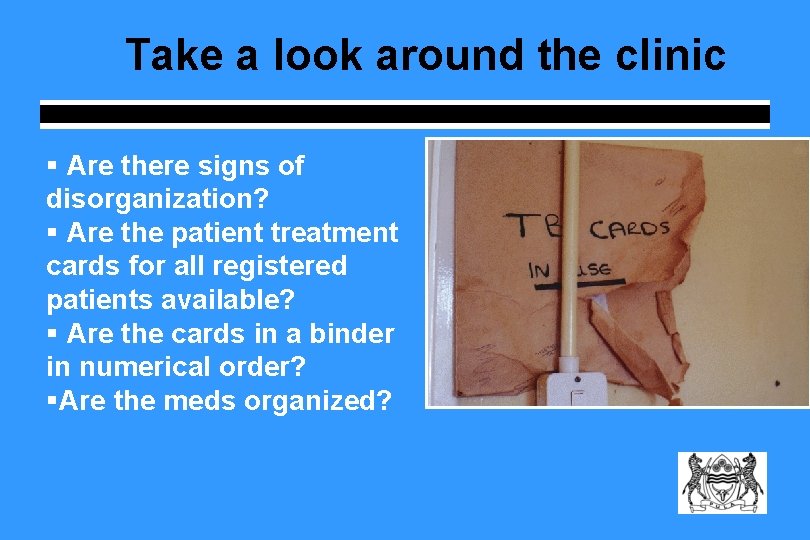
Take a look around the clinic § Are there signs of disorganization? § Are the patient treatment cards for all registered patients available? § Are the cards in a binder in numerical order? §Are the meds organized?
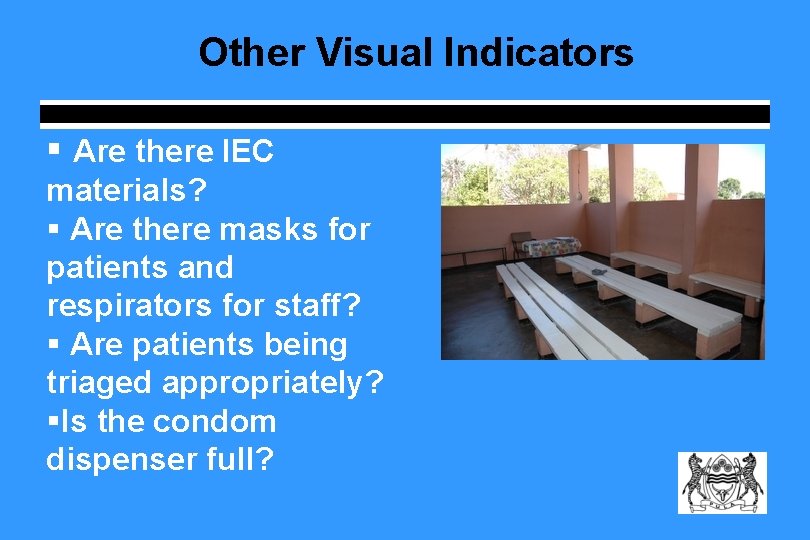
Other Visual Indicators § Are there IEC materials? § Are there masks for patients and respirators for staff? § Are patients being triaged appropriately? §Is the condom dispenser full?
Communication with Clinic Staff
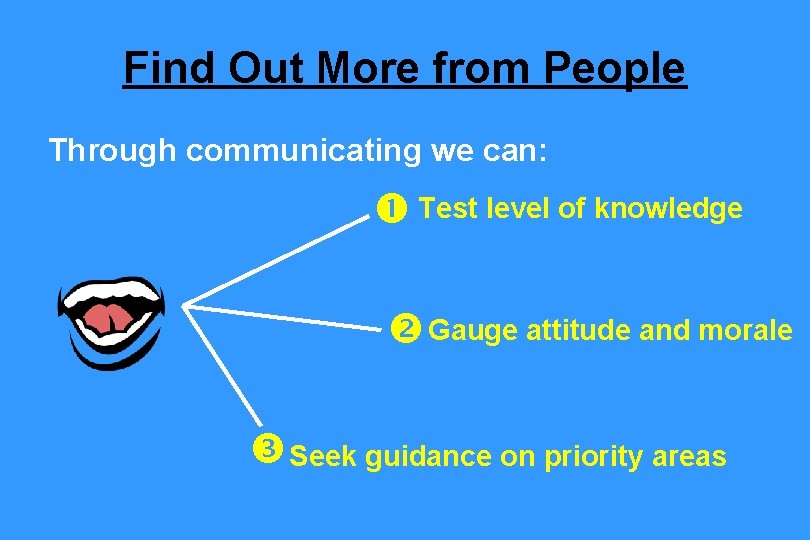
Find Out More from People Through communicating we can: Test level of knowledge Gauge attitude and morale Seek guidance on priority areas
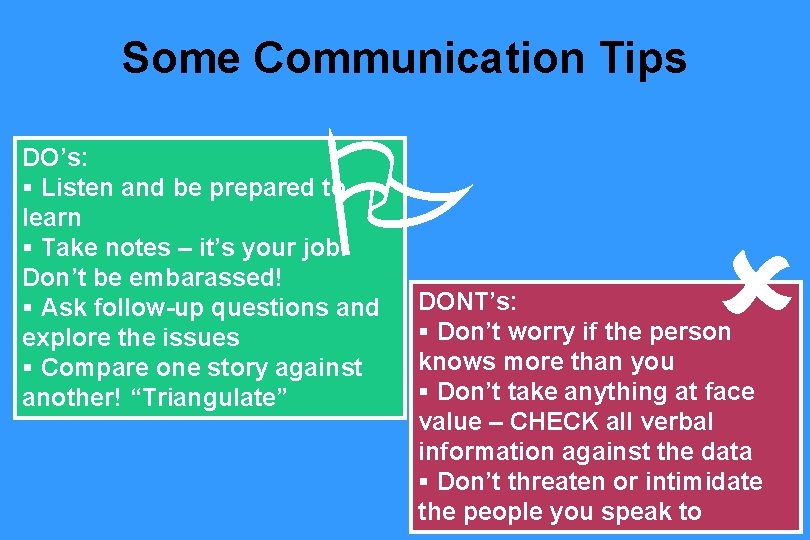
Some Communication Tips DO’s: § Listen and be prepared to learn § Take notes – it’s your job. Don’t be embarassed! § Ask follow-up questions and explore the issues § Compare one story against another! “Triangulate” DONT’s: § Don’t worry if the person knows more than you § Don’t take anything at face value – CHECK all verbal information against the data § Don’t threaten or intimidate the people you speak to
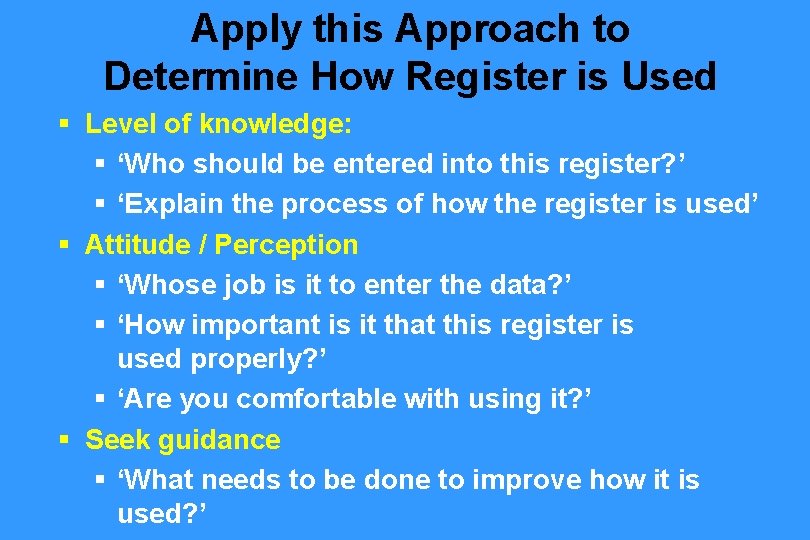
Apply this Approach to Determine How Register is Used § Level of knowledge: § ‘Who should be entered into this register? ’ § ‘Explain the process of how the register is used’ § Attitude / Perception § ‘Whose job is it to enter the data? ’ § ‘How important is it that this register is used properly? ’ § ‘Are you comfortable with using it? ’ § Seek guidance § ‘What needs to be done to improve how it is used? ’
Analysing the Suspect and Sputum Dispatch Register
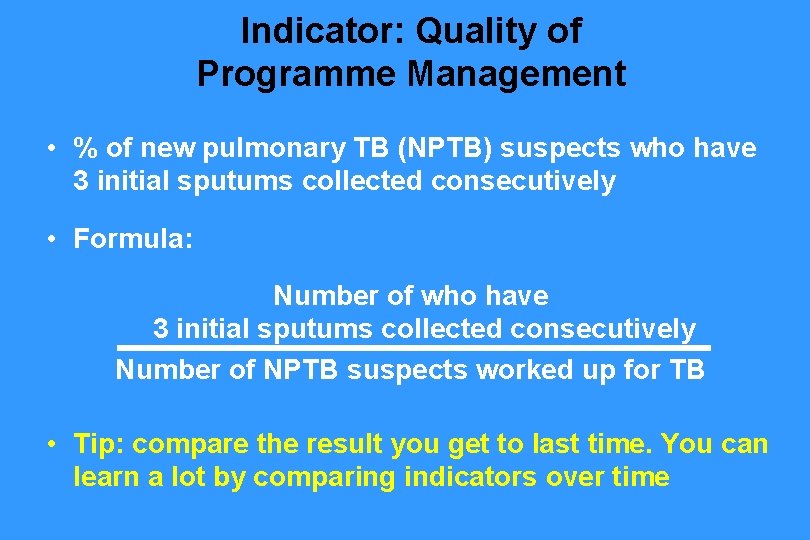
Indicator: Quality of Programme Management • % of new pulmonary TB (NPTB) suspects who have 3 initial sputums collected consecutively • Formula: Number of who have 3 initial sputums collected consecutively Number of NPTB suspects worked up for TB • Tip: compare the result you get to last time. You can learn a lot by comparing indicators over time
The TB Register
How does the data ‘look’? § Use your experience and common sense § Are the entries recorded correctly? – Proper chronological sequence – Proper identification of class and type § Are there signs that the register is being completed in “batches”? – Multiple entries on the same date with different treatment start dates (all in the same pen!)
Analysing the District TB Register § Recording and reporting § Calculating Indicators
How does the data ‘look’? § Use your experience and common sense § Are the entries recorded correctly – Proper chronological sequence – Proper identification of class and type § Are there signs that the register is being completed in “batches” – Multiple entries on the same date with different treatment start dates (all in the same pen!)
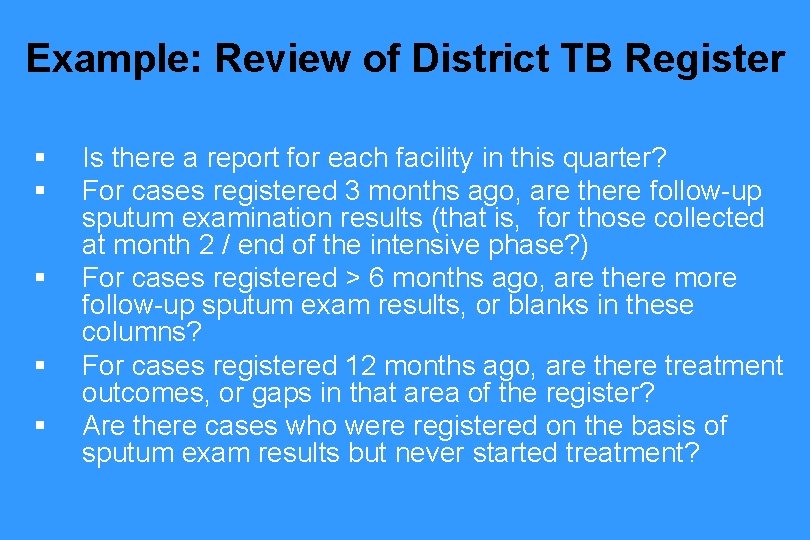
Example: Review of District TB Register § § § Is there a report for each facility in this quarter? For cases registered 3 months ago, are there follow-up sputum examination results (that is, for those collected at month 2 / end of the intensive phase? ) For cases registered > 6 months ago, are there more follow-up sputum exam results, or blanks in these columns? For cases registered 12 months ago, are there treatment outcomes, or gaps in that area of the register? Are there cases who were registered on the basis of sputum exam results but never started treatment?
Analysing the District TB Register via the ETR § Calculating Indicators § Recording and reporting
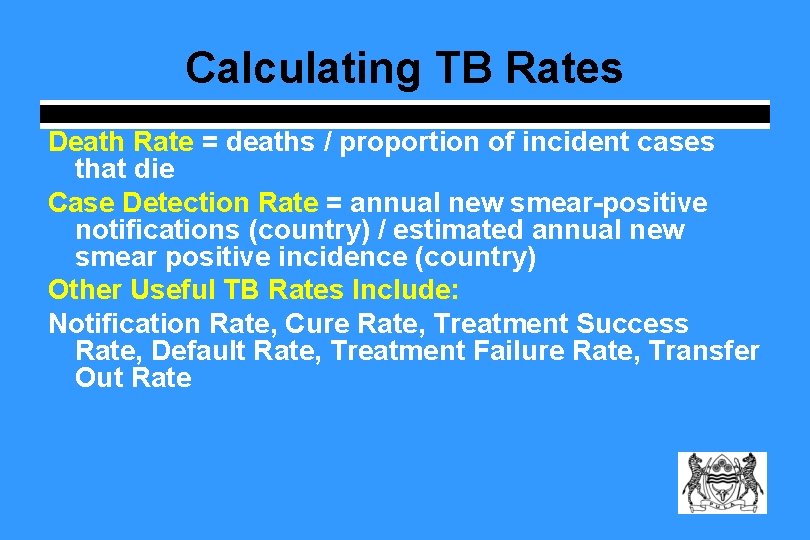
Calculating TB Rates Death Rate = deaths / proportion of incident cases that die Case Detection Rate = annual new smear-positive notifications (country) / estimated annual new smear positive incidence (country) Other Useful TB Rates Include: Notification Rate, Cure Rate, Treatment Success Rate, Default Rate, Treatment Failure Rate, Transfer Out Rate
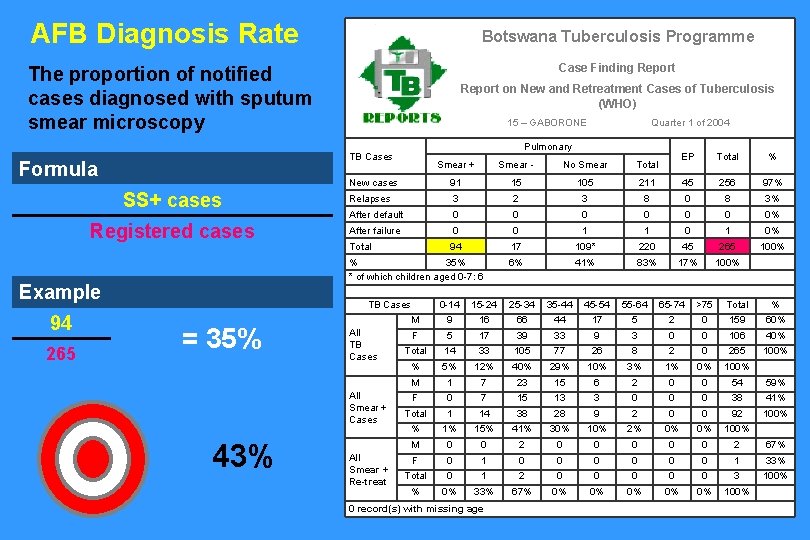
AFB Diagnosis Rate Botswana Tuberculosis Programme Case Finding Report The proportion of notified cases diagnosed with sputum smear microscopy SS+ cases Registered cases EP Total % 211 45 256 97% 3 8 0 8 3% 0 0 0% 0 0 1 1 0% 94 17 109* 220 45 265 100% 6% 41% 83% 17% 100% Smear + Smear - No Smear Total New cases 91 15 105 Relapses 3 2 After default 0 After failure Total TB Cases = 35% All TB Cases All Smear + Cases 43% Quarter 1 of 2004 Pulmonary % 35% * of which children aged 0 -7: 6 Example 265 15 – GABORONE TB Cases Formula 94 Report on New and Retreatment Cases of Tuberculosis (WHO) All Smear + Re-treat 0 -14 15 -24 25 -34 35 -44 45 -54 55 -64 65 -74 >75 Total % M 9 16 66 44 17 5 2 0 159 60% F 5 17 39 33 9 3 0 0 106 40% Total 14 33 105 77 26 8 2 0 265 100% % 5% 12% 40% 29% 10% 3% 1% 0% 100% M 1 7 23 15 6 2 0 0 54 59% F 0 7 15 13 3 0 0 0 38 41% Total 1 14 38 28 9 2 0 0 92 100% % 1% 15% 41% 30% 10% 2% 0% 0% 100% M 0 0 2 0 0 0 2 67% F 0 1 0 0 0 1 33% Total 0 1 2 0 0 0 3 100% % 0% 33% 67% 0% 0% 0% 100% 0 record(s) with missing age
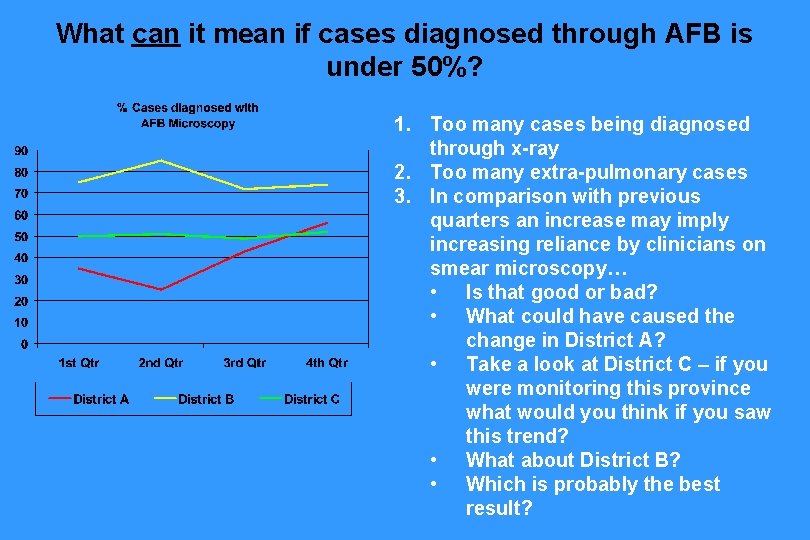
What can it mean if cases diagnosed through AFB is under 50%? 1. Too many cases being diagnosed through x-ray 2. Too many extra-pulmonary cases 3. In comparison with previous quarters an increase may imply increasing reliance by clinicians on smear microscopy… • Is that good or bad? • What could have caused the change in District A? • Take a look at District C – if you were monitoring this province what would you think if you saw this trend? • What about District B? • Which is probably the best result?
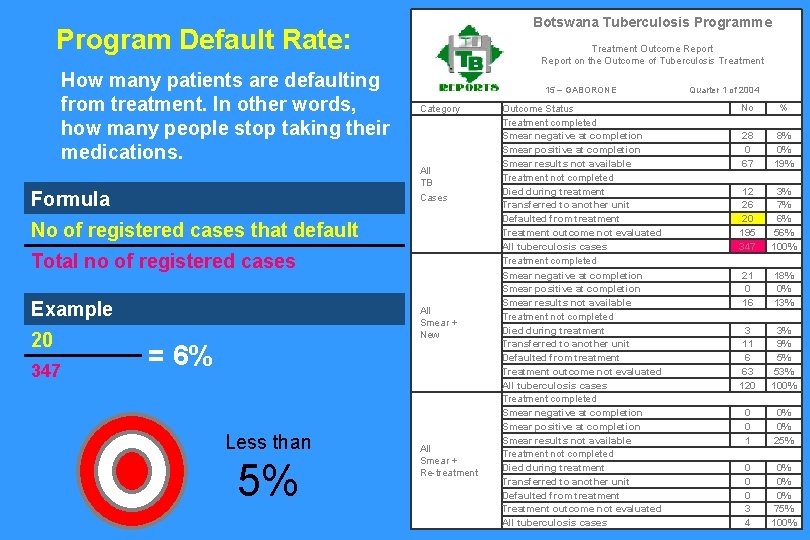
Botswana Tuberculosis Programme Program Default Rate: How many patients are defaulting from treatment. In other words, how many people stop taking their medications. Treatment Outcome Report on the Outcome of Tuberculosis Treatment 15 – GABORONE Category All TB Cases Formula No of registered cases that default Total no of registered cases Example 20 347 All Smear + New = 6% Less than 5% All Smear + Re-treatment Outcome Status Treatment completed Smear negative at completion Smear positive at completion Smear results not available Treatment not completed Died during treatment Transferred to another unit Defaulted from treatment Treatment outcome not evaluated All tuberculosis cases Quarter 1 of 2004 No % 28 0 67 8% 0% 19% 12 26 20 195 347 3% 7% 6% 56% 100% 21 0 16 18% 0% 13% 3 11 6 63 120 3% 9% 5% 53% 100% 0 0 1 0% 0% 25% 0 0 0 3 4 0% 0% 0% 75% 100%
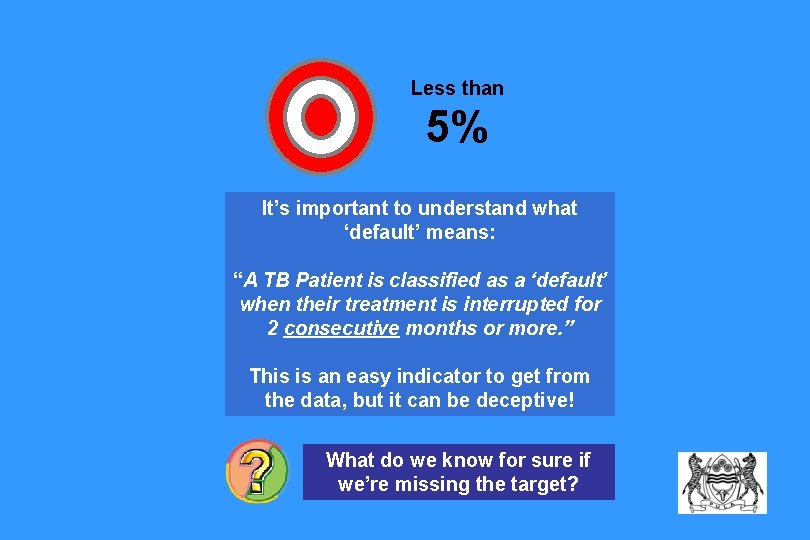
Less than 5% It’s important to understand what ‘default’ means: “A TB Patient is classified as a ‘default’ when their treatment is interrupted for 2 consecutive months or more. ” This is an easy indicator to get from the data, but it can be deceptive! The Every What Something patient defaulting do we is quite know is wrong patient likely forinsure =sill the a risk sick if program ofwe’re MDR-TB and missing andcontagious. inneeds thethe community. totarget? be fixed.
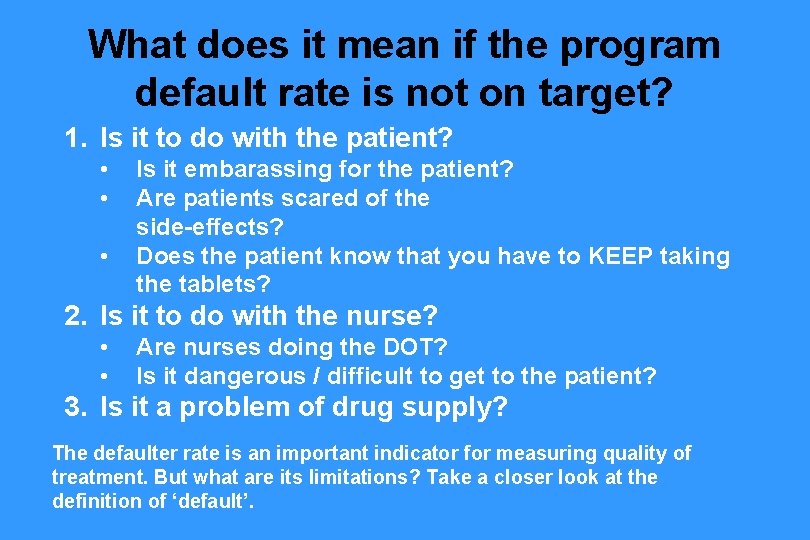
What does it mean if the program default rate is not on target? 1. Is it to do with the patient? • • • Is it embarassing for the patient? Are patients scared of the side-effects? Does the patient know that you have to KEEP taking the tablets? 2. Is it to do with the nurse? • • Are nurses doing the DOT? Is it dangerous / difficult to get to the patient? 3. Is it a problem of drug supply? The defaulter rate is an important indicator for measuring quality of treatment. But what are its limitations? Take a closer look at the definition of ‘default’.
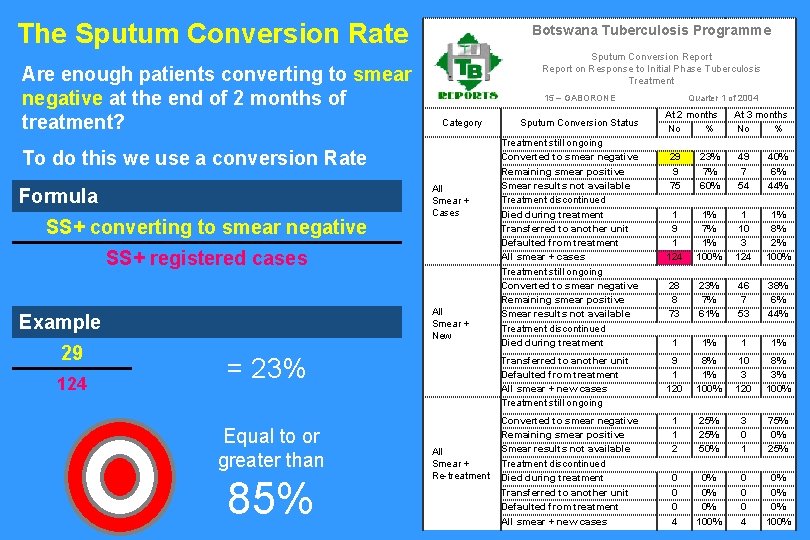
The Sputum Conversion Rate Are enough patients converting to smear negative at the end of 2 months of treatment? Botswana Tuberculosis Programme Sputum Conversion Report on Response to Initial Phase Tuberculosis Treatment 15 – GABORONE Category To do this we use a conversion Rate Formula SS+ converting to smear negative All Smear + Cases SS+ registered cases All Smear + New Example 29 124 = 23% Equal to or greater than 85% Sputum Conversion Status Treatment still ongoing Converted to smear negative Remaining smear positive Smear results not available Treatment discontinued Died during treatment Transferred to another unit Defaulted from treatment All smear + cases Treatment still ongoing Converted to smear negative Remaining smear positive Smear results not available Treatment discontinued Died during treatment Transferred to another unit Defaulted from treatment All smear + new cases Treatment still ongoing All Smear + Re-treatment Converted to smear negative Remaining smear positive Smear results not available Treatment discontinued Died during treatment Transferred to another unit Defaulted from treatment All smear + new cases Quarter 1 of 2004 At 2 months No % At 3 months No % 29 9 75 23% 7% 60% 49 7 54 40% 6% 44% 1 9 1 124 1% 7% 1% 100% 1 10 3 124 1% 8% 2% 100% 28 8 73 23% 7% 61% 46 7 53 38% 6% 44% 1 1% 9 1 120 8% 1% 100% 10 3 120 8% 3% 100% 1 1 2 25% 50% 3 0 1 75% 0% 25% 0 0 0 4 0% 0% 0% 100%
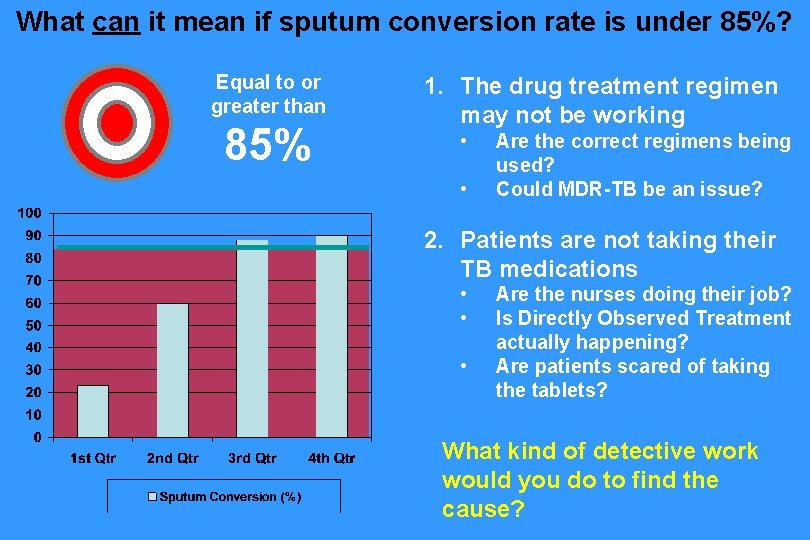
What can it mean if sputum conversion rate is under 85%? Equal to or greater than 85% 1. The drug treatment regimen may not be working • • Are the correct regimens being used? Could MDR-TB be an issue? 2. Patients are not taking their TB medications • • • Are the nurses doing their job? Is Directly Observed Treatment actually happening? Are patients scared of taking the tablets? What kind of detective work would you do to find the cause?
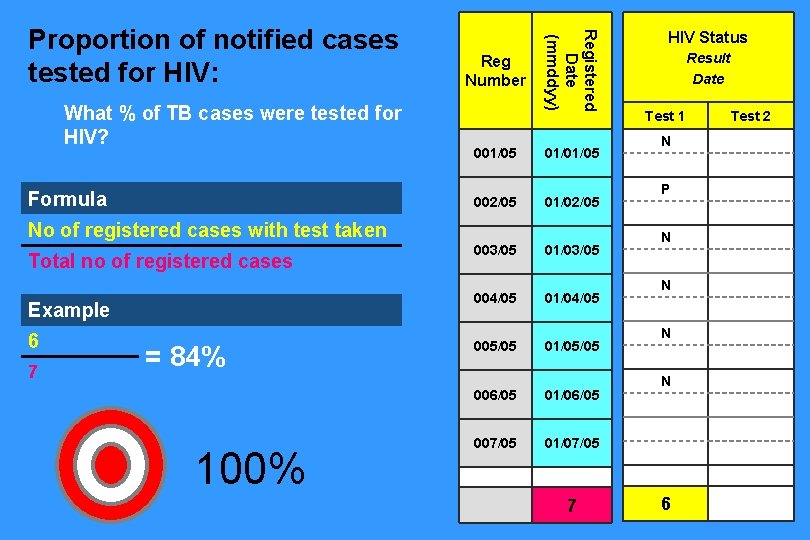
What % of TB cases were tested for HIV? Formula Reg Number Registered Date (mmddyy) Proportion of notified cases tested for HIV: 001/05 01/01/05 002/05 01/02/05 003/05 01/03/05 004/05 01/04/05 005/05 01/05/05 006/05 01/06/05 007/05 01/07/05 No of registered cases with test taken Total no of registered cases Example 6 7 = 84% 100% 7 HIV Status Result Date Test 1 N P N N 6 Test 2
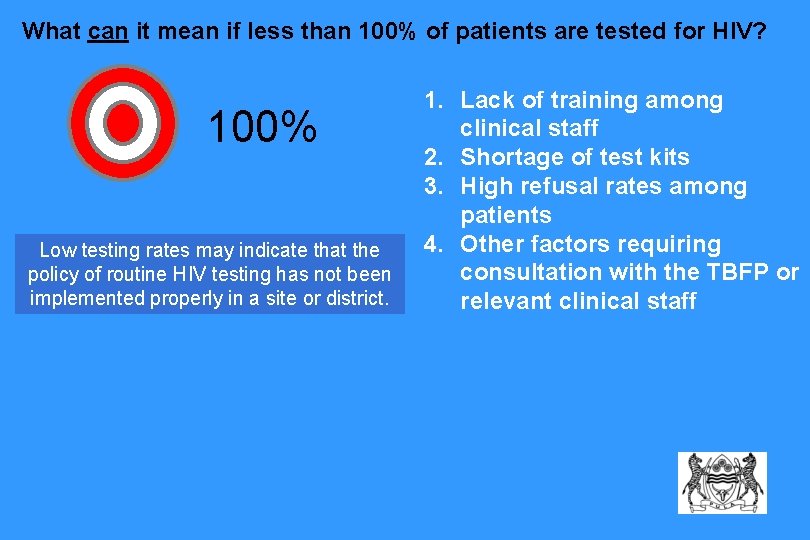
What can it mean if less than 100% of patients are tested for HIV? 100% Low testing rates may indicate that the policy of routine HIV testing has not been implemented properly in a site or district. 1. Lack of training among clinical staff 2. Shortage of test kits 3. High refusal rates among patients 4. Other factors requiring consultation with the TBFP or relevant clinical staff
Analysing the treatment card
Reviewing the Treatment Card • Patient’s information is complete • Patient’s DOT and weights correctly recorded • All HIV Status results are correctly recorded • For HIV-infected patients – Receipt of ART noted? – Receipt of IPT?
By now (hopefully)… We have: § An understanding of the principles of M&E § Some experience and guidelines you can take away with you on good ways to: § Observe § Communicate § Analyse
Next steps In the next session we will apply these practices to the supervision checklist, which means we have to: § § § Use the whole supervision checklist Practice communicating with actual field staff Interpret actual data to develop indicators Observe the environment Develop a list of action-items
Thank you and Good Luck!