Module 4 Root Cause Analysis Root Cause Analysis


- Slides: 32
Module 4 Root Cause Analysis
Root Cause Analysis ◦ Root cause analysis helps identify what, how and why something happened, thus preventing recurrence ◦ Root causes are underlying and reasonably identifiable ◦ The process involves data collection, cause charting and root cause identification
Root Cause Analysis ◦ Brainstorming sessions are highly useful ◦ Each individual’s perspective is vital ◦ A good tool for high performance teams
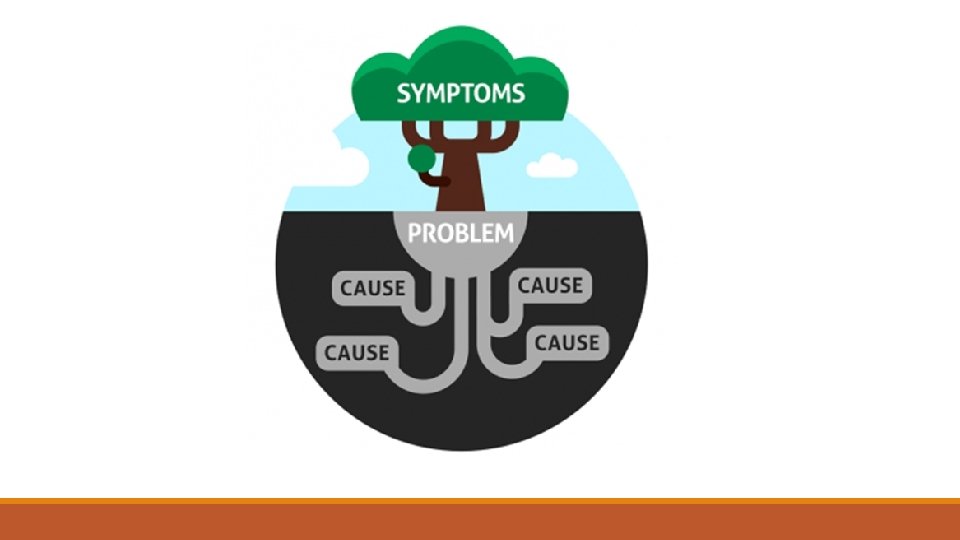
Why Does RCA Matter? • Determines actual cause of a problem rather than symptoms • Allows us to treat problem rather than symptoms • Allows us to put in place measures to keep problem from reoccurring
Implementing RCA
Change Management Iceberg Organizational Level 10% Culture Level 90%
Root Cause Analysis Tools
RCA Tools • “ 5 Whys” • Fishbone Diagrams • Affinity Diagrams
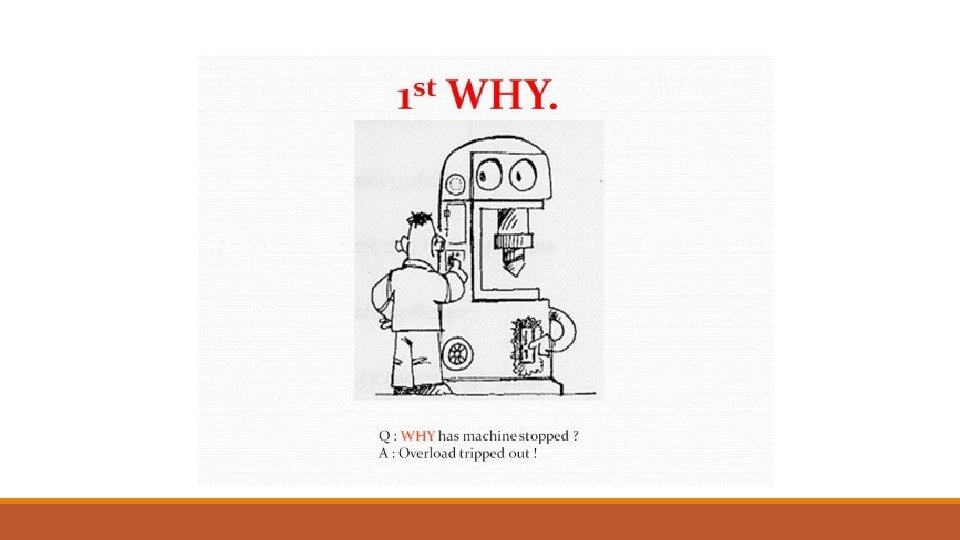
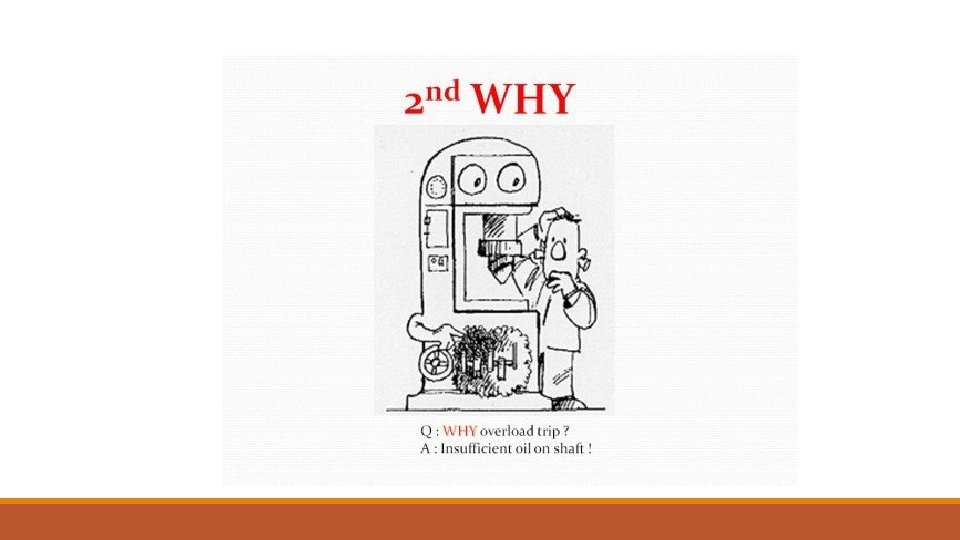
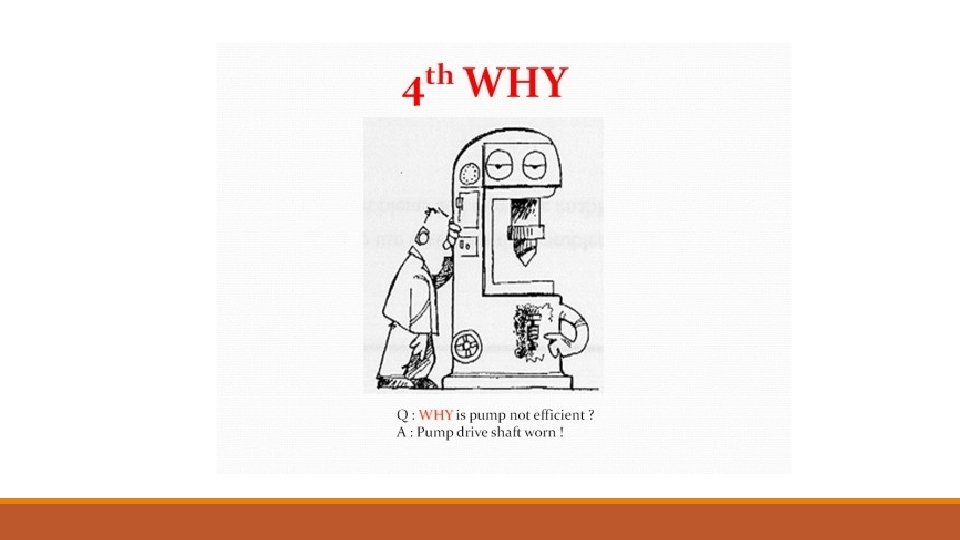
5 Whys • Ask why until root cause can be determined • Simple and effective “If you don’t ask the right questions, you don’t get the right answers. A question asked in the right way often points to its own answer. ” Edward Hodnett
Our Machine Has Stopped…….
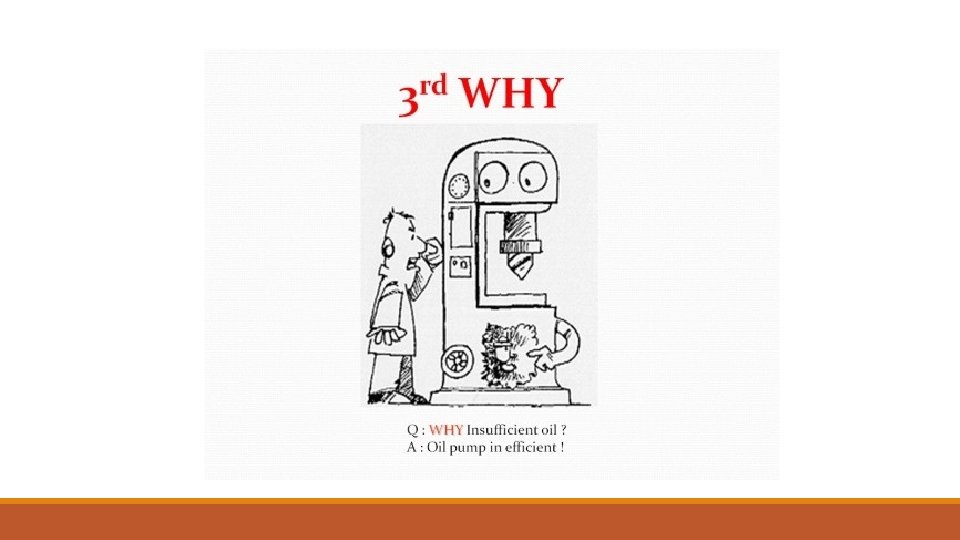
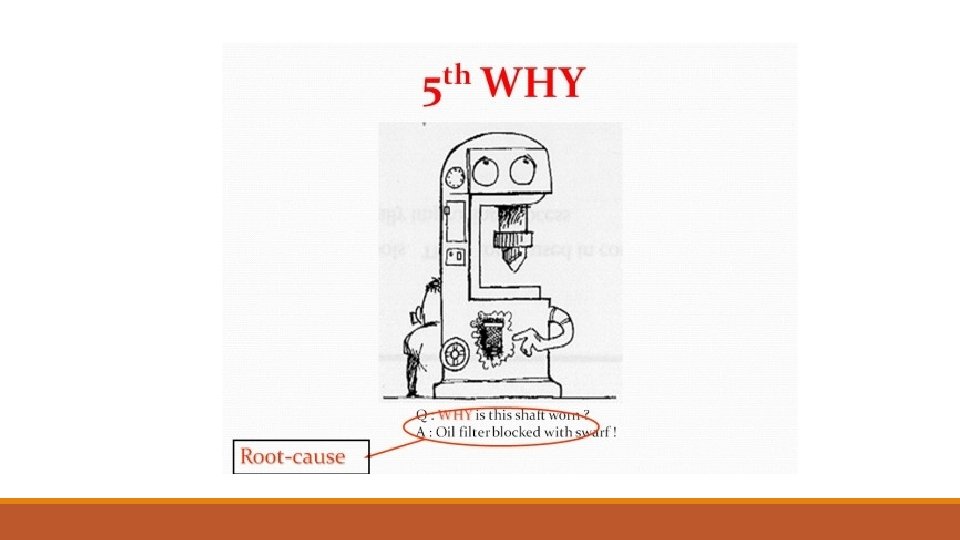
Could we continue…?
Yes! We could look into why we do not have a preventative maintenance program in place to prevent the swarf from building up. “ 5 Whys” Does not have to stop after you ask why 5 times!
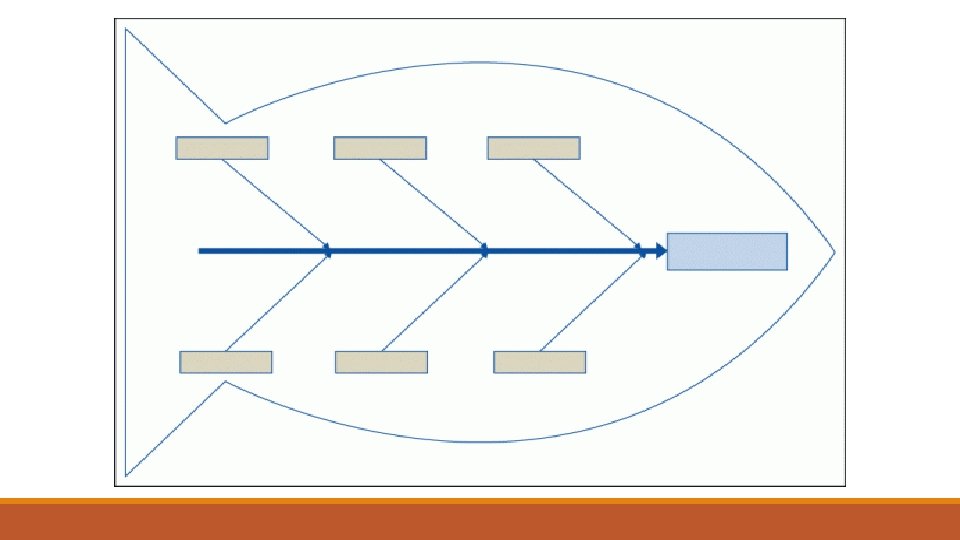
Fishbone Diagrams • Simple and Effective • Capture more potential factors • Used in conjunction with 5 whys • Help bring focus to brainstorming sessions
4 P’s Fishbone Diagram • Plant • People • Policies • Procedures
4 P’s Fishbone Diagram Plant, People, Policies and Procedure Name Your Cause Here s Pol icie Peo ple Name Your Cause Here Name Your Cause Here Effect 4 P’s Name Your Cause Here s ure gy olo hn Tec Name Your Cause Here ced Pro nt/ Pla Name Your Cause Here
4 S’s Fishbone Diagram • Surroundings • Suppliers • Systems • Skills
4 S’s Fishbone Diagram Surroundings, Suppliers, Systems and Skills Name Your Cause Here rs plie Name Your Cause Here Sup Sur rou ndi ngs Name Your Cause Here Effect 4 P’s Name Your Cause Here lls Name Your Cause Here Ski s em t Sys Name Your Cause Here
6 M’s Fishbone Diagrams • Man • Machine • Management • Measurement • Material • Method
6 M’s Fishbone Diagram Name Your Cause Here Name Your Cause Here Effect Ma na Name Your Cause Here ne chi Name Your Cause Here Ma Ma n Name Your Cause Here gem ent Man, Machine, Management, Measurement, Material and Method 6 M’s Name Your Cause Here d tho Me Name Your Cause Here ial nt e em ter Ma r asu Me Name Your Cause Here
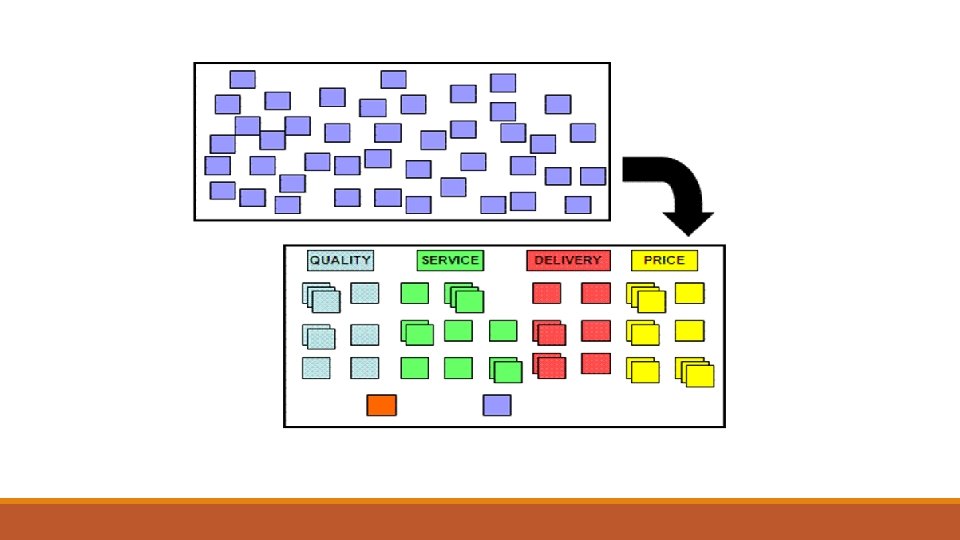
Affinity Diagrams • Uses everyone’s thoughts and ideas • Allows for individual brainstorming followed by group collaboration • Works well across multiple shifts • People are not “boxed in” by predetermined categories
Affinity Diagrams • Everyone writes their ideas down on post it notes • Notes are placed randomly on a large wall or board • Post it notes are then organized into categories or grouped into common causes (no talking allowed during this step) • Group collaboration determines the most like cause/causes
When to use Affinity Diagrams…? • Across multiple shifts • When group collaboration is a must • When a problem is complex or hard to grasp • Allows the group to move past preconceived ideas
End of module 4