
Module 3 Understanding Measurement Properties Jennifer Moore PT





- Slides: 93
Module 3: Understanding Measurement Properties Jennifer Moore, PT, DHS, NCS Allan Kozlowski, Ph. D, PT Allen W. Heinemann, Ph. D, ABPP (RP), FACRM © 2013 by the Rehabilitation Institute of Chicago. All rights reserved. Requests for modification may be sent to aheinemann@ric. org. 1
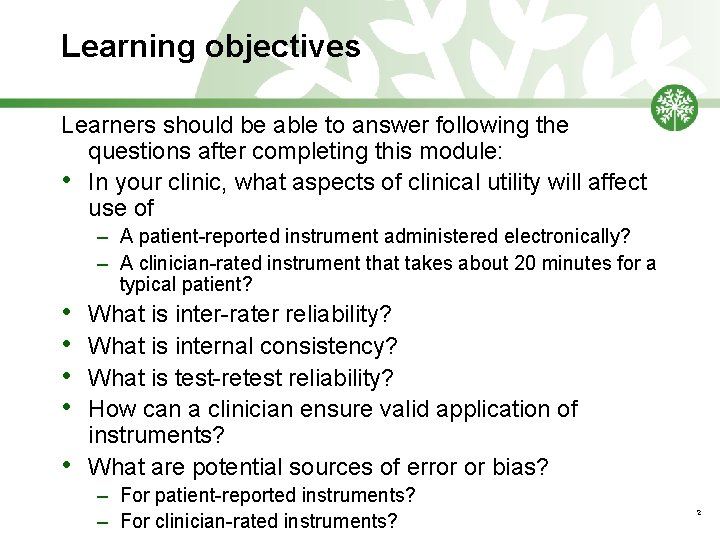
Learning objectives Learners should be able to answer following the questions after completing this module: • In your clinic, what aspects of clinical utility will affect use of • • • – A patient-reported instrument administered electronically? – A clinician-rated instrument that takes about 20 minutes for a typical patient? What is inter-rater reliability? What is internal consistency? What is test-retest reliability? How can a clinician ensure valid application of instruments? What are potential sources of error or bias? – For patient-reported instruments? – For clinician-rated instruments? 2
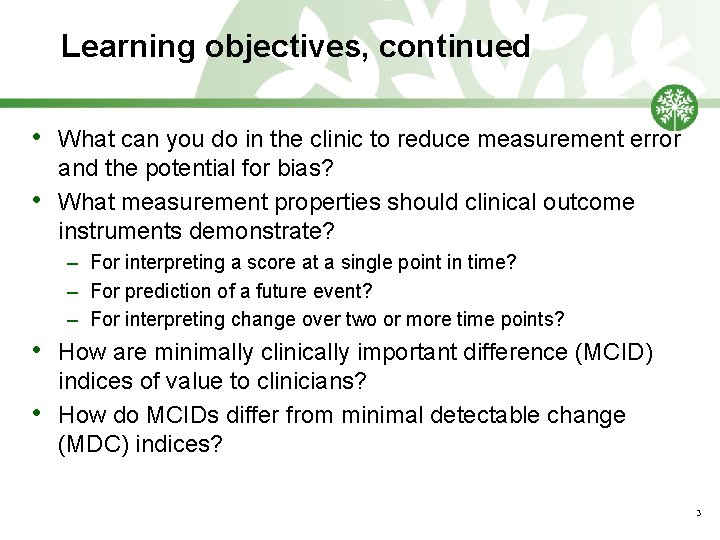
Learning objectives, continued • • What can you do in the clinic to reduce measurement error and the potential for bias? What measurement properties should clinical outcome instruments demonstrate? – For interpreting a score at a single point in time? – For prediction of a future event? – For interpreting change over two or more time points? • • How are minimally clinically important difference (MCID) indices of value to clinicians? How do MCIDs differ from minimal detectable change (MDC) indices? 3
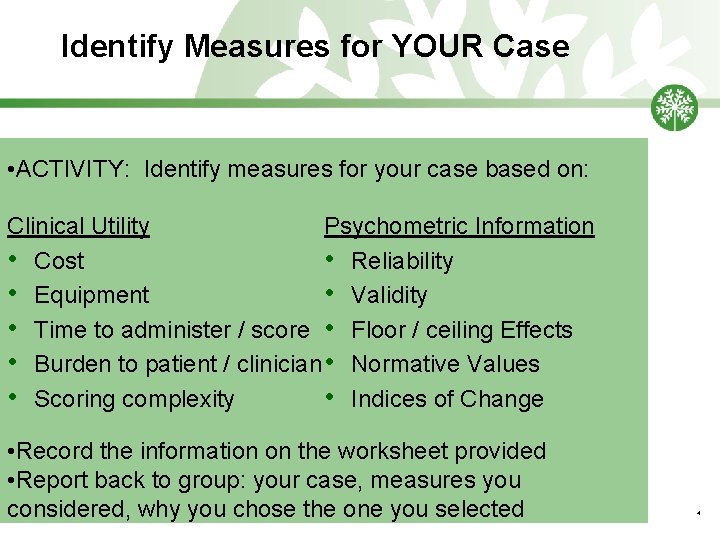
Identify Measures for YOUR Case • ACTIVITY: Identify measures for your case based on: Psychometric Information Clinical Utility • Cost • Reliability • Equipment • Validity • Time to administer / score • Floor / ceiling Effects • Burden to patient / clinician • Normative Values • Scoring complexity • Indices of Change • Record the information on the worksheet provided • Report back to group: your case, measures you considered, why you chose the one you selected 4
Clinical Utility 5
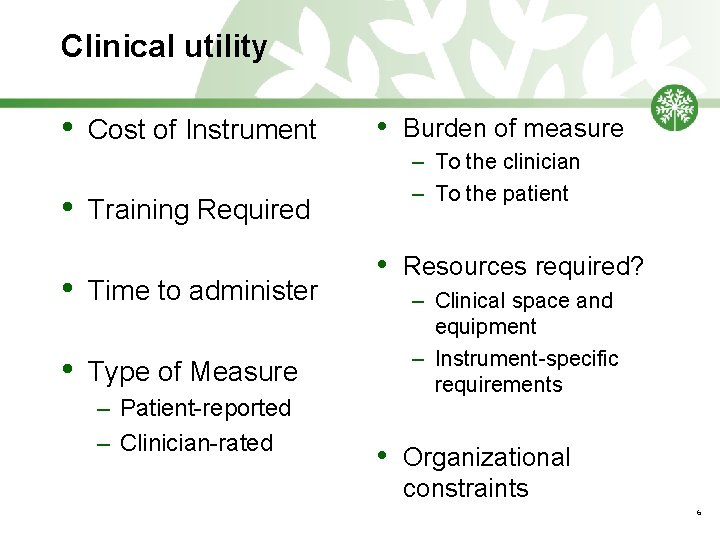
Clinical utility • • Cost of Instrument • – To the clinician – To the patient Training Required • Time to administer • Type of Measure – Patient-reported – Clinician-rated Burden of measure • Resources required? – Clinical space and equipment – Instrument-specific requirements • Organizational constraints 6
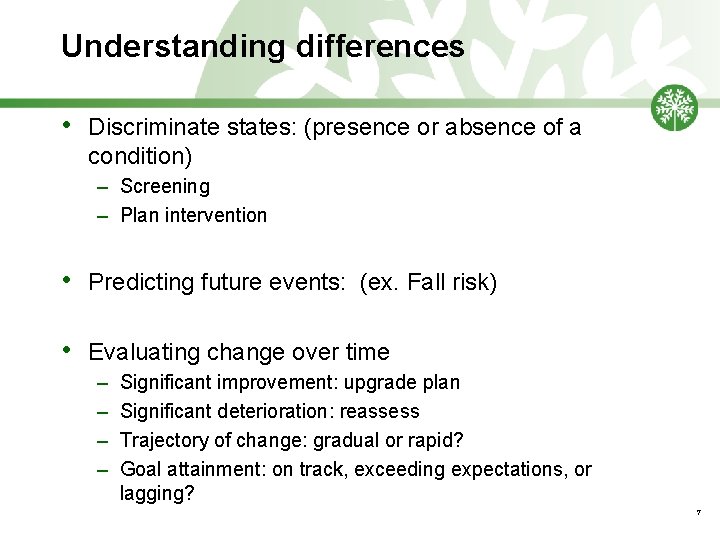
Understanding differences • Discriminate states: (presence or absence of a condition) – Screening – Plan intervention • Predicting future events: (ex. Fall risk) • Evaluating change over time – – Significant improvement: upgrade plan Significant deterioration: reassess Trajectory of change: gradual or rapid? Goal attainment: on track, exceeding expectations, or lagging? 7
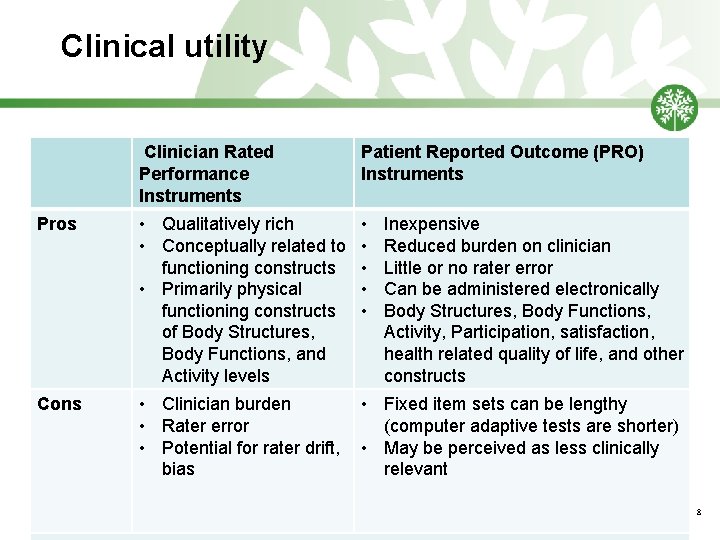
Clinical utility Clinician Rated Performance Instruments Patient Reported Outcome (PRO) Instruments Pros • Qualitatively rich • Conceptually related to functioning constructs • Primarily physical functioning constructs of Body Structures, Body Functions, and Activity levels • • • Cons • Clinician burden • Fixed item sets can be lengthy • Rater error (computer adaptive tests are shorter) • Potential for rater drift, • May be perceived as less clinically bias relevant Inexpensive Reduced burden on clinician Little or no rater error Can be administered electronically Body Structures, Body Functions, Activity, Participation, satisfaction, health related quality of life, and other constructs 8
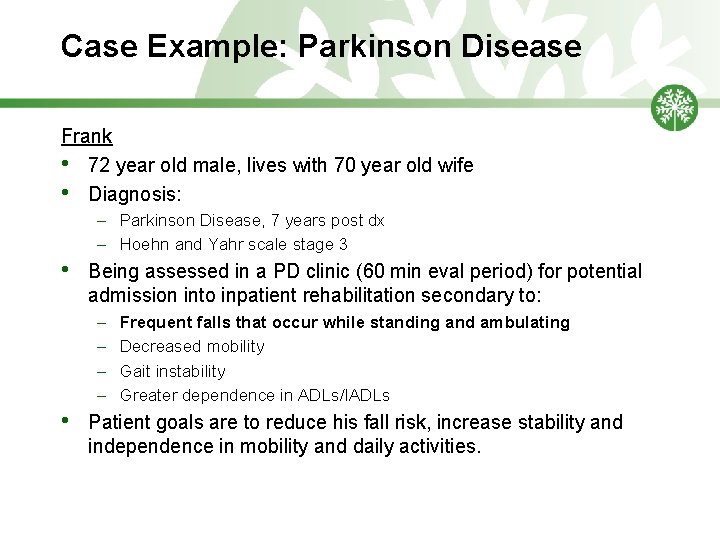
Case Example: Parkinson Disease Frank • 72 year old male, lives with 70 year old wife • Diagnosis: – Parkinson Disease, 7 years post dx – Hoehn and Yahr scale stage 3 • Being assessed in a PD clinic (60 min eval period) for potential admission into inpatient rehabilitation secondary to: – – • Frequent falls that occur while standing and ambulating Decreased mobility Gait instability Greater dependence in ADLs/IADLs Patient goals are to reduce his fall risk, increase stability and independence in mobility and daily activities.
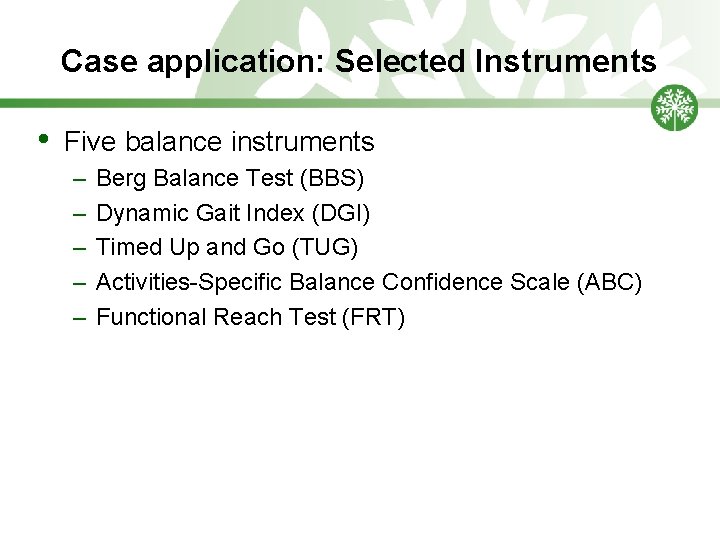
Case application: Selected Instruments • Five balance instruments – – – Berg Balance Test (BBS) Dynamic Gait Index (DGI) Timed Up and Go (TUG) Activities-Specific Balance Confidence Scale (ABC) Functional Reach Test (FRT)
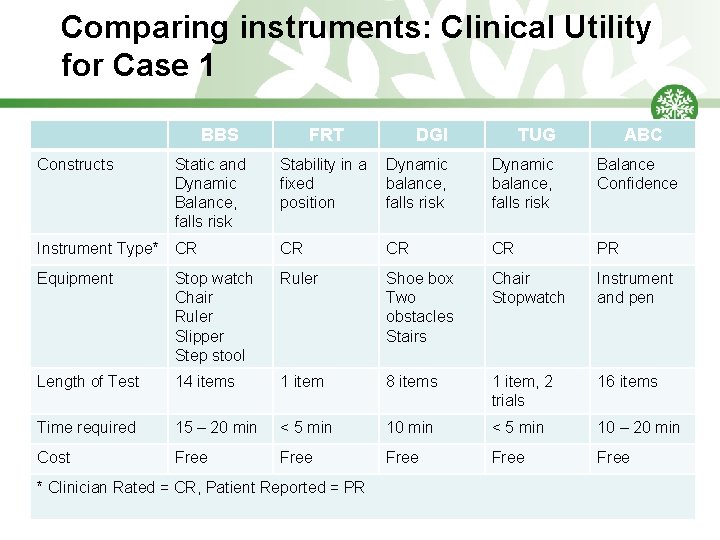
Comparing instruments: Clinical Utility for Case 1 BBS Constructs Static and Dynamic Balance, falls risk FRT DGI TUG ABC Stability in a Dynamic fixed balance, position falls risk Dynamic balance, falls risk Balance Confidence Instrument Type* CR CR PR Equipment Stop watch Chair Ruler Slipper Step stool Ruler Shoe box Two obstacles Stairs Chair Stopwatch Instrument and pen Length of Test 14 items 1 item 8 items 1 item, 2 trials 16 items Time required 15 – 20 min < 5 min 10 – 20 min Cost Free Free * Clinician Rated = CR, Patient Reported = PR
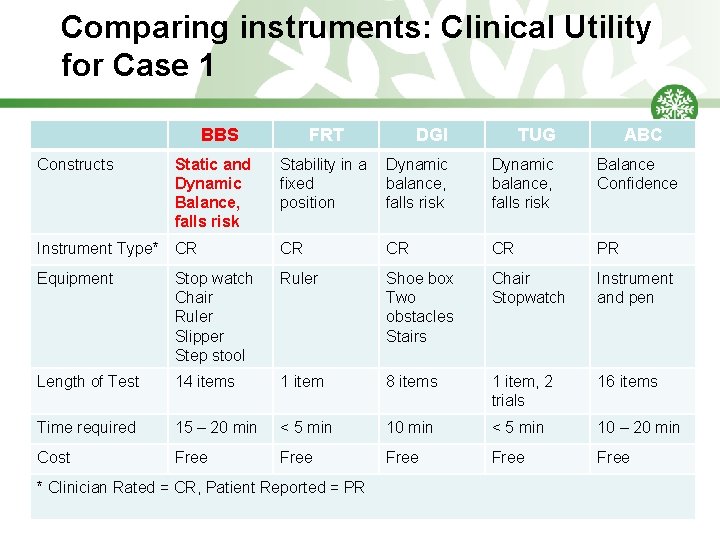
Comparing instruments: Clinical Utility for Case 1 BBS Constructs Static and Dynamic Balance, falls risk FRT DGI TUG ABC Stability in a Dynamic fixed balance, position falls risk Dynamic balance, falls risk Balance Confidence Instrument Type* CR CR PR Equipment Stop watch Chair Ruler Slipper Step stool Ruler Shoe box Two obstacles Stairs Chair Stopwatch Instrument and pen Length of Test 14 items 1 item 8 items 1 item, 2 trials 16 items Time required 15 – 20 min < 5 min 10 – 20 min Cost Free Free * Clinician Rated = CR, Patient Reported = PR
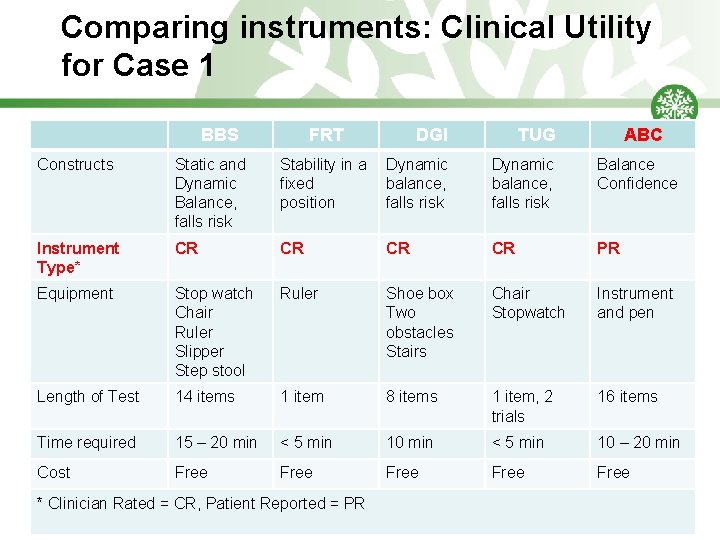
Comparing instruments: Clinical Utility for Case 1 BBS FRT DGI TUG ABC Constructs Static and Dynamic Balance, falls risk Stability in a Dynamic fixed balance, position falls risk Dynamic balance, falls risk Balance Confidence Instrument Type* CR CR PR Equipment Stop watch Chair Ruler Slipper Step stool Ruler Shoe box Two obstacles Stairs Chair Stopwatch Instrument and pen Length of Test 14 items 1 item 8 items 1 item, 2 trials 16 items Time required 15 – 20 min < 5 min 10 – 20 min Cost Free Free * Clinician Rated = CR, Patient Reported = PR
Clinical Bottom Line: Clinical Utility • Match instrument with purpose • Consider organizational barriers / facilitators • An instrument that has good clinical utility in one setting, doesn’t mean clinical utility is good in another
Classroom Activity: Clinical Utility • ACTIVITY: Use online resources to identify important aspects of clinical utility for the instruments you have chosen • Record the information on the worksheet provided • Determine whethere are specific considerations for your situation • The group will report back interesting findings 15
Reliability 16
Reliability = Consistency • Reliability coefficients are… – Derived from samples – NOT attributes of the instrument – Based on the sample context § § Study methods Sample demographics Condition(s) of interest Instrument • Clinical considerations – How precise will this instrument measure the construct with my patient? – What sources of error are relevant to use of this instrument with patients in my clinic? – Best you can expect: clinical settings less rigorous than research settings 17
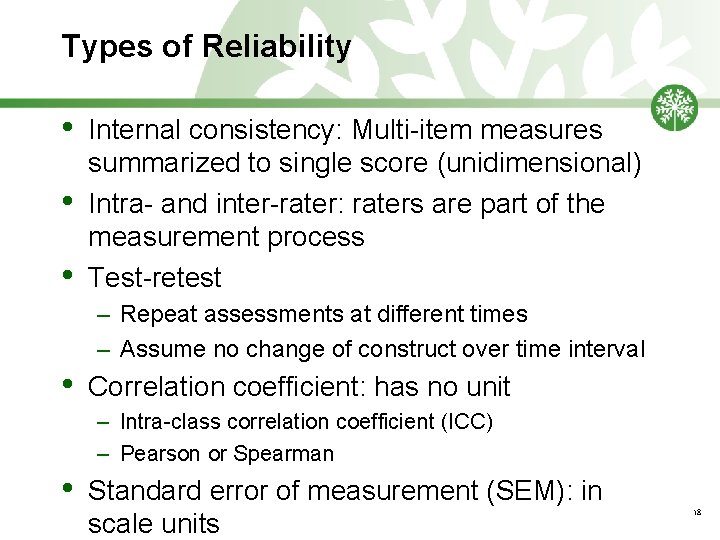
Types of Reliability • • • Internal consistency: Multi-item measures summarized to single score (unidimensional) Intra- and inter-rater: raters are part of the measurement process Test-retest – Repeat assessments at different times – Assume no change of construct over time interval • Correlation coefficient: has no unit – Intra-class correlation coefficient (ICC) – Pearson or Spearman • Standard error of measurement (SEM): in scale units 18
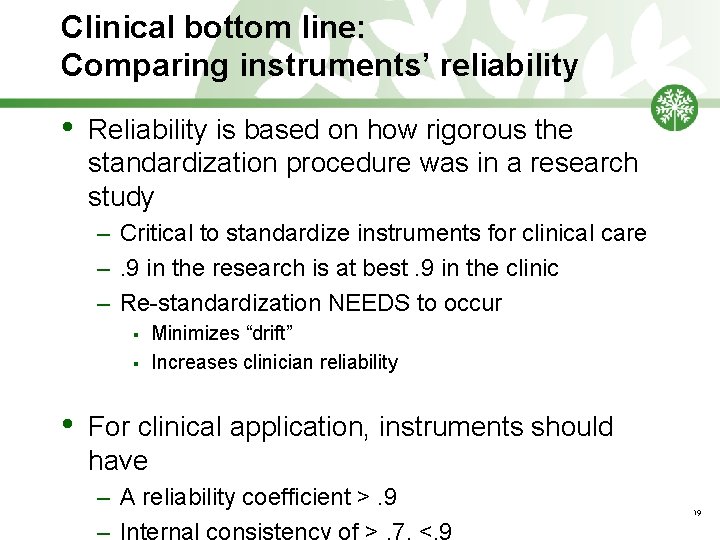
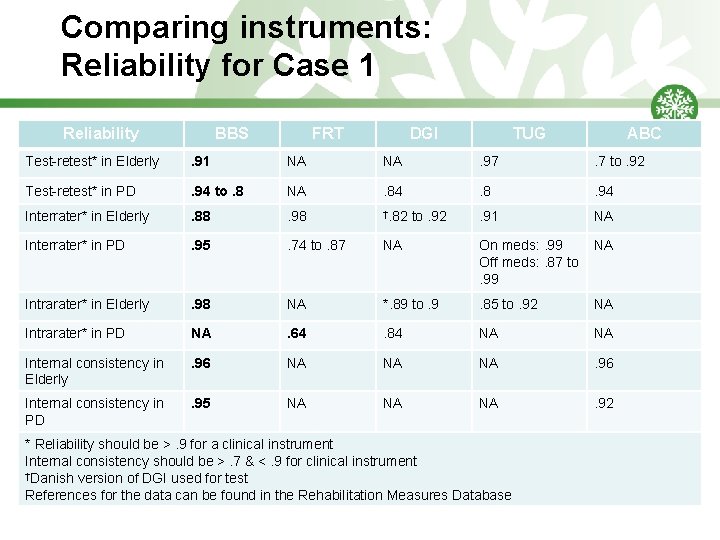
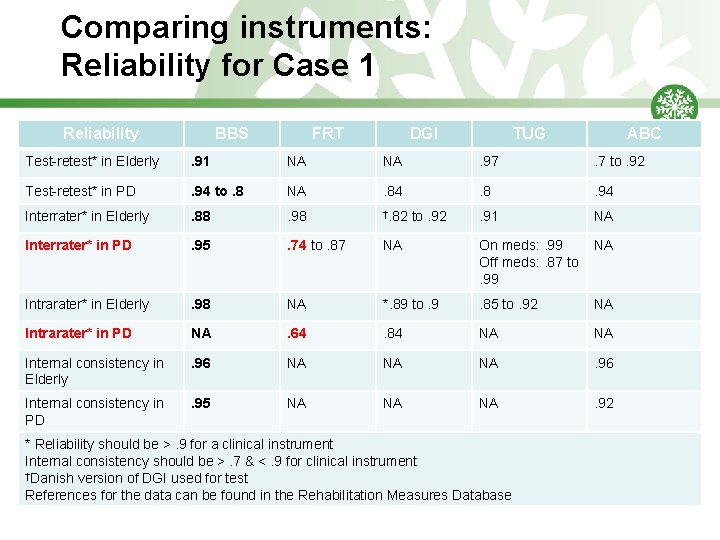
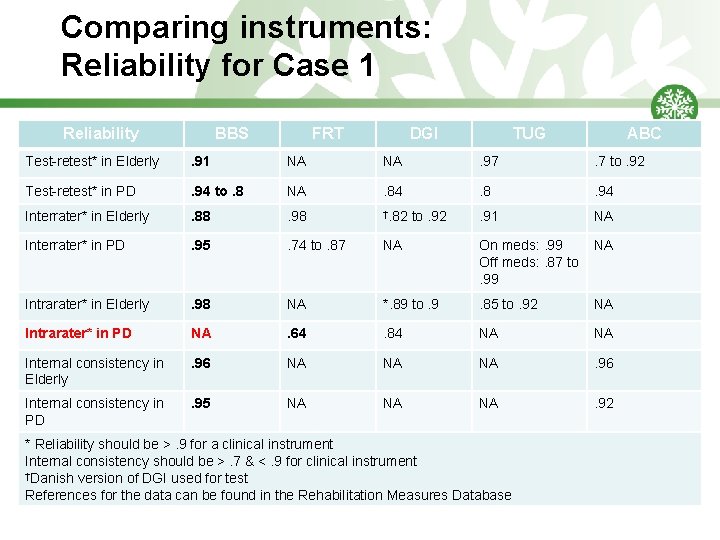
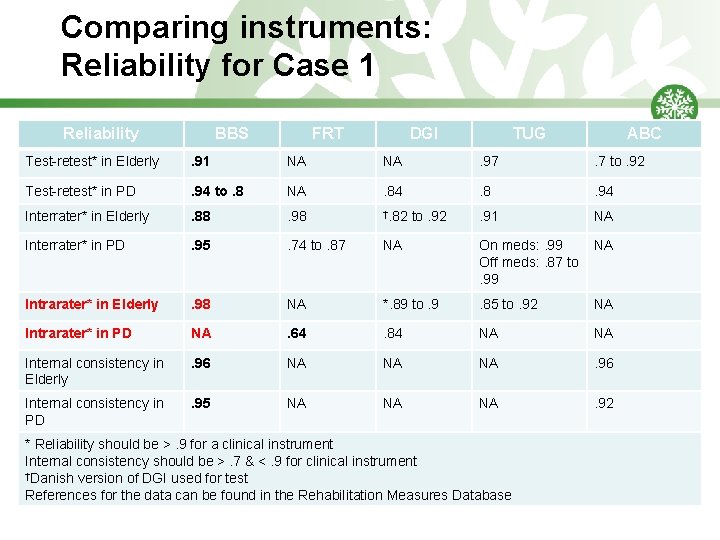
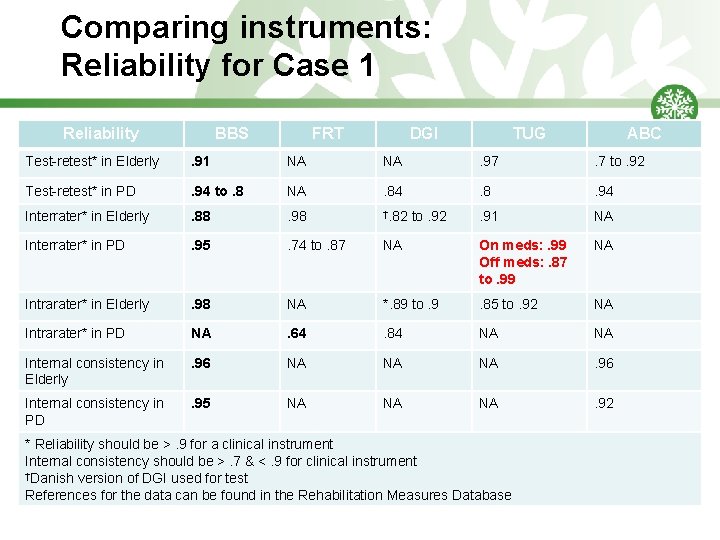
Clinical bottom line: Comparing instruments’ reliability • Reliability is based on how rigorous the standardization procedure was in a research study – Critical to standardize instruments for clinical care –. 9 in the research is at best. 9 in the clinic – Re-standardization NEEDS to occur § § • Minimizes “drift” Increases clinician reliability For clinical application, instruments should have – A reliability coefficient >. 9 19
Comparing instruments: Reliability for Case 1 Reliability BBS FRT DGI TUG ABC Test-retest* in Elderly . 91 NA NA . 97 . 7 to. 92 Test-retest* in PD . 94 to. 8 NA . 84 . 8 . 94 Interrater* in Elderly . 88 . 98 †. 82 to. 92 . 91 NA Interrater* in PD . 95 . 74 to. 87 NA On meds: . 99 NA Off meds: . 87 to . 99 Intrarater* in Elderly . 98 NA *. 89 to. 9 . 85 to. 92 NA Intrarater* in PD NA . 64 . 84 NA NA Internal consistency in Elderly . 96 NA NA NA . 96 Internal consistency in PD . 95 NA NA NA . 92 * Reliability should be >. 9 for a clinical instrument Internal consistency should be >. 7 & <. 9 for clinical instrument †Danish version of DGI used for test References for the data can be found in the Rehabilitation Measures Database
Comparing instruments: Reliability for Case 1 Reliability BBS FRT DGI TUG ABC Test-retest* in Elderly . 91 NA NA . 97 . 7 to. 92 Test-retest* in PD . 94 to. 8 NA . 84 . 8 . 94 Interrater* in Elderly . 88 . 98 †. 82 to. 92 . 91 NA Interrater* in PD . 95 . 74 to. 87 NA On meds: . 99 NA Off meds: . 87 to . 99 Intrarater* in Elderly . 98 NA *. 89 to. 9 . 85 to. 92 NA Intrarater* in PD NA . 64 . 84 NA NA Internal consistency in Elderly . 96 NA NA NA . 96 Internal consistency in PD . 95 NA NA NA . 92 * Reliability should be >. 9 for a clinical instrument Internal consistency should be >. 7 & <. 9 for clinical instrument †Danish version of DGI used for test References for the data can be found in the Rehabilitation Measures Database
Comparing instruments: Reliability for Case 1 Reliability BBS FRT DGI TUG ABC Test-retest* in Elderly . 91 NA NA . 97 . 7 to. 92 Test-retest* in PD . 94 to. 8 NA . 84 . 8 . 94 Interrater* in Elderly . 88 . 98 †. 82 to. 92 . 91 NA Interrater* in PD . 95 . 74 to. 87 NA On meds: . 99 NA Off meds: . 87 to . 99 Intrarater* in Elderly . 98 NA *. 89 to. 9 . 85 to. 92 NA Intrarater* in PD NA . 64 . 84 NA NA Internal consistency in Elderly . 96 NA NA NA . 96 Internal consistency in PD . 95 NA NA NA . 92 * Reliability should be >. 9 for a clinical instrument Internal consistency should be >. 7 & <. 9 for clinical instrument †Danish version of DGI used for test References for the data can be found in the Rehabilitation Measures Database
Comparing instruments: Reliability for Case 1 Reliability BBS FRT DGI TUG ABC Test-retest* in Elderly . 91 NA NA . 97 . 7 to. 92 Test-retest* in PD . 94 to. 8 NA . 84 . 8 . 94 Interrater* in Elderly . 88 . 98 †. 82 to. 92 . 91 NA Interrater* in PD . 95 . 74 to. 87 NA On meds: . 99 NA Off meds: . 87 to . 99 Intrarater* in Elderly . 98 NA *. 89 to. 9 . 85 to. 92 NA Intrarater* in PD NA . 64 . 84 NA NA Internal consistency in Elderly . 96 NA NA NA . 96 Internal consistency in PD . 95 NA NA NA . 92 * Reliability should be >. 9 for a clinical instrument Internal consistency should be >. 7 & <. 9 for clinical instrument †Danish version of DGI used for test References for the data can be found in the Rehabilitation Measures Database
Comparing instruments: Reliability for Case 1 Reliability BBS FRT DGI TUG ABC Test-retest* in Elderly . 91 NA NA . 97 . 7 to. 92 Test-retest* in PD . 94 to. 8 NA . 84 . 8 . 94 Interrater* in Elderly . 88 . 98 †. 82 to. 92 . 91 NA Interrater* in PD . 95 . 74 to. 87 NA On meds: . 99 Off meds: . 87 to. 99 NA Intrarater* in Elderly . 98 NA *. 89 to. 9 . 85 to. 92 NA Intrarater* in PD NA . 64 . 84 NA NA Internal consistency in Elderly . 96 NA NA NA . 96 Internal consistency in PD . 95 NA NA NA . 92 * Reliability should be >. 9 for a clinical instrument Internal consistency should be >. 7 & <. 9 for clinical instrument †Danish version of DGI used for test References for the data can be found in the Rehabilitation Measures Database
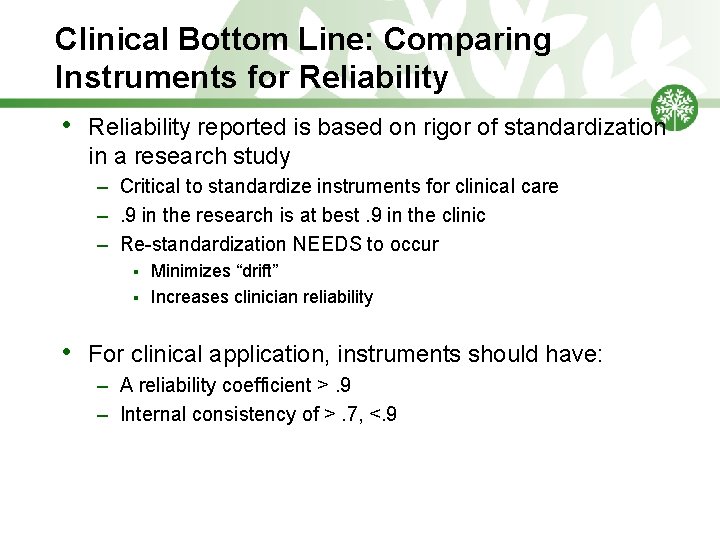
Clinical Bottom Line: Comparing Instruments for Reliability • Reliability reported is based on rigor of standardization in a research study – Critical to standardize instruments for clinical care –. 9 in the research is at best. 9 in the clinic – Re-standardization NEEDS to occur § § • Minimizes “drift” Increases clinician reliability For clinical application, instruments should have: – A reliability coefficient >. 9 – Internal consistency of >. 7, <. 9
Classroom Activity: Reliability ACTIVITY: Use online resources to identify reliability and internal consistency of the measures that you chose • Record the information on the worksheet provided • Determine whethere are specific considerations for your situation • The group will report back interesting findings 26
Valid application of instruments 27
Validity Extent to which a measure assesses what it is intended to measure • Validity is an attribute of the application of a measure, to a sample, in a context, and not an attribute of the measure itself • Reliability is a prerequisite • Reliability defines the upper limit of validity 28
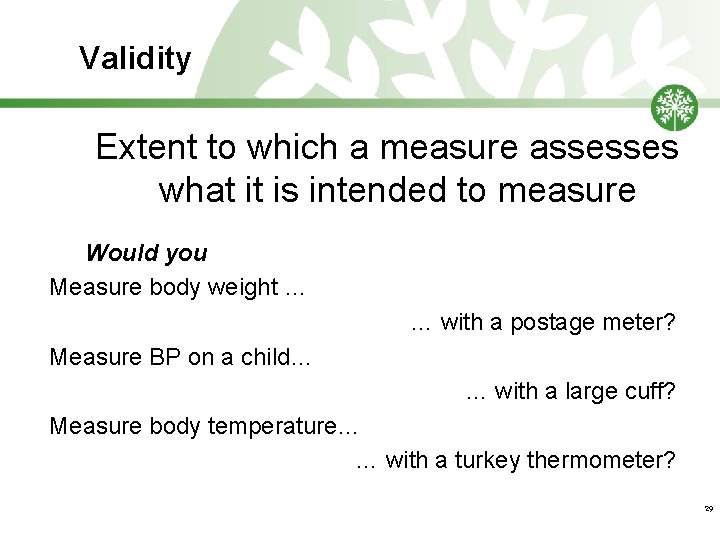
Validity Extent to which a measure assesses what it is intended to measure Would you Measure body weight … … with a postage meter? Measure BP on a child… … with a large cuff? Measure body temperature… … with a turkey thermometer? 29
Validity – How meaningful and trustworthy is the interpretation of • A given score • From a given measure • For a given person/sample • Under a given context 30
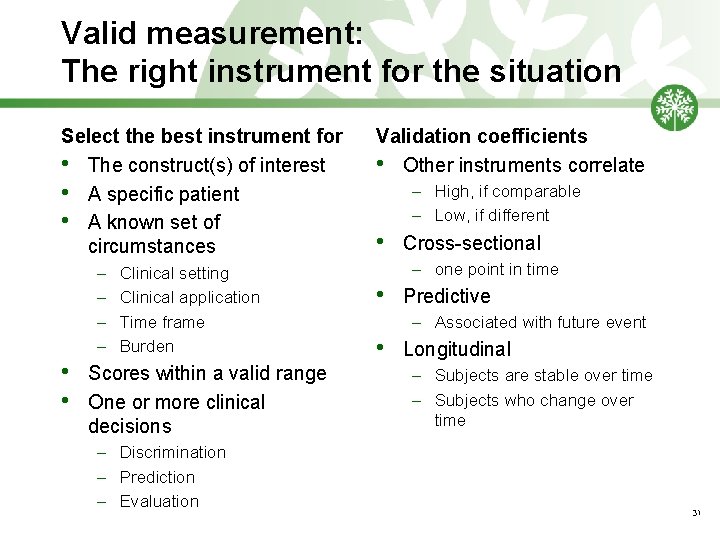
Valid measurement: The right instrument for the situation Select the best instrument for • The construct(s) of interest • A specific patient • A known set of circumstances – – • • Clinical setting Clinical application Time frame Burden Scores within a valid range One or more clinical decisions – Discrimination – Prediction – Evaluation Validation coefficients • Other instruments correlate – High, if comparable – Low, if different • Cross-sectional – one point in time • Predictive – Associated with future event • Longitudinal – Subjects are stable over time – Subjects who change over time 31
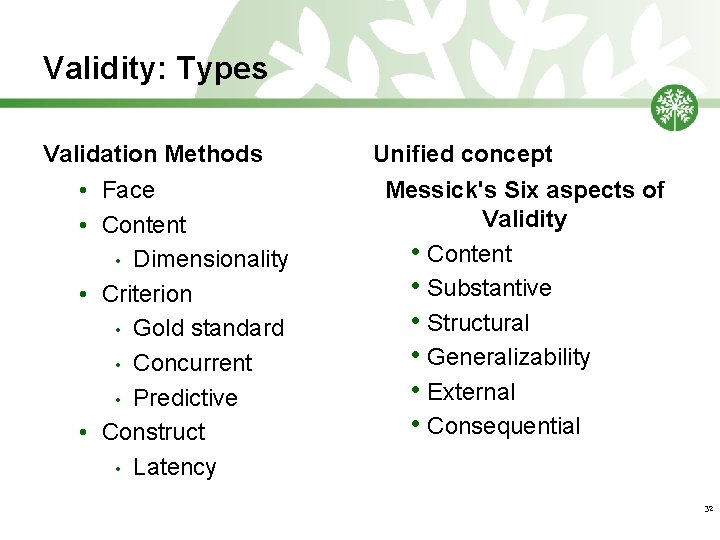
Validity: Types Validation Methods • Face • Content • Dimensionality • Criterion • Gold standard • Concurrent • Predictive • Construct • Latency Unified concept Messick's Six aspects of Validity • Content • Substantive • Structural • Generalizability • External • Consequential 32
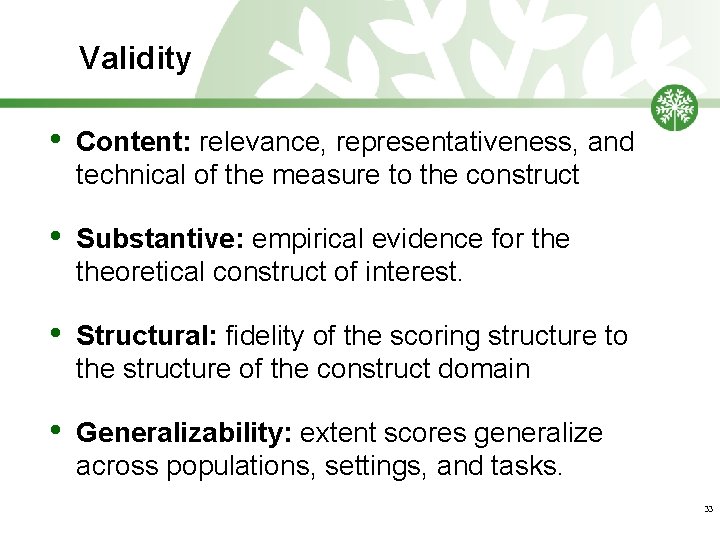
Validity • Content: relevance, representativeness, and technical of the measure to the construct • Substantive: empirical evidence for theoretical construct of interest. • Structural: fidelity of the scoring structure to the structure of the construct domain • Generalizability: extent scores generalize across populations, settings, and tasks. 33
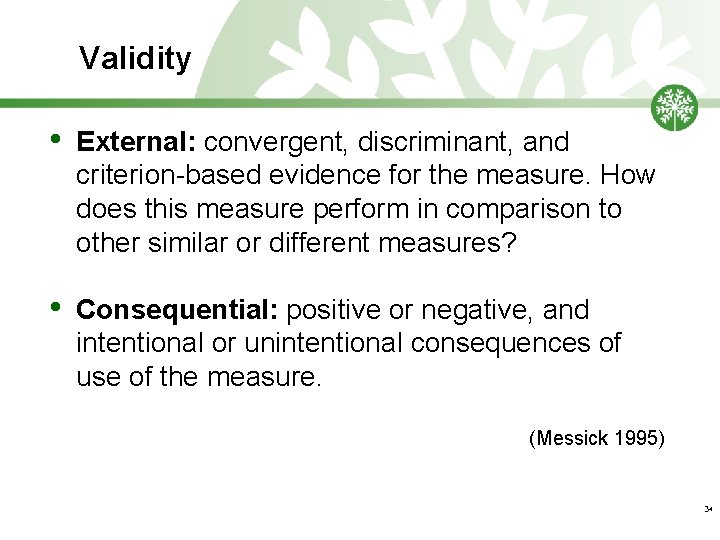
Validity • External: convergent, discriminant, and criterion-based evidence for the measure. How does this measure perform in comparison to other similar or different measures? • Consequential: positive or negative, and intentional or unintentional consequences of use of the measure. (Messick 1995) 34
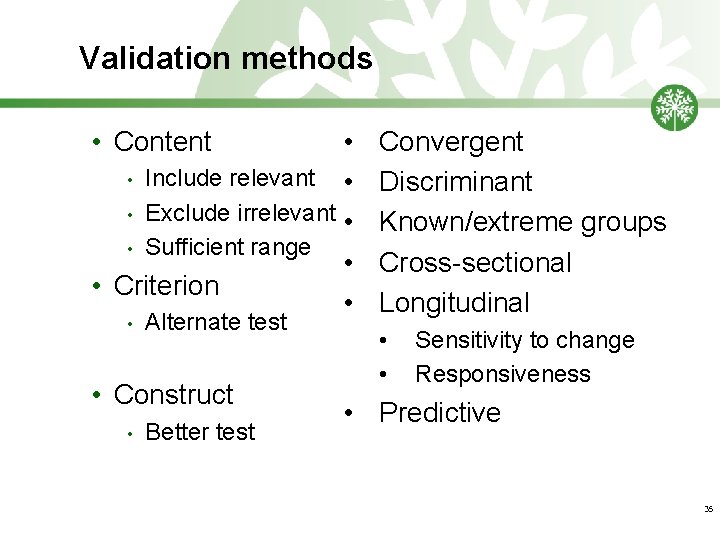
Validation methods • Content • • Include relevant • • Exclude irrelevant • • Sufficient range • • Criterion • • Alternate test • Construct • Better test Convergent Discriminant Known/extreme groups Cross-sectional Longitudinal • • Sensitivity to change Responsiveness • Predictive 35
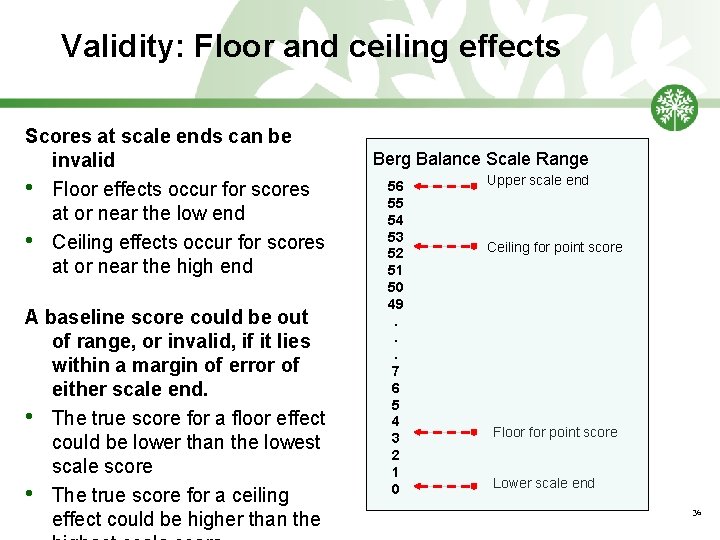
Validity: Floor and ceiling effects Scores at scale ends can be invalid • Floor effects occur for scores at or near the low end • Ceiling effects occur for scores at or near the high end A baseline score could be out of range, or invalid, if it lies within a margin of error of either scale end. • The true score for a floor effect could be lower than the lowest scale score • The true score for a ceiling effect could be higher than the Berg Balance Scale Range 56 55 54 53 52 51 50 49. . . 7 6 5 4 3 2 1 0 Upper scale end Ceiling for point score Floor for point score Lower scale end 36
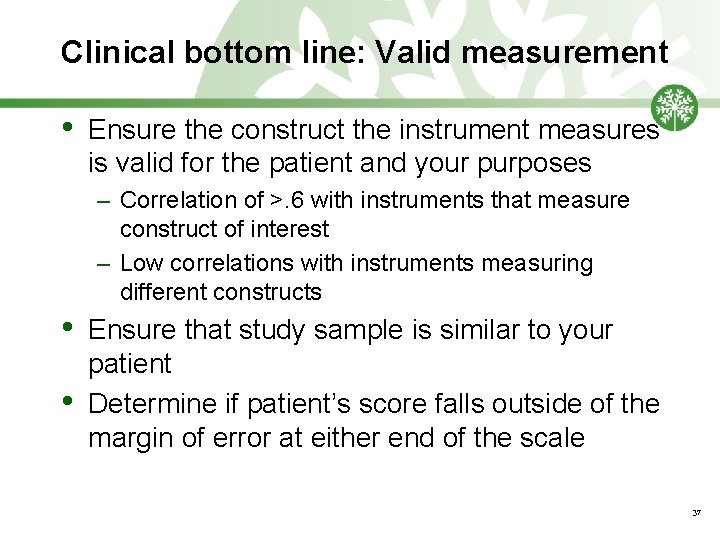
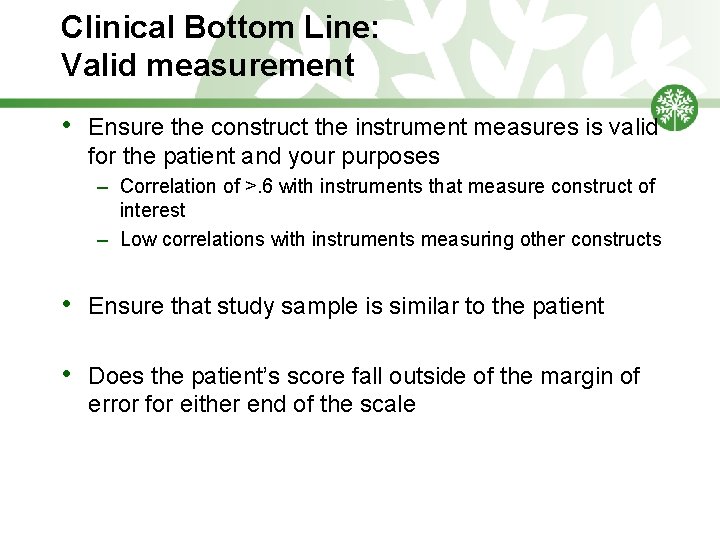
Clinical bottom line: Valid measurement • Ensure the construct the instrument measures is valid for the patient and your purposes – Correlation of >. 6 with instruments that measure construct of interest – Low correlations with instruments measuring different constructs • • Ensure that study sample is similar to your patient Determine if patient’s score falls outside of the margin of error at either end of the scale 37
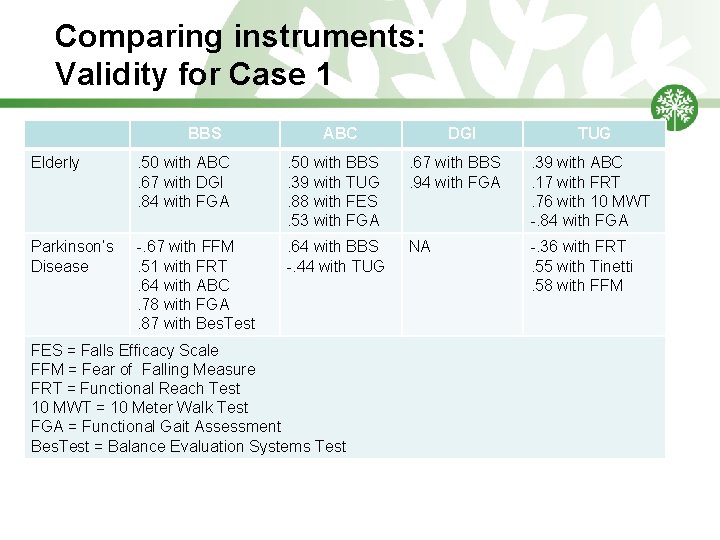
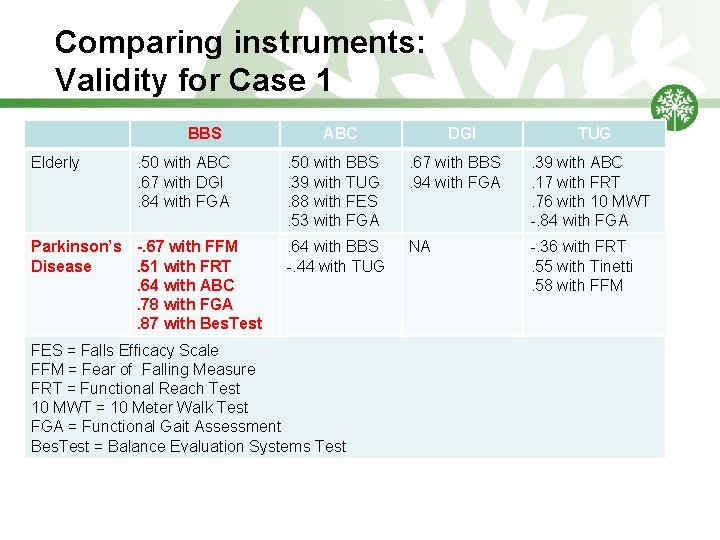
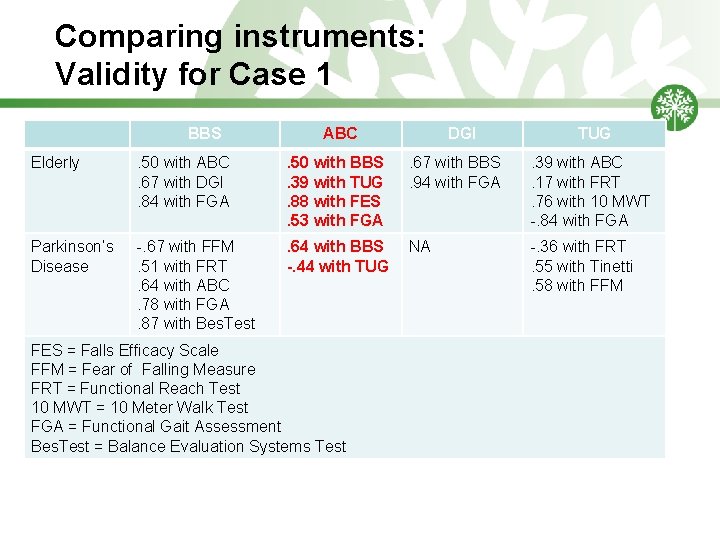
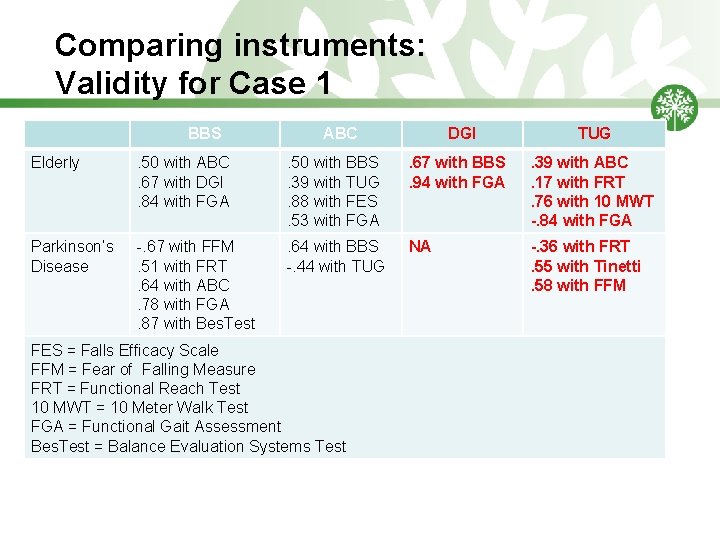
Comparing instruments: Validity for Case 1 BBS ABC DGI TUG Elderly . 50 with ABC. 67 with DGI. 84 with FGA . 50 with BBS. 39 with TUG. 88 with FES. 53 with FGA . 67 with BBS . 94 with FGA . 39 with ABC. 17 with FRT. 76 with 10 MWT -. 84 with FGA Parkinson’s Disease -. 67 with FFM. 51 with FRT. 64 with ABC. 78 with FGA. 87 with Bes. Test . 64 with BBS -. 44 with TUG NA -. 36 with FRT. 55 with Tinetti. 58 with FFM FES = Falls Efficacy Scale FFM = Fear of Falling Measure FRT = Functional Reach Test 10 MWT = 10 Meter Walk Test FGA = Functional Gait Assessment Bes. Test = Balance Evaluation Systems Test
Comparing instruments: Validity for Case 1 BBS Elderly . 50 with ABC. 67 with DGI. 84 with FGA Parkinson’s -. 67 with FFM Disease. 51 with FRT. 64 with ABC. 78 with FGA. 87 with Bes. Test ABC DGI TUG . 50 with BBS. 39 with TUG. 88 with FES. 53 with FGA . 67 with BBS . 94 with FGA . 39 with ABC. 17 with FRT. 76 with 10 MWT -. 84 with FGA . 64 with BBS -. 44 with TUG NA -. 36 with FRT. 55 with Tinetti. 58 with FFM FES = Falls Efficacy Scale FFM = Fear of Falling Measure FRT = Functional Reach Test 10 MWT = 10 Meter Walk Test FGA = Functional Gait Assessment Bes. Test = Balance Evaluation Systems Test
Comparing instruments: Validity for Case 1 BBS ABC DGI TUG Elderly . 50 with ABC. 67 with DGI. 84 with FGA . 50 with BBS. 39 with TUG. 88 with FES. 53 with FGA . 67 with BBS . 94 with FGA . 39 with ABC. 17 with FRT. 76 with 10 MWT -. 84 with FGA Parkinson’s Disease -. 67 with FFM. 51 with FRT. 64 with ABC. 78 with FGA. 87 with Bes. Test . 64 with BBS -. 44 with TUG NA -. 36 with FRT. 55 with Tinetti. 58 with FFM FES = Falls Efficacy Scale FFM = Fear of Falling Measure FRT = Functional Reach Test 10 MWT = 10 Meter Walk Test FGA = Functional Gait Assessment Bes. Test = Balance Evaluation Systems Test
Comparing instruments: Validity for Case 1 BBS ABC DGI TUG Elderly . 50 with ABC. 67 with DGI. 84 with FGA . 50 with BBS. 39 with TUG. 88 with FES. 53 with FGA . 67 with BBS. 94 with FGA . 39 with ABC. 17 with FRT. 76 with 10 MWT -. 84 with FGA Parkinson’s Disease -. 67 with FFM. 51 with FRT. 64 with ABC. 78 with FGA. 87 with Bes. Test . 64 with BBS -. 44 with TUG NA -. 36 with FRT. 55 with Tinetti. 58 with FFM FES = Falls Efficacy Scale FFM = Fear of Falling Measure FRT = Functional Reach Test 10 MWT = 10 Meter Walk Test FGA = Functional Gait Assessment Bes. Test = Balance Evaluation Systems Test
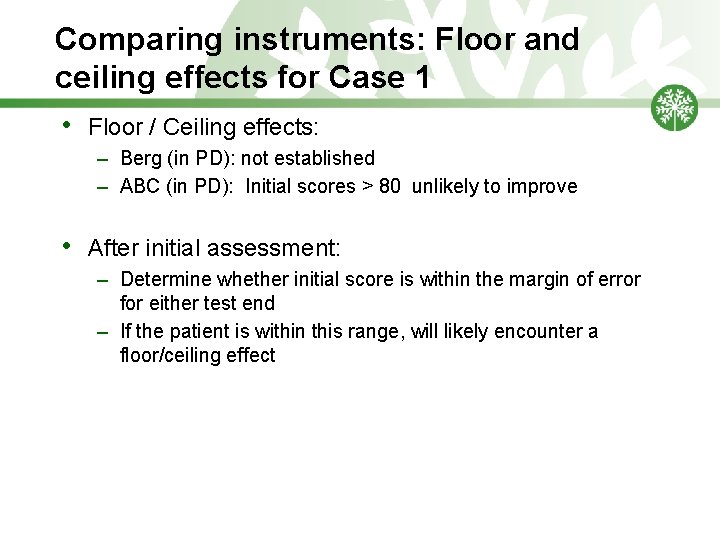
Comparing instruments: Floor and ceiling effects for Case 1 • Floor / Ceiling effects: – Berg (in PD): not established – ABC (in PD): Initial scores > 80 unlikely to improve • After initial assessment: – Determine whether initial score is within the margin of error for either test end – If the patient is within this range, will likely encounter a floor/ceiling effect
Clinical Bottom Line: Valid measurement • Ensure the construct the instrument measures is valid for the patient and your purposes – Correlation of >. 6 with instruments that measure construct of interest – Low correlations with instruments measuring other constructs • Ensure that study sample is similar to the patient • Does the patient’s score fall outside of the margin of error for either end of the scale
Classroom Activity: Validity • ACTIVITY: Use online resources to identify validity information for the instruments you chose • Record the information on the worksheet provided • Determine whethere are specific considerations for your situation • The group will report back interesting findings 44
Interpreting scores 45
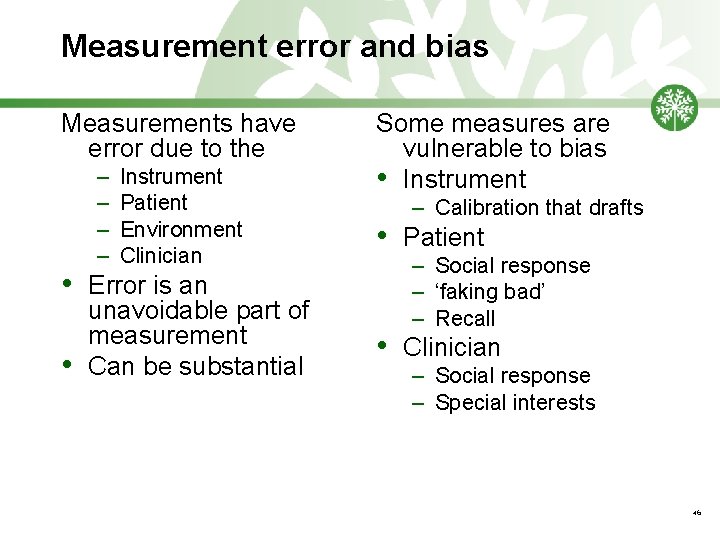
Measurement error and bias Measurements have error due to the • • – – Instrument Patient Environment Clinician Error is an unavoidable part of measurement Can be substantial Some measures are vulnerable to bias • Instrument – Calibration that drafts • Patient • Clinician – Social response – ‘faking bad’ – Recall – Social response – Special interests 46
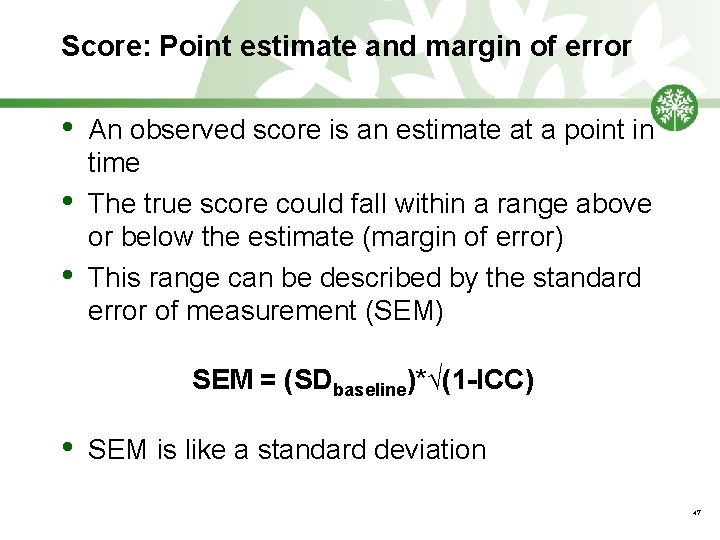
Score: Point estimate and margin of error • • • An observed score is an estimate at a point in time The true score could fall within a range above or below the estimate (margin of error) This range can be described by the standard error of measurement (SEM) SEM = (SDbaseline)*√(1 -ICC) • SEM is like a standard deviation 47
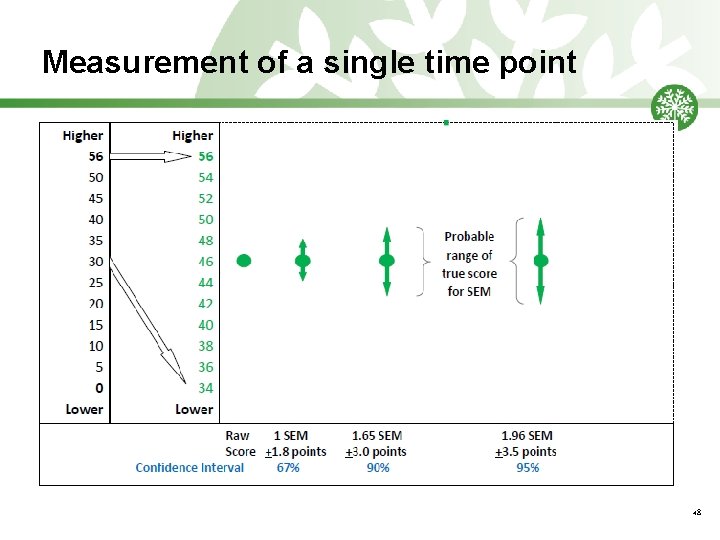
Measurement of a single time point 48
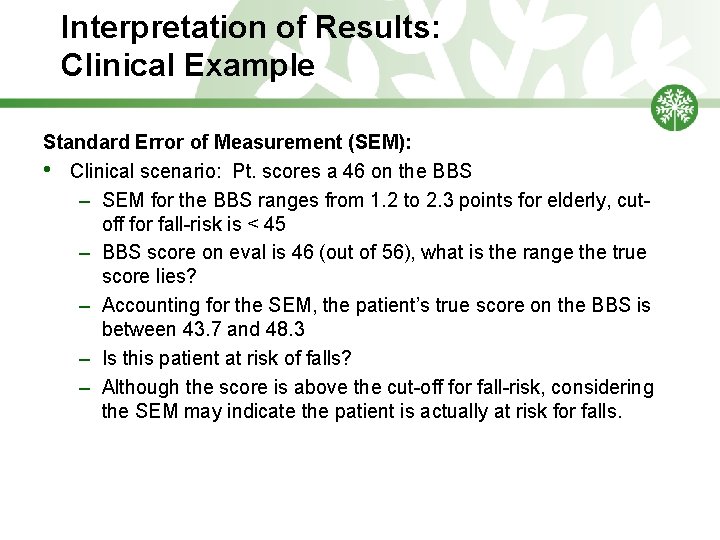
Interpretation of Results: Clinical Example Standard Error of Measurement (SEM): • Clinical scenario: Pt. scores a 46 on the BBS – SEM for the BBS ranges from 1. 2 to 2. 3 points for elderly, cutoff for fall-risk is < 45 – BBS score on eval is 46 (out of 56), what is the range the true score lies? – Accounting for the SEM, the patient’s true score on the BBS is between 43. 7 and 48. 3 – Is this patient at risk of falls? – Although the score is above the cut-off for fall-risk, considering the SEM may indicate the patient is actually at risk for falls.
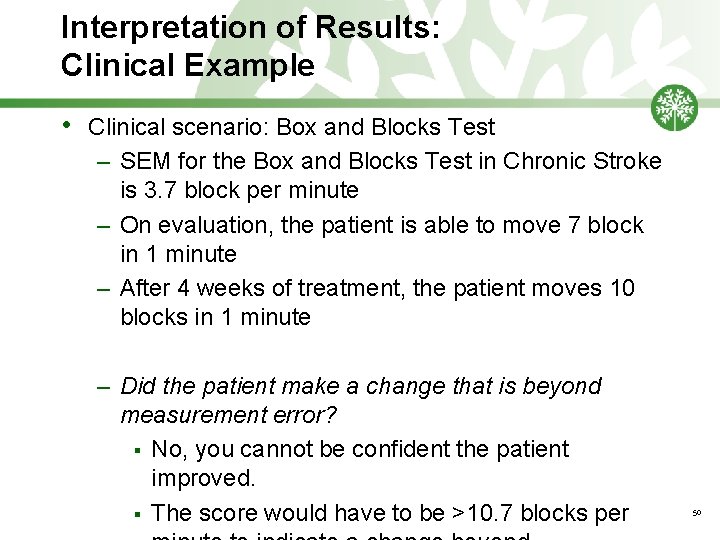
Interpretation of Results: Clinical Example • Clinical scenario: Box and Blocks Test – SEM for the Box and Blocks Test in Chronic Stroke is 3. 7 block per minute – On evaluation, the patient is able to move 7 block in 1 minute – After 4 weeks of treatment, the patient moves 10 blocks in 1 minute – Did the patient make a change that is beyond measurement error? § No, you cannot be confident the patient improved. § The score would have to be >10. 7 blocks per 50
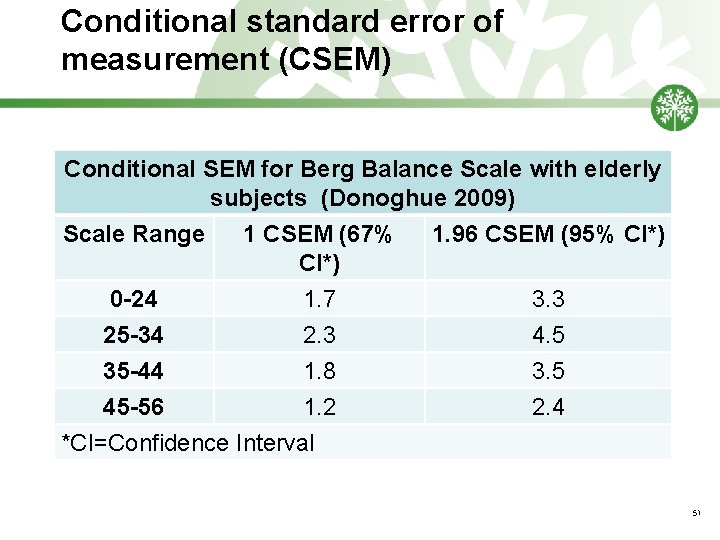
Conditional standard error of measurement (CSEM) Conditional SEM for Berg Balance Scale with elderly subjects (Donoghue 2009) Scale Range 1 CSEM (67% CI*) 0 -24 1. 7 25 -34 2. 3 35 -44 1. 8 45 -56 1. 2 *CI=Confidence Interval 1. 96 CSEM (95% CI*) 3. 3 4. 5 3. 5 2. 4 51
Interpreting score for prediction 52
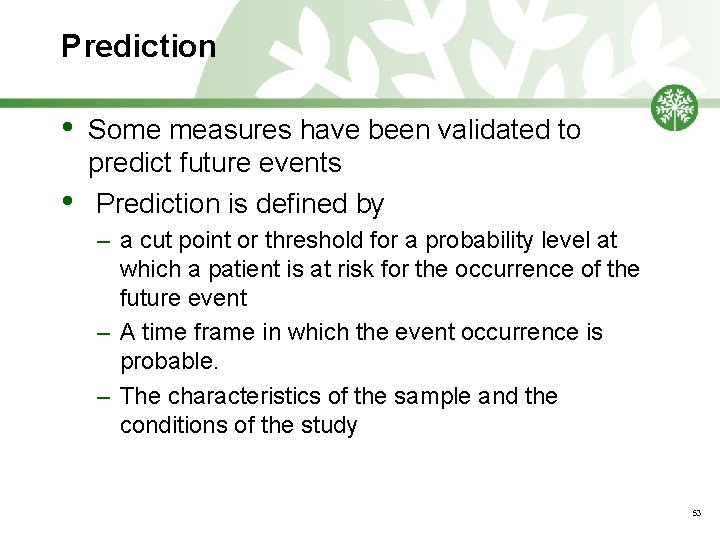
Prediction • • Some measures have been validated to predict future events Prediction is defined by – a cut point or threshold for a probability level at which a patient is at risk for the occurrence of the future event – A time frame in which the event occurrence is probable. – The characteristics of the sample and the conditions of the study 53
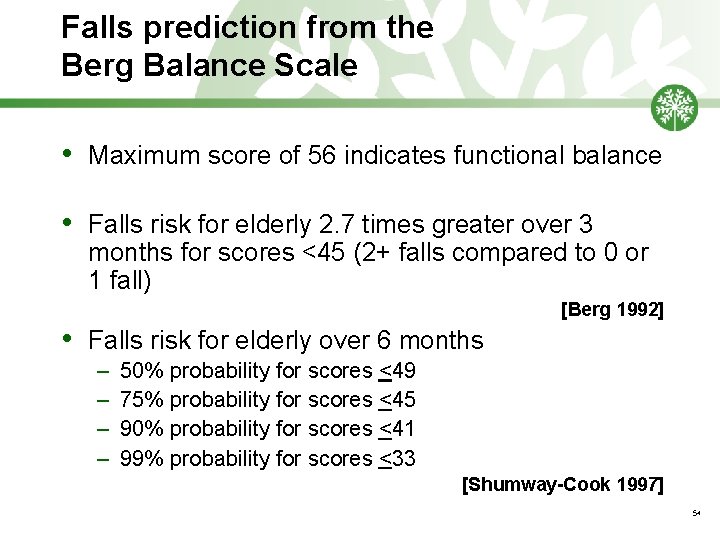
Falls prediction from the Berg Balance Scale • Maximum score of 56 indicates functional balance • Falls risk for elderly 2. 7 times greater over 3 months for scores <45 (2+ falls compared to 0 or 1 fall) • [Berg 1992] Falls risk for elderly over 6 months – – 50% probability for scores <49 75% probability for scores <45 90% probability for scores <41 99% probability for scores <33 [Shumway-Cook 1997] 54
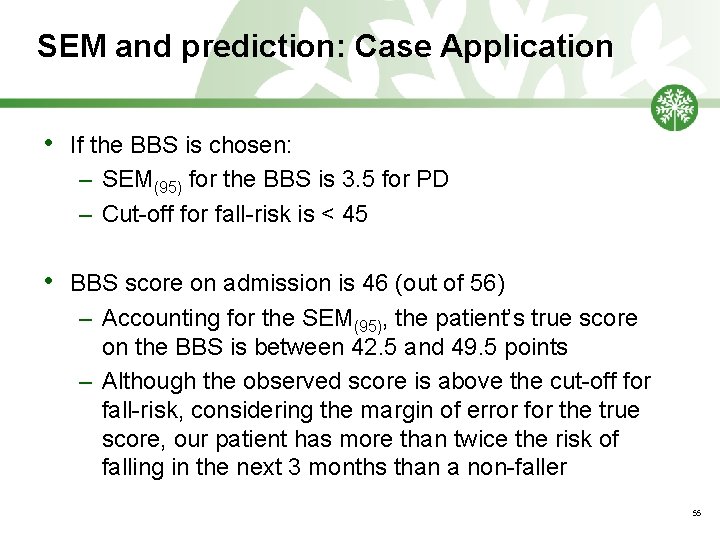
SEM and prediction: Case Application • If the BBS is chosen: – SEM(95) for the BBS is 3. 5 for PD – Cut-off for fall-risk is < 45 • BBS score on admission is 46 (out of 56) – Accounting for the SEM(95), the patient’s true score on the BBS is between 42. 5 and 49. 5 points – Although the observed score is above the cut-off for fall-risk, considering the margin of error for the true score, our patient has more than twice the risk of falling in the next 3 months than a non-faller 55
Interpreting change over time 56
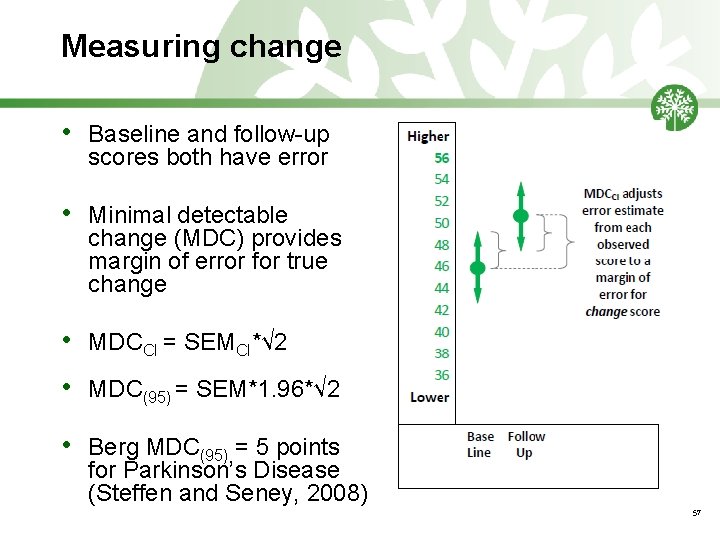
Measuring change • Baseline and follow-up scores both have error • Minimal detectable change (MDC) provides margin of error for true change • MDCCI = SEMCI*√ 2 • MDC(95) = SEM*1. 96*√ 2 • Berg MDC(95) = 5 points for Parkinson’s Disease (Steffen and Seney, 2008) 57
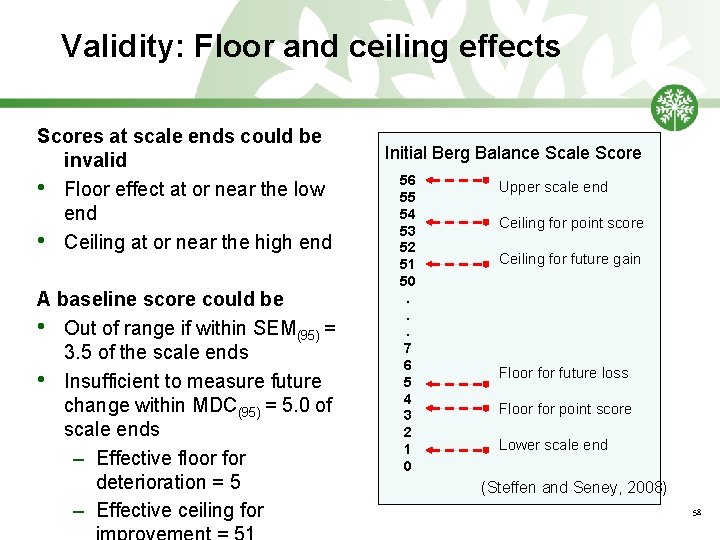
Validity: Floor and ceiling effects Scores at scale ends could be invalid • Floor effect at or near the low end • Ceiling at or near the high end A baseline score could be • Out of range if within SEM(95) = 3. 5 of the scale ends • Insufficient to measure future change within MDC(95) = 5. 0 of scale ends – Effective floor for deterioration = 5 – Effective ceiling for Initial Berg Balance Scale Score 56 55 54 53 52 51 50. . . 7 6 5 4 3 2 1 0 Upper scale end Ceiling for point score Ceiling for future gain Floor future loss Floor for point score Lower scale end (Steffen and Seney, 2008) 58
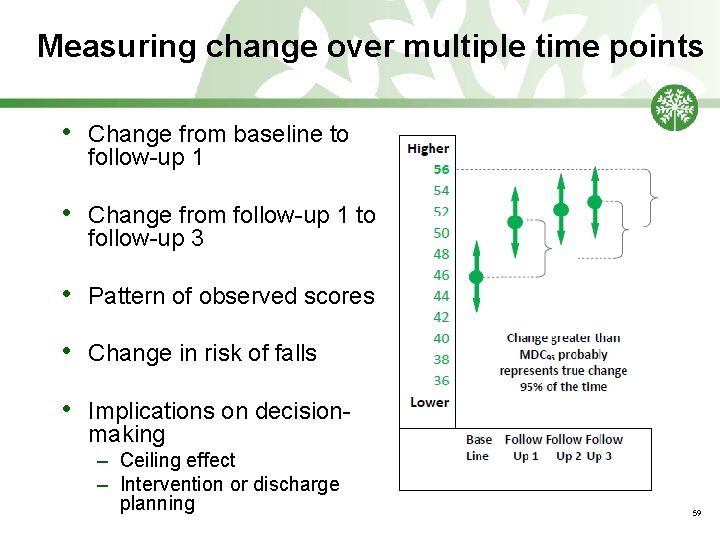
Measuring change over multiple time points • Change from baseline to follow-up 1 • Change from follow-up 1 to follow-up 3 • Pattern of observed scores • Change in risk of falls • Implications on decisionmaking – Ceiling effect – Intervention or discharge planning 59
MDC: Impact on clinical decision-making • The time period in which a MDC should be achieved is unknown – Look for trends toward achieving MDC – Should be within a reasonable time period (how long does it take to achieve similar results in similar patients in the research literature? ) • Slowing in progress could indicate: – Approaching plateau, discharge should be considered – Intervention, frequency, intensity should be changed to maximize outcomes 60
Interpretation of Results: Clinical Example Minimal Detectable Change (MDC): • Clinical scenario: – MDC in Parkinson’s Disease for comfortable gait speed is. 18 m/s – Gait speed on initial evaluation is. 4 m/s, at reevaluation is. 53 m/s – Did this patient make a true change in speed? – Although change was demonstrated in gait speed, the change was not sufficient to demonstrate a true change
Interpretation of Results: Clinical Example MDC Clinical Scenario: Disabilities of the Arm, Shoulder, and Hand Questionnaire (DASH) • The MDC on the DASH in athletes is 10 points. • A patient scores 67 out of 100 on the instrument • What is the minimum score a patient must achieve at the follow-up test to be confident a change has occurred? – 77 out of 100 • If the patient does NOT score a 77 at the next test, what information would help you decide whether a change (although not substantial change) has occurred? – The SEM – if the patient increases the score beyond the SEM, you can assume a change has been made (although not a substantial/meaningful change) – SEM in athletes is 3. 61 points 62
Measuring change over three or more time points • When to re-administer – Discharge only: no information during intervention – Expect change to exceed MDCCI – Critical decision points: e. g. , team meetings • Time trade off – more assessments provide more information – more burden, particularly for clinician-rated instruments 63
Interpreting important change 64
Measuring important change • • • Minimal detectable change (MDC) provides the margin of error for true change – Calculated from test-retest reliability sample Minimal clinically important difference (MCID) provides an index of important change – Anchored to patient, clinician, or other threshold for important change – Estimated in many ways from different research studies Change must be detectable to be important – Cannot have important change that cannot be detected – MCID for instrument and sample similar to your patient must meet or exceed MDC 65
Interpretation of Results: Clinical Example Minimally Clinically Important Difference (MCID): • Clinical Scenario: – MCID for 6 MWT for geriatrics and acute stroke is 50 m (164 feet) – 6 MWT on initial evaluation was 380 feet, at re-evaluation it was 570 feet – Considering the MCID, this change in 6 MWT likely enabled the patient to experience a noticeable change in function
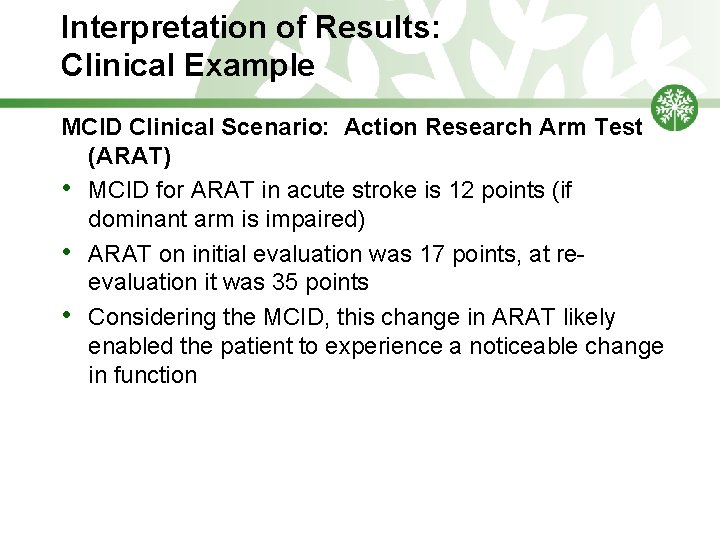
Interpretation of Results: Clinical Example MCID Clinical Scenario: Action Research Arm Test (ARAT) • MCID for ARAT in acute stroke is 12 points (if dominant arm is impaired) • ARAT on initial evaluation was 17 points, at reevaluation it was 35 points • Considering the MCID, this change in ARAT likely enabled the patient to experience a noticeable change in function
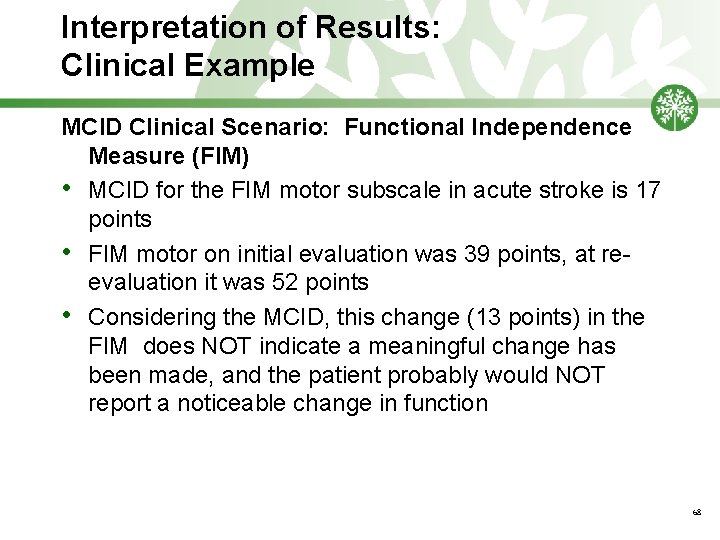
Interpretation of Results: Clinical Example MCID Clinical Scenario: Functional Independence Measure (FIM) • MCID for the FIM motor subscale in acute stroke is 17 points • FIM motor on initial evaluation was 39 points, at reevaluation it was 52 points • Considering the MCID, this change (13 points) in the FIM does NOT indicate a meaningful change has been made, and the patient probably would NOT report a noticeable change in function 68
Classroom Activity: Interpretation of Results • ACTIVITY: Use online resources to identify any information available to assist in interpretation of the test results • Record the information on the worksheet provided • Determine whethere are specific considerations for your situation • The group will report back interesting findings 69
Predicting outcomes 70
Predicting outcomes • • • Instruments validated to measure change can be used to predict outcomes and plan treatment – Expected scores at key time points during intervention – Expected score at discharge – Set specific dates for expected scores, not ranges Measurable change must be detectable with the instrument used with a sample similar to your patient – Plan to reassess when change greater than MDC is expected – Can reassess at set times (e. g. , for weekly team meetings) even if change is not expected – Change greater than MCID is clinically important Series of scores at specific dates can plot a recovery curve 71
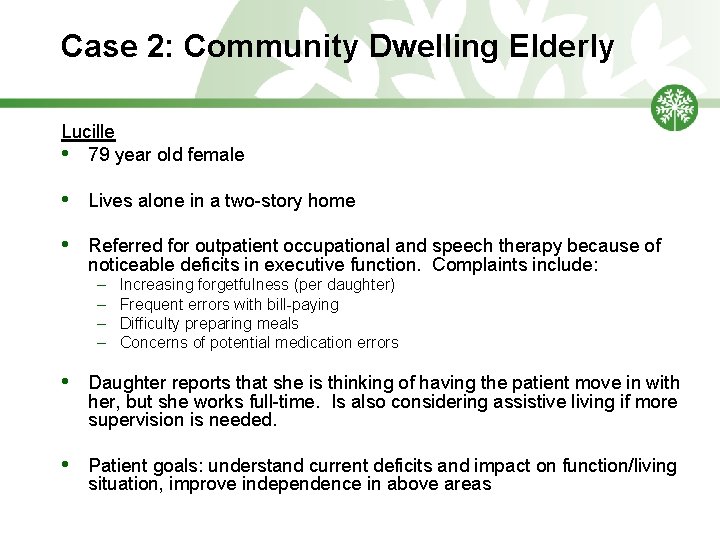
Case 2: Community Dwelling Elderly Lucille • 79 year old female • Lives alone in a two-story home • Referred for outpatient occupational and speech therapy because of noticeable deficits in executive function. Complaints include: – – Increasing forgetfulness (per daughter) Frequent errors with bill-paying Difficulty preparing meals Concerns of potential medication errors • Daughter reports that she is thinking of having the patient move in with her, but she works full-time. Is also considering assistive living if more supervision is needed. • Patient goals: understand current deficits and impact on function/living situation, improve independence in above areas
Potential assessment areas Case 2: Community Dwelling Elderly • Establish current status & understand extent of deficits (discriminate and screen) • Determine assistance required for daily living • Monitor improvements or decline in cognitive functioning (change over time)
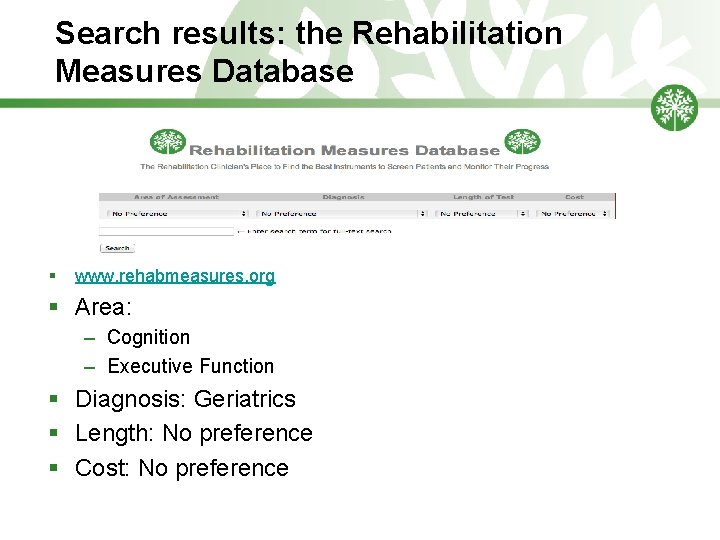
Search results: the Rehabilitation Measures Database § www. rehabmeasures. org § Area: – Cognition – Executive Function § Diagnosis: Geriatrics § Length: No preference § Cost: No preference
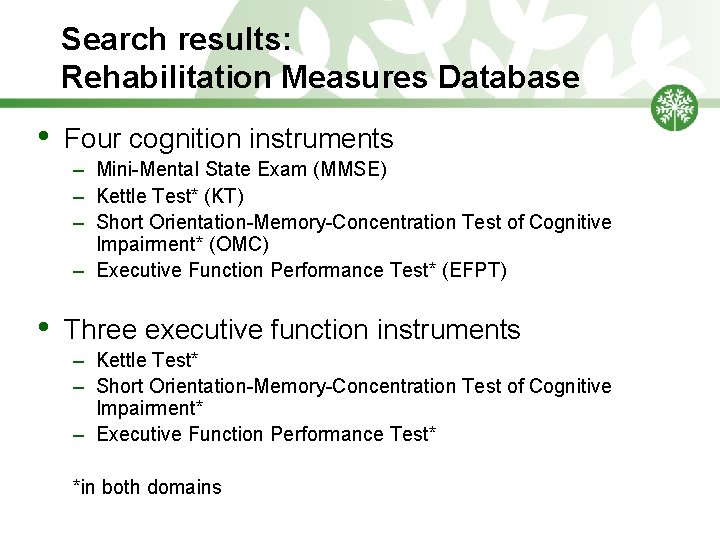
Search results: Rehabilitation Measures Database • Four cognition instruments – Mini-Mental State Exam (MMSE) – Kettle Test* (KT) – Short Orientation-Memory-Concentration Test of Cognitive Impairment* (OMC) – Executive Function Performance Test* (EFPT) • Three executive function instruments – Kettle Test* – Short Orientation-Memory-Concentration Test of Cognitive Impairment* – Executive Function Performance Test* *in both domains
• Review the information gathered about the instruments – Select the best instrument for your situation – Determine appropriate testing times (initial eval, every 2 weeks, DC, etc) – Describe any limitations to using the selected instrument • Report back to the group – Rationale for selected instrument – Limitations to using the instrument 76
Classroom Activity: Instrument Selection and Utilization • ACTIVITY: Review the information gathered about the instruments • Select the best instrument for your situation • Determine appropriate testing times (initial eval, every 2 weeks, DC, etc) • Describe any limitations to using the selected instrument • Report back to group: your case, measures you considered, why you chose the one you selected 77
Summary and review • • • What is inter-rater reliability? What is internal consistency? What is test-retest reliability? What measurement properties should clinical outcome instruments demonstrate? – For interpreting a score at a single point in time? – For prediction of a future event? – For interpreting change over two or more time points? How are minimally clinically important differences (MCID) of value to clinicians? How are MCIDs different from minimal detectable change (MDC)? 78
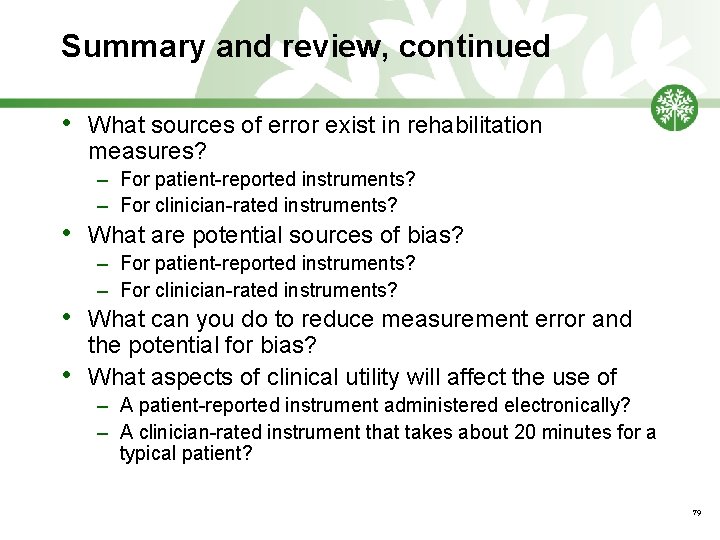
Summary and review, continued • • What sources of error exist in rehabilitation measures? – For patient-reported instruments? – For clinician-rated instruments? What are potential sources of bias? – For patient-reported instruments? – For clinician-rated instruments? What can you do to reduce measurement error and the potential for bias? What aspects of clinical utility will affect the use of – A patient-reported instrument administered electronically? – A clinician-rated instrument that takes about 20 minutes for a typical patient? 79
Review of Case 2 Application: Cognition 80
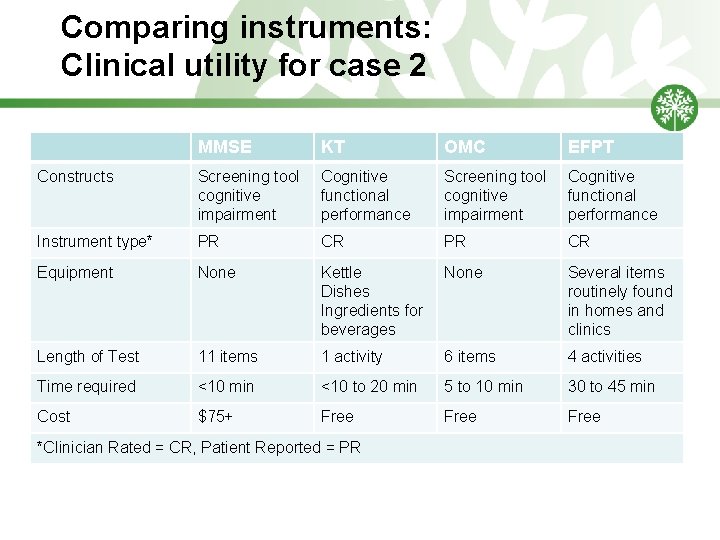
Comparing instruments: Clinical utility for case 2 MMSE KT OMC EFPT Constructs Screening tool cognitive impairment Cognitive functional performance Instrument type* PR CR Equipment None Kettle Dishes Ingredients for beverages None Several items routinely found in homes and clinics Length of Test 11 items 1 activity 6 items 4 activities Time required <10 min <10 to 20 min 5 to 10 min 30 to 45 min Cost $75+ Free *Clinician Rated = CR, Patient Reported = PR
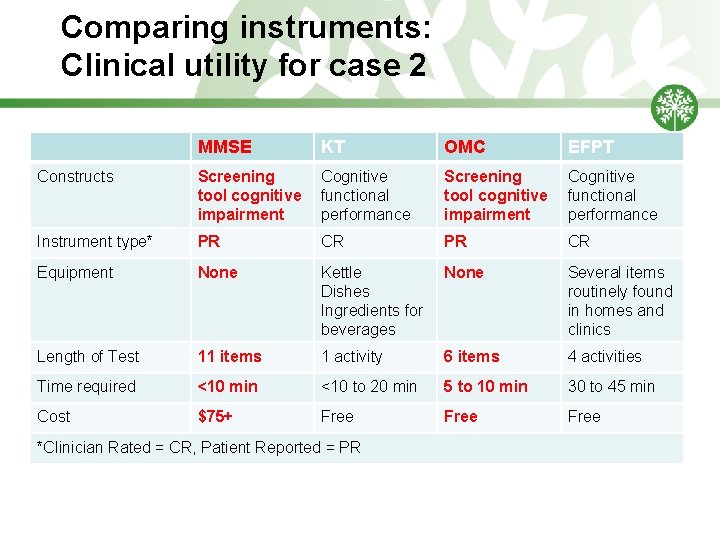
Comparing instruments: Clinical utility for case 2 MMSE KT OMC EFPT Constructs Screening tool cognitive impairment Cognitive functional performance Instrument type* PR CR Equipment None Kettle Dishes Ingredients for beverages None Several items routinely found in homes and clinics Length of Test 11 items 1 activity 6 items 4 activities Time required <10 min <10 to 20 min 5 to 10 min 30 to 45 min Cost $75+ Free *Clinician Rated = CR, Patient Reported = PR
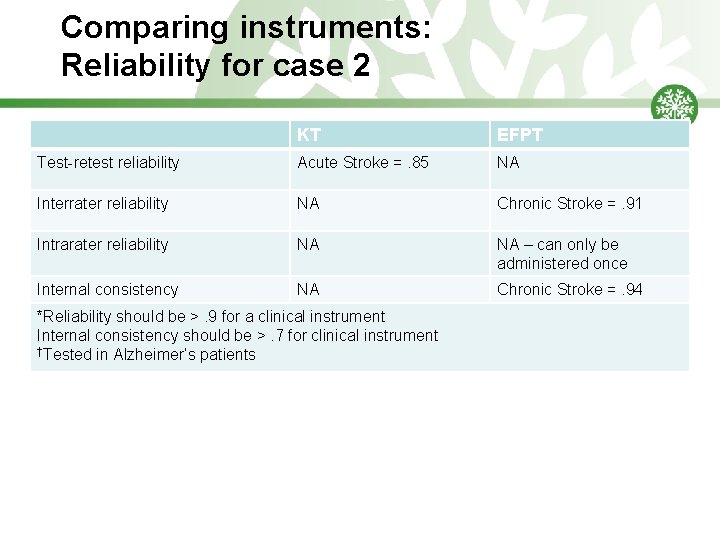
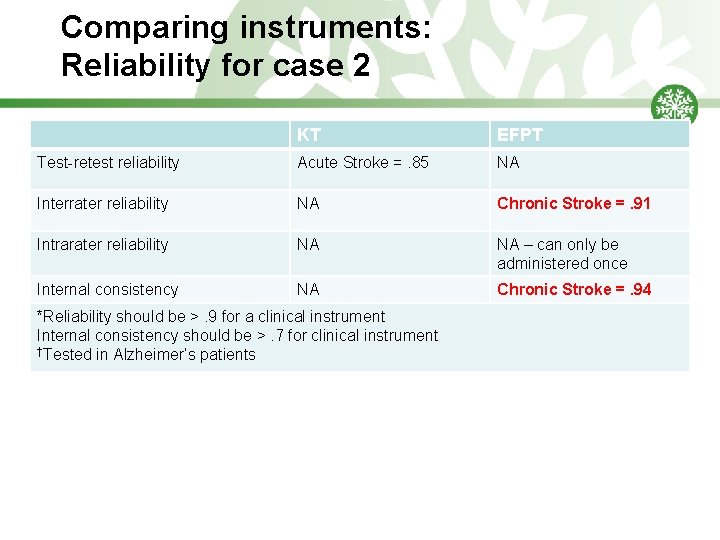
Comparing instruments: Reliability for case 2 KT EFPT Test-retest reliability Acute Stroke =. 85 NA Interrater reliability NA Chronic Stroke =. 91 Intrarater reliability NA NA – can only be administered once Internal consistency NA Chronic Stroke =. 94 *Reliability should be >. 9 for a clinical instrument Internal consistency should be >. 7 for clinical instrument †Tested in Alzheimer’s patients
Comparing instruments: Reliability for case 2 KT EFPT Test-retest reliability Acute Stroke =. 85 NA Interrater reliability NA Chronic Stroke =. 91 Intrarater reliability NA NA – can only be administered once Internal consistency NA Chronic Stroke =. 94 *Reliability should be >. 9 for a clinical instrument Internal consistency should be >. 7 for clinical instrument †Tested in Alzheimer’s patients
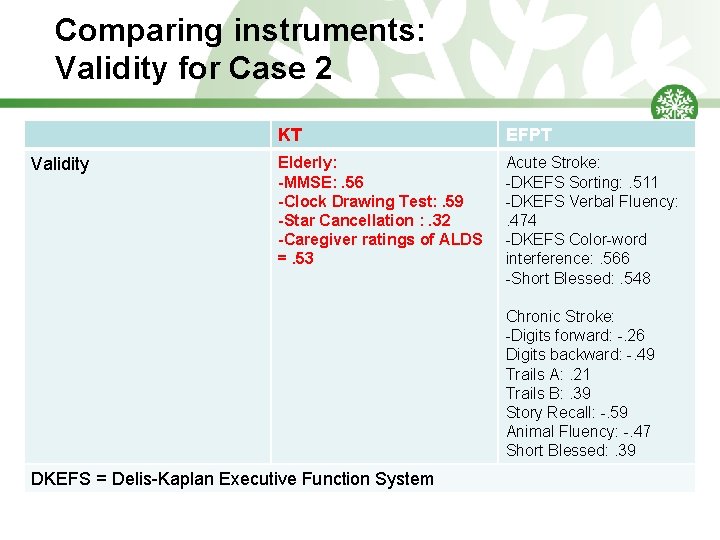
Comparing instruments: Validity for Case 2 Validity KT EFPT Elderly: -MMSE: . 56 -Clock Drawing Test: . 59 -Star Cancellation : . 32 -Caregiver ratings of ALDS =. 53 Acute Stroke: -DKEFS Sorting: . 511 -DKEFS Verbal Fluency: . 474 -DKEFS Color-word interference: . 566 -Short Blessed: . 548 Chronic Stroke: -Digits forward: -. 26 Digits backward: -. 49 Trails A: . 21 Trails B: . 39 Story Recall: -. 59 Animal Fluency: -. 47 Short Blessed: . 39 DKEFS = Delis-Kaplan Executive Function System
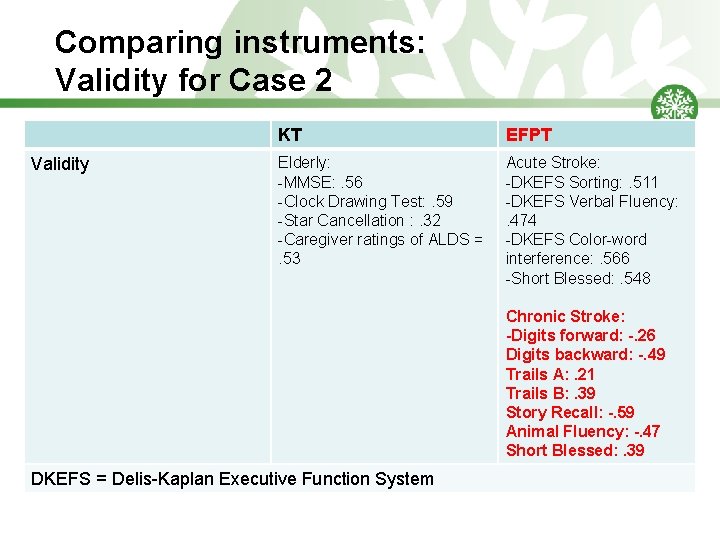
Comparing instruments: Validity for Case 2 Validity KT EFPT Elderly: -MMSE: . 56 -Clock Drawing Test: . 59 -Star Cancellation : . 32 -Caregiver ratings of ALDS = . 53 Acute Stroke: -DKEFS Sorting: . 511 -DKEFS Verbal Fluency: . 474 -DKEFS Color-word interference: . 566 -Short Blessed: . 548 Chronic Stroke: -Digits forward: -. 26 Digits backward: -. 49 Trails A: . 21 Trails B: . 39 Story Recall: -. 59 Animal Fluency: -. 47 Short Blessed: . 39 DKEFS = Delis-Kaplan Executive Function System
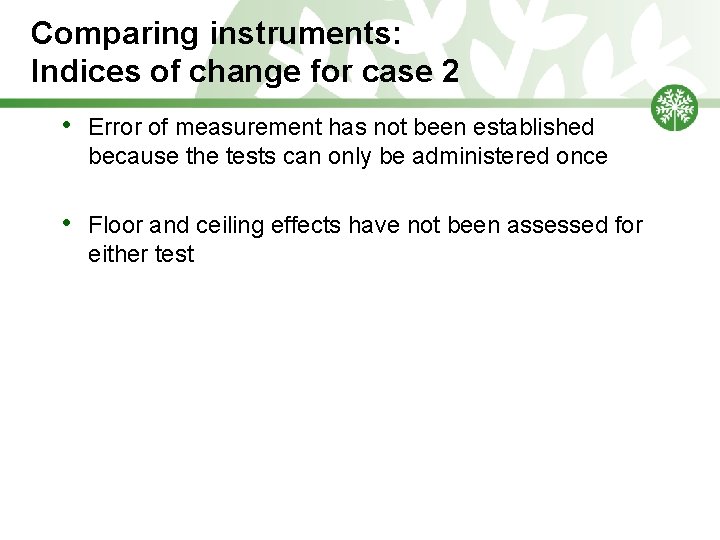
Comparing instruments: Indices of change for case 2 • Error of measurement has not been established because the tests can only be administered once • Floor and ceiling effects have not been assessed for either test
Questions and Discussion 88
Project Staff • • Allen Heinemann, Ph. D – Director of CROR, at Rehabilitation Institute of Chicago, Northwestern University PM&R Joy Hammel, Ph. D, OTR/L, FAOTA – Professor, Occupational Therapy and Disability Studies, University of Illinois at Chicago Carolyn M. Baum, Ph. D, OTR/L, FAOTA – Professor, Occupational Therapy, Neurology and Social Work, Washington University School of Medicine Jennifer Moore, PT, DHS, NCS – Clinical Practice Leader, Neurological Physical Therapy, Rehabilitation Institute of Chicago Jennifer Piatt, Ph. D, CTRS – Assistant Professor, Recreational Therapy, Public Health, Indiana University Kirsten Potter, PT, DPT, MS, NCS – Associate Professor, Physical Therapy, Rockhurst University Jillian Bateman, OTD/OTR/L, CCRC – Project Manager, CROR Rehabilitation Institute of Chicago 89
Project Contributors • • • Anne Deutsch, Ph. D – Clinical Research Scientist, Rehabilitation Institute of Chicago Richard Gershon, Ph. D – Professor and Associate Chair, Medical and Social Sciences, Northwestern University Allan Kozlowski, PT, Ph. D – Clinical Research Scientist, Mt. Sinai School of Medicine Jason Raad, Ph. D – Project Manager, CROR, Rehabilitation Institute of Chicago Kathleen Stevens, Ph. D RN –Nursing Education, Rehabilitation Institute of Chicago, Northwestern University PM&R 90
References • • Messick S. Validity of psychological assessment: Validation of inferences from persons' responses and performances as scientific inquiry into score meaning. Am Psychol 1995 Sept; 50(9): 741 -749. Donoghue D, Stokes EK. How much change is true change? The minimum detectable change of the Berg Balance Scale in elderly people. J Rehabil Med 2009; 41(5): 343 -346. Berg KO, Maki BE, Williams JI, Holliday PJ, Wood. Dauphinee SL. Clinical and laboratory measures of postural balance in an elderly population. Arch Phys Med Rehabil 1992; 73(11): 1073 -1080. Shumway-Cook A, Baldwin M, Polissar NL, Gruber W. Predicting the probability for falls in community- 91
References • • Steffen T, Seney M. Test-retest reliability and minimal detectable change on balance and ambulation tests, the 36 -item short-form health survey, and the unified Parkinson disease rating scale in people with parkinsonism. Physical Therapy 2008; 88(6): 733 -746. Baum CM, Connor LT, Morrison T, Hahn M, Dromerick AW, Edwards DF. Reliability, validity, and clinical utility of the Executive Function Performance Test: A measure of executive function in a sample of people with stroke. Am J Occup Ther Jul- Aug 2008; 62(4): 446 -55. 92
Copyright Information © 2013 by the Rehabilitation Institute of Chicago. This work is licensed under a Creative Commons license at http: //creativecommons. org/licenses/by-ncnd/3. 0/deed. en_US. You are free to copy, distribute, and transmit the work, subject to the conditions listed in the license. For permission to modify this work or to use it for commercial purposes, please e-mail Allen Heinemann at aheinemann@ric. org. 93