
Module 2 Recitation 2 Concept questions on vt
- Slides: 27
Module 2, Recitation 2 Concept questions on v-t graphs
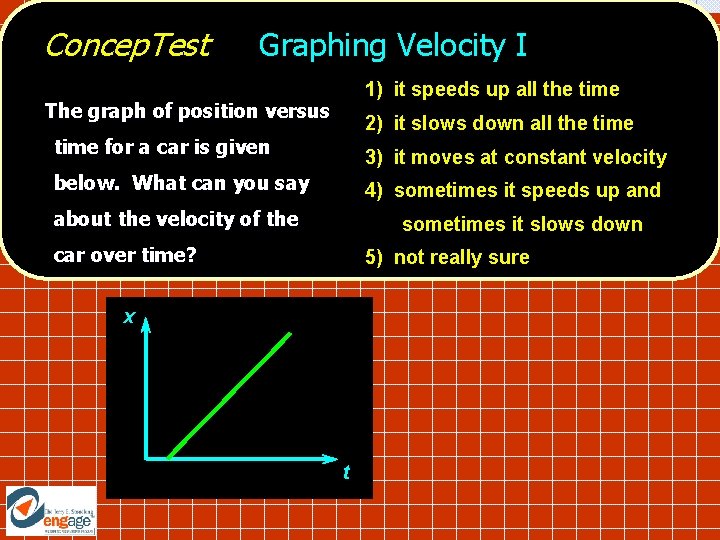
Concep. Test Graphing Velocity I 1) it speeds up all the time The graph of position versus 2) it slows down all the time for a car is given 3) it moves at constant velocity below. What can you say 4) sometimes it speeds up and about the velocity of the sometimes it slows down car over time? 5) not really sure x t
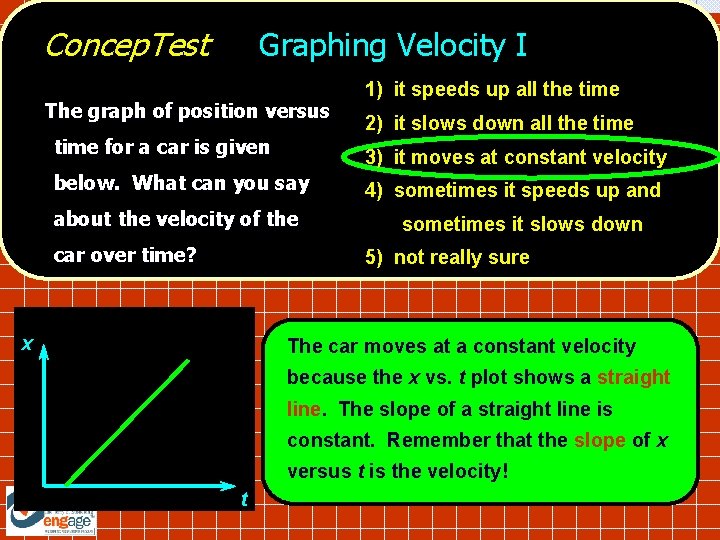
Concep. Test Graphing Velocity I The graph of position versus 1) it speeds up all the time 2) it slows down all the time for a car is given 3) it moves at constant velocity below. What can you say 4) sometimes it speeds up and about the velocity of the car over time? sometimes it slows down 5) not really sure x The car moves at a constant velocity because the x vs. t plot shows a straight line. The slope of a straight line is constant. Remember that the slope of x versus t is the velocity! t
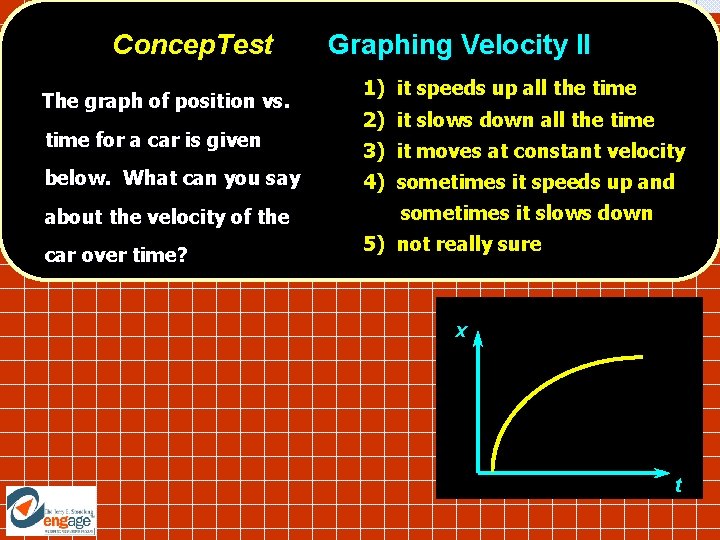
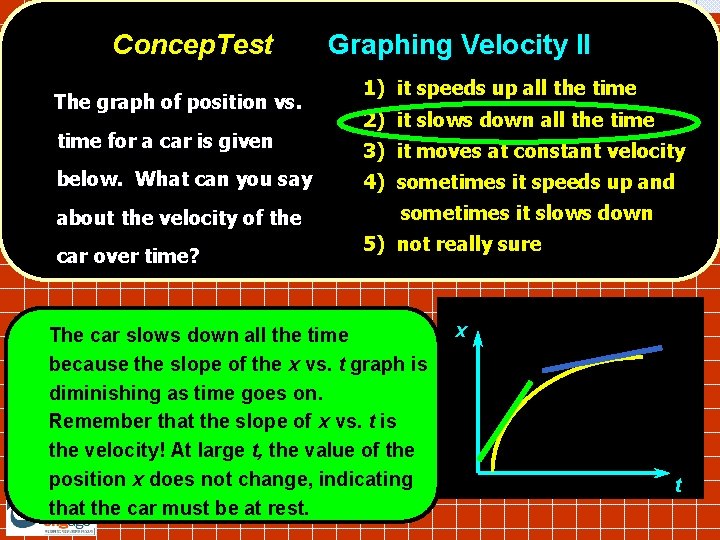
Concep. Test The graph of position vs. time for a car is given below. What can you say about the velocity of the car over time? Graphing Velocity II 1) it speeds up all the time 2) it slows down all the time 3) it moves at constant velocity 4) sometimes it speeds up and sometimes it slows down 5) not really sure x t
Concep. Test The graph of position vs. time for a car is given below. What can you say about the velocity of the car over time? Graphing Velocity II 1) it speeds up all the time 2) it slows down all the time 3) it moves at constant velocity 4) sometimes it speeds up and sometimes it slows down 5) not really sure The car slows down all the time because the slope of the x vs. t graph is diminishing as time goes on. Remember that the slope of x vs. t is the velocity! At large t, the value of the position x does not change, indicating that the car must be at rest. x t
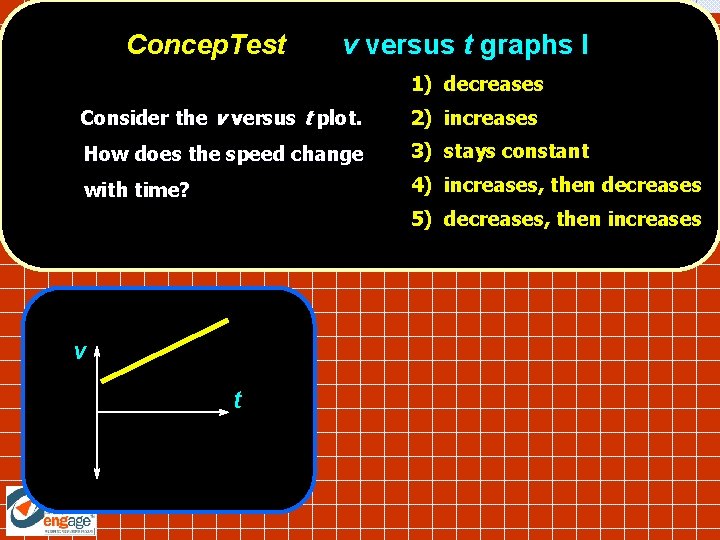
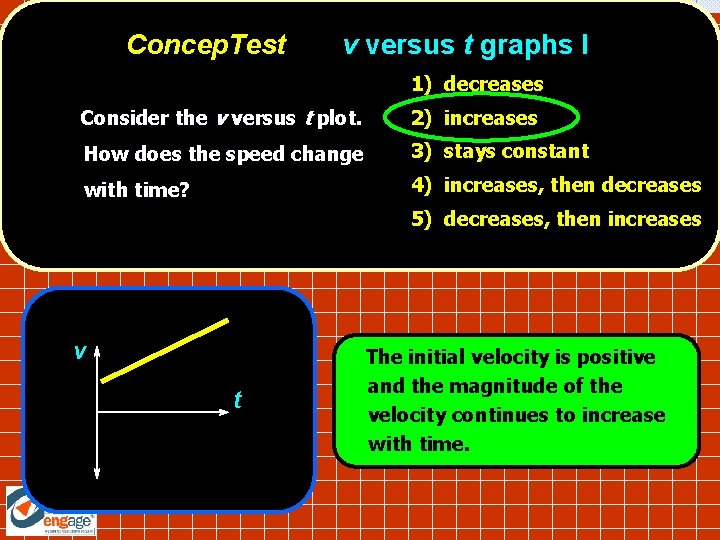
Concep. Test v versus t graphs I 1) decreases Consider the v versus t plot. 2) increases How does the speed change 3) stays constant with time? 4) increases, then decreases 5) decreases, then increases v t
Concep. Test v versus t graphs I 1) decreases Consider the v versus t plot. 2) increases How does the speed change 3) stays constant with time? 4) increases, then decreases 5) decreases, then increases v t The initial velocity is positive and the magnitude of the velocity continues to increase with time.
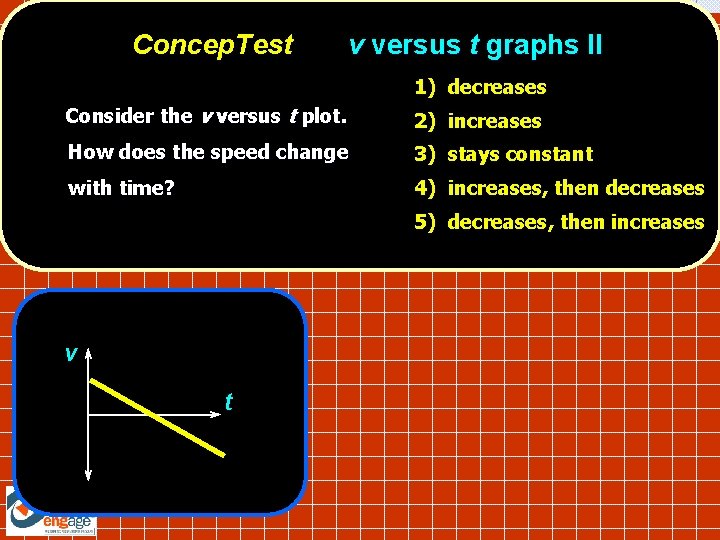
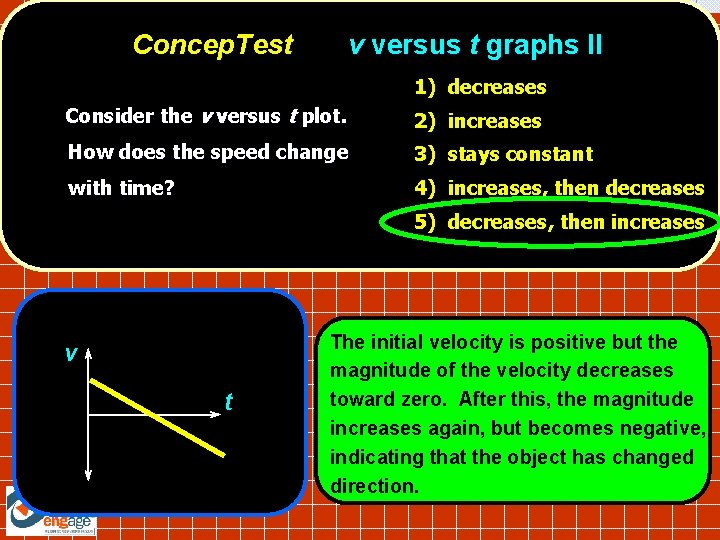
Concep. Test v versus t graphs II 1) decreases Consider the v versus t plot. 2) increases How does the speed change 3) stays constant with time? 4) increases, then decreases 5) decreases, then increases v t
Concep. Test v versus t graphs II 1) decreases Consider the v versus t plot. 2) increases How does the speed change 3) stays constant with time? 4) increases, then decreases 5) decreases, then increases v t The initial velocity is positive but the magnitude of the velocity decreases toward zero. After this, the magnitude increases again, but becomes negative, indicating that the object has changed direction.
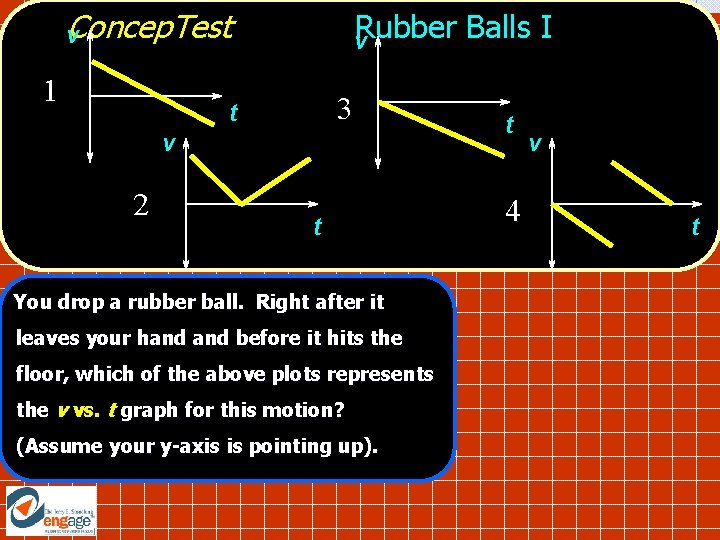
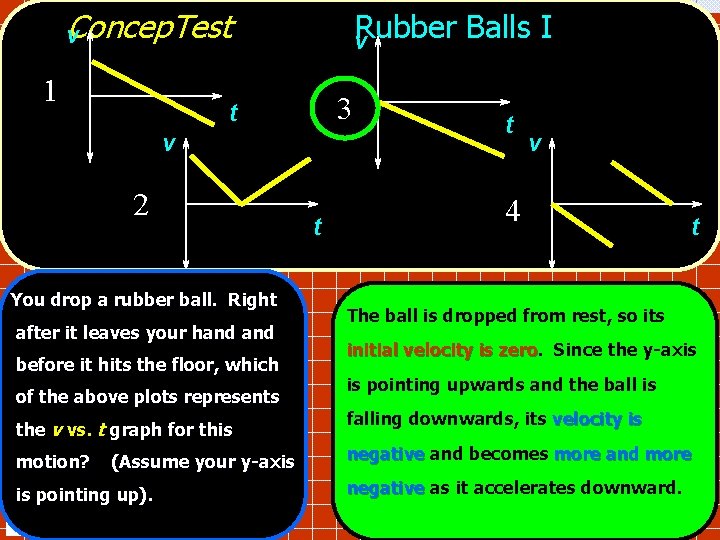
Concep. Test v 1 Rubber v 3 t v 2 t You drop a rubber ball. Right after it leaves your hand before it hits the floor, which of the above plots represents the v vs. t graph for this motion? (Assume your y-axis is pointing up). Balls I t 4 v t
Concep. Test v 1 Rubber v 3 t v 2 You drop a rubber ball. Right after it leaves your hand before it hits the floor, which of the above plots represents the v vs. t graph for this motion? (Assume your y-axis is pointing up). t Balls I t v 4 t The ball is dropped from rest, so its initial velocity is zero Since the y-axis is pointing upwards and the ball is falling downwards, its velocity is negative and becomes more and more negative as it accelerates downward.
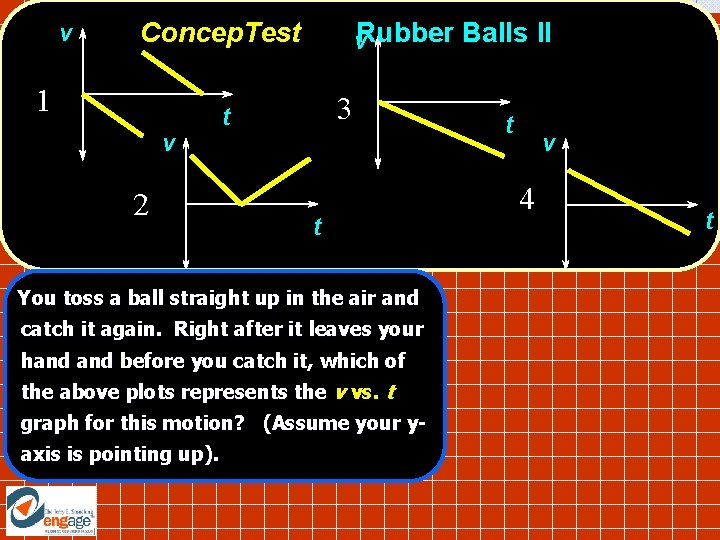
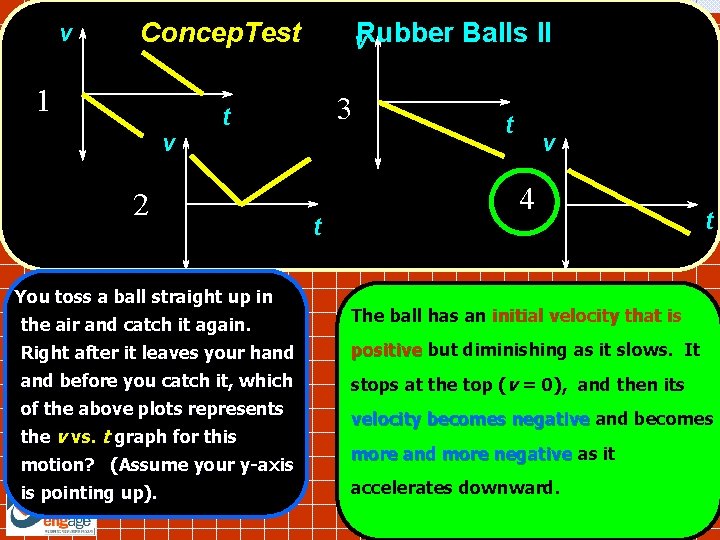
v Concep. Test 1 v 2 v. Rubber Balls II 3 t t You toss a ball straight up in the air and catch it again. Right after it leaves your hand before you catch it, which of the above plots represents the v vs. t graph for this motion? (Assume your yaxis is pointing up). t v 4 t
v Concep. Test 1 v v. Rubber Balls II 3 t 2 You toss a ball straight up in t t v 4 the air and catch it again. The ball has an initial velocity that is Right after it leaves your hand positive but diminishing as it slows. It and before you catch it, which stops at the top (v = 0), and then its of the above plots represents the v vs. t graph for this motion? (Assume your y-axis is pointing up). t velocity becomes negative and becomes more and more negative as it accelerates downward.
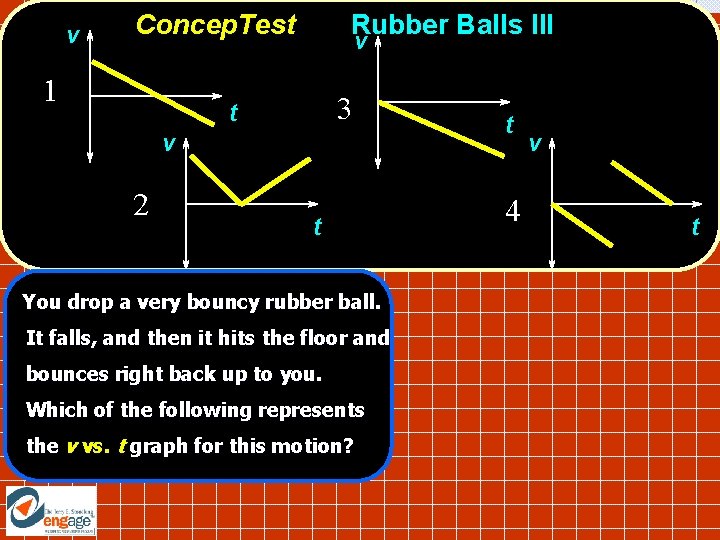
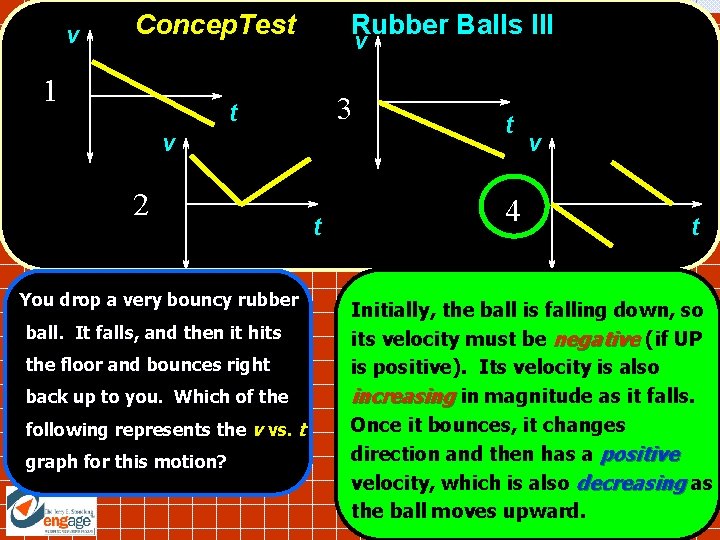
v Concep. Test 1 Rubber Balls III v 3 t v 2 t You drop a very bouncy rubber ball. It falls, and then it hits the floor and bounces right back up to you. Which of the following represents the v vs. t graph for this motion? t 4 v t
v Concep. Test 1 Rubber Balls III v 3 t v 2 You drop a very bouncy rubber ball. It falls, and then it hits the floor and bounces right back up to you. Which of the following represents the v vs. t graph for this motion? t t 4 v t Initially, the ball is falling down, so its velocity must be negative (if UP is positive). Its velocity is also increasing in magnitude as it falls. Once it bounces, it changes direction and then has a positive velocity, which is also decreasing as the ball moves upward.
Module 2, Recitation 2 Match the s-v-a vs. t graphs of Pasco car motion
Track 1: Level track, spring plunger on one end and Velcro on the other. Start the car in the center of the track and give it a gentle push towards the end with the plunger. Plot graphs for the motion from when you finish pushing the car until it stops. Insert graph from Data Studio of position-velocity-acceleration
Track 2: Level track, fan accessory. Start car at left end. The fan is set to be on for 1 second. Plot graphs for the motion from when the fan starts until the car reaches the right end of the track. Insert graph from Data Studio of position-velocity-acceleration
Track 3: Inclined track, spring plunger. Let the car roll down the track and bounce off the end several times. Insert graph from Data Studio of position-velocity-acceleration
Track 4: Inclined track; small, and large sails. Plot the motion from when released until the car reaches the end of the track. Compare motion for no sail (track 3), the small sail, and the large sail. Insert graph from Data Studio of position-velocity-acceleration
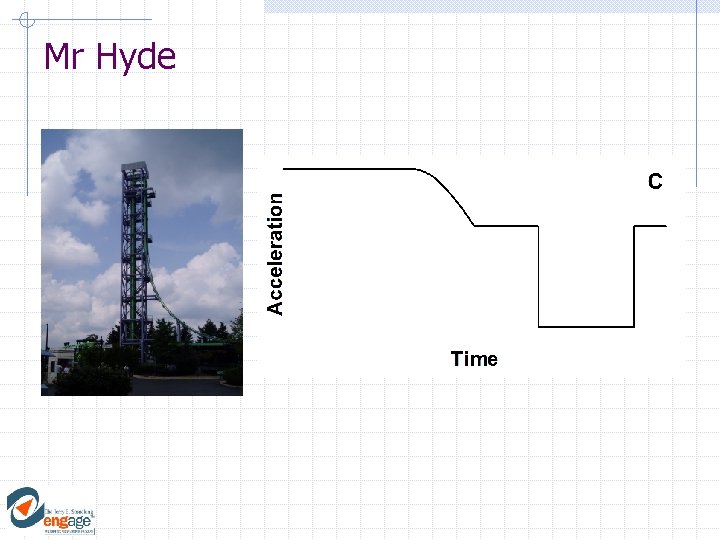
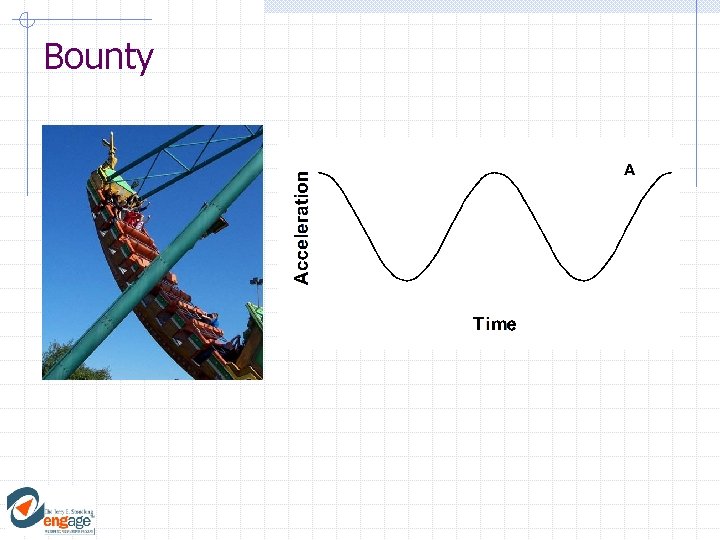
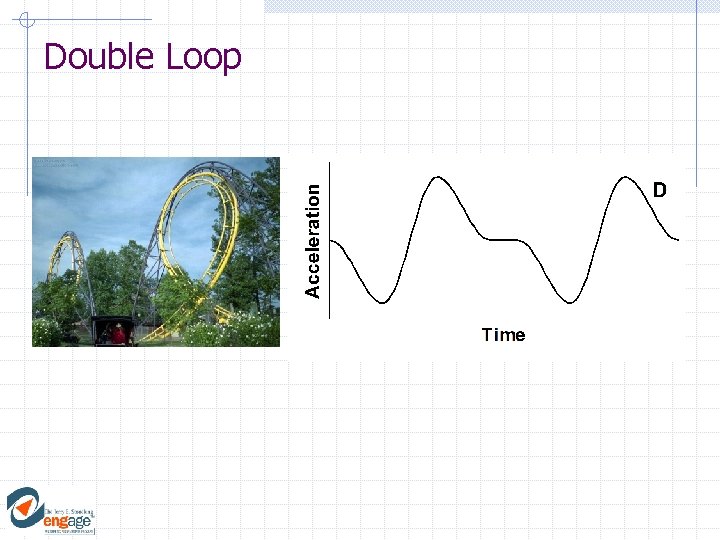
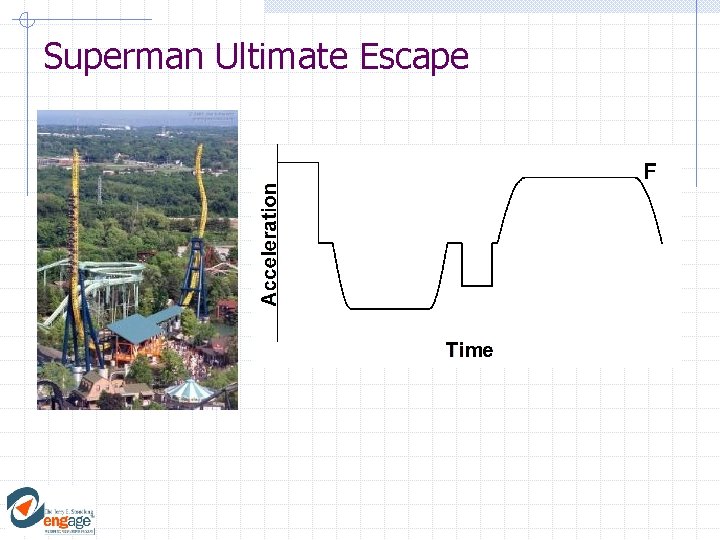
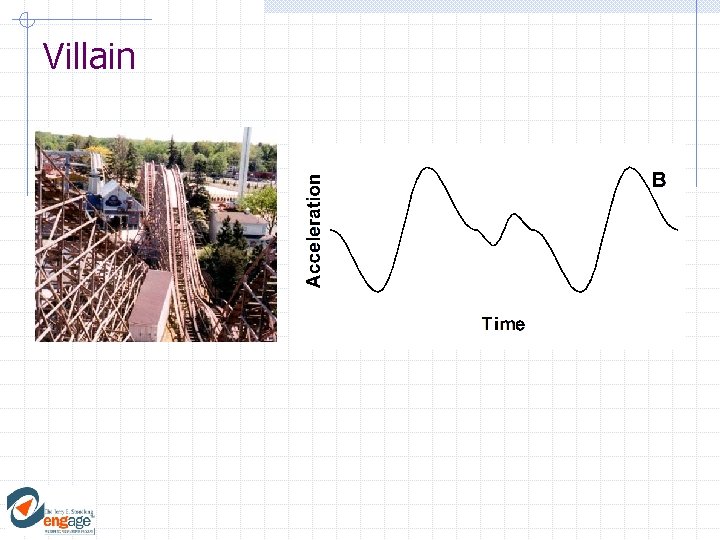
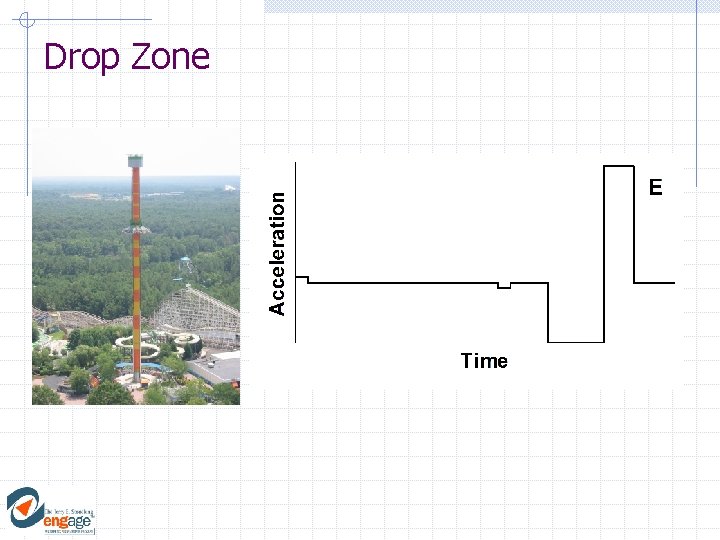
Module 2, Recitation 2 Match the amusement park acceleration graphs
Mr Hyde
Bounty
Double Loop
Superman Ultimate Escape
Villain
Drop Zone