Module 2 oneway ANOVA and twoway ANOVA Wei


: • The variance within")


 • The data “Breast. Cancer. Mortality. Rate” on d 2")


")


 (continue with activity 1) Four")


- Slides: 41
Module 2 one-way ANOVA and two-way ANOVA Wei Metro State University
Learning objectives and outcomes • Why choose ANOVA • Know how to perform one-way ANOVA in SPSS • Know how to do multiple comparison for means in SPSS • Know how to perform two-way ANOVA in SPSS
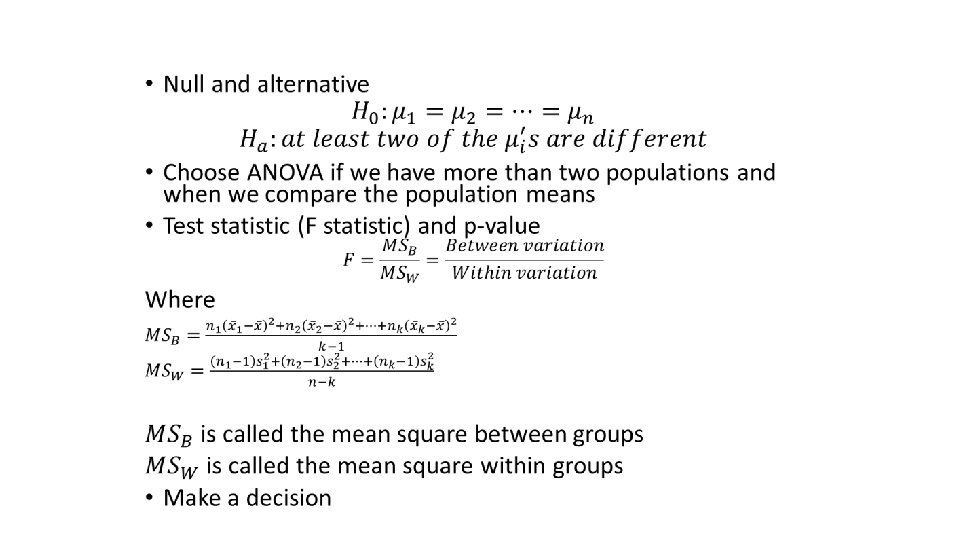
Concepts of ANOVA •
Why ANOVA? •
How ANOVA works? • Compares two types of variances (variations): • The variance within each sample • The variance between different samples • Take the ratio of between variation and within variation • Idea: • If the population means are different, then the variance within the samples must be small compared to the variance between the samples • If the population means are not so different, then the variance between samples must be small
How ANOVA works? • Within group variation • Between group variation
Calculations in ANOVA •
Assumption • The data follow normal distribution • Usually true when we have a large sample size • The equal variances of underline populations are assumed. • Use the homogeneity of variance test in SPSS • Independence
ANOVA model •
• Example using SPSS Drug 1 Drug 2 7. 3 8. 2 10. 1 6 9. 5 Drug 3 7. 1 10. 6 11. 2 9 8. 5 10. 9 7. 8 5. 8 6. 5 8. 8 4. 9 7. 9 8. 5 5. 2
Calculations •
Perform ANOVA in SPSS • Enter the data • Need two variables: one is the group indicator and one is the dependent variable. • Note: the two variables have to be both numeric even the group indicator is really categorical. • Analyze->Compare means->One-way ANOVA • Check the homogeneity variance assumption in options
Output of ANOVA
Example solution •
Activity using SPSS Four cough formulas are compared in an experiment, with the variable measured being hours to relief from coughing. Data are shown in the table. Twenty patients were selected into the experiment. Five of them took formula 1 and the hours to relief were recorded under column A. Five of them took formula 2 and the hours to relief were recorded under column B. Five of them took formula 3 and five took formula 4, and the time to relief for those two groups were recorded under column 3 and 4. Do these cough formulas have the same mean hours to relief? Perform a test to support your answer based on the significance level of 0. 05. What is the effect size of the formula type? Formula 1 Formula 2 Formula 3 Formula 4 1. 2 5. 5 5. 3 10. 9 2. 3 7. 6 6. 5 9. 6 1. 0 6. 2 8. 8 8. 0 0. 9 9. 0 4. 9 7. 5 3. 1 8. 2 7. 9
output
Activity solution •
Example 2 (Case study) • The data “Breast. Cancer. Mortality. Rate” on d 2 l records the mortality rate of the five countries from 1992 to 2012. The researchers would like to compare the mean mortality rate of breast cancer among the five countries. Use the significance level of 0. 05 to test the claim that the average mortality rates are the same among the five countries.
Example 2 • The data entry should be: Country Mortality. Rate Canada … … … United States… • We need to manipulate the data to change the wide format to be the long format using “Restructure” • The years will be our index • The variables become cases(rows) • After Restructure the data, use Analyze->General Linear Model->Univariate
Example 2 • Breast Cancer Study-Recall bias
Multiple comparison of means • When we observe significant differences among the means, what should we do for the next step? • If your ANOVA test shows that the means aren’t all equal, your next step is to determine which means are different. • John Tukey gave one answer to this question, the Tukey HSD (Honest Significant Difference) test: compute something like a T-score for each pair of means, but not following the regular T-distribution. • Several methods: Bonferroni, Tukey, Dunnett and Duncan… • When performing the one-way ANOVA, under “Post hoc” choose Tukey
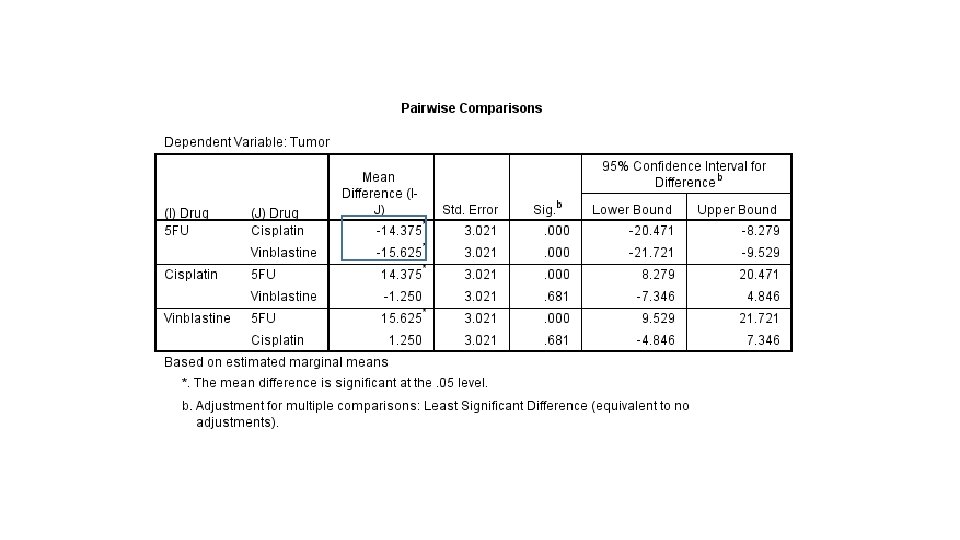
• Example (using SPSS to perform a multiple comparison)
Multiple comparison method • Where the differences lie? The average relief time for drug 2 is significantly different from drug 3; There is no significant difference in relief time between drug 1 and drug 2 and between drug 1 and drug 3.
Multiple comparison method
Activity 2 (using SPSS to do the multiple comparison) (continue with activity 1) Four cough formulas are compared in an experiment, with the variable measured being hours to relief from coughing. Data are shown in the table. Twenty patients were selected into the experiment. Five of them took formula 1 and the hours to relief were recorded under column A. Five of them took formula 2 and the hours to relief were recorded under column B. Five of them took formula 3 and five took formula 4, and the time to relief for those two groups were recorded under column 3 and 4. Perform a Tukey comparison to see where the differences lie.
Output The average relief time formula 1 is significantly different from the other three formula; There is no significant difference in relief time among formula 2, 3 and 4.
Two-way ANOVA • 2 Independent variables: both are categorical • 1 dependent variable: numeric • The 2 independent variables can have different numbers of levels • There needs to be replications for each treatment combination • Example: Factor A (3 levels) and B (2 levels) are independent variables A 1 A 2 A 3 B 1 X, …X B 2 X, …X
Two-way ANOVA • Assumptions: • Normality • Homogeneity of variance • Independence
Two-way ANOVA Model •
What to study using the factorial design? •
What to study using factorial design? •
Interaction • If the two lines for means are parallel=> there is no interaction between A and B • If the two lines for means cross with each other=> there is a possible interaction between A and B; • The factor B has impact on the difference in A • Use the p-value for interaction to determine if the interaction is significant
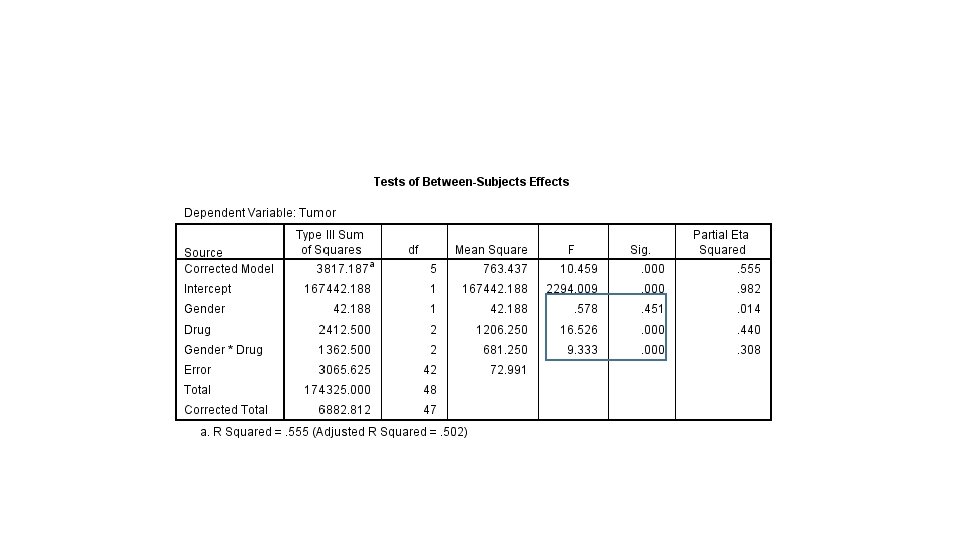
Example: We would like to test the effects of three drugs on treating cancers: Cisplatin (顺铂), Vinblastine (长春新碱) and 5 -fluorouracil (5氟尿嘧啶). We also would like to know if these drugs has the same effects on males and females. That is, is there any gender difference when using these drugs? The data shows the tumor sizes after taking each type of medications for males and females. Enter the data into SPSS and perform a two-way ANOVA to test the main effects of drug and gender and test the interaction between drug and gender.
Cisplatin Vinblastine 5 -fluorouracil Gender Female Male Tumor size 65 50 70 45 55 35 70 55 65 60 65 40 60 85 70 35 60 65 70 65 55 55 60 70 65 70 55 35 55 75 60 70 60 40 60 75 60 80 50 45 50 60 50 40
Example solution •
Activity The data “Breast Cancer” is online. The description of the data is online. We are interested in the main effect of smoking and PMH (postmenopausal hormone, 更年期荷尔蒙) on BMI (Body Mass Index, 身体质量指数). Perform the appropriate analysis to test if there is a significant difference in BMI between smokers (1) and non-smokers (0) and between PMH users (2) and non-PMH users (3)
Output
Activity • Discussion: • Is there any flaw of this analysis?