Modulated Differential Scanning Calorimetry MDSC MDSC Training Course
")


")


 Modulated Temperature Amplitude Average Temperature")

 Reversing Heat Flow • Calculated from Reversing Heat Capacity signal")

 Nonreversing Heat Flow • Calculated by subtracting the Reversing Heat")


")
")

 applied to the sample")
 Proper selection of the three experimental parameters is important in order")
 Period (sec) H e a t i n")


")


 Issues with Use of MDSC in")


- Slides: 57
Modulated Differential Scanning Calorimetry ® (MDSC®)
MDSC® Training Course Topics • What is actually measured by MDSC • • • – MDSC does not measure the reversibility of transitions Understanding heat flow from DSC and MDSC experiments Calculation of MDSC signals Heat capacity calculation Optimization of MDSC experimental conditions Characterization of transitions involving a change in heat capacity (glass transition etc. ) Measurement of polymer melting and crystallinity – When not to use MDSC
What Does MDSC® Measure? • As will be shown, MDSC separates the Total heat flow of • • • DSC into two parts based on the heat flow that does and does not respond to a changing heating rate MDSC applies a changing heating rate on top of a linear heating rate in order measure the heat flow that responds to the changing heating rate In general, only heat capacity and melting respond to the changing heating rate. The Reversing and Nonreversing signals of MDSC should never be interpreted as the measurement of reversible and nonreversible properties
MDSC® Separates the Total Heat Flow Signal of DSC into Two Parts
Understanding Heat Capacity and the Benefits of Being Able to Measure It Understanding Heat Capacity • Heat Capacity or Specific Heat is the amount of heat required to change the temperature of a specific mass of material (no transition in structure): Heat Capacity = Specific Cp (J/g°C) x Sample Weight (g) • Heat capacity is a measure of molecular motion. Heat capacity increases as molecular motion increases. Vibration – occurs below and above Tg Rotation – polymer backbone and sidechains (in and above Tg) Translation – entire polymer molecule (above Tg) • Transitions in the structure of a material are important because they result in changes in heat capacity (molecular mobility) and other important physical, and sometimes chemical, properties • Thermodynamic property of material (vs. heat flow). Heat flow is relative; whereas, the heat capacity is absolute
Changes in Heat Capacity Indicate Significant Changes in Physical Properties Translation Rotation Vibration
Understanding Heat Capacity and the Benefits of Being Able to Measure It (cont. ) Understanding the Benefits • Knowledge of the baseline due to heat capacity is important for almost all DSC and MDSC measurements because all transitions must be analyzed between two points on the heat capacity baseline for accurate temperatures and heats of transition. – It is often impossible to identify the heat capacity baseline in DSC data – The MDSC Reversing signals (Cp and Heat Flow) provide the heat capacity baseline – Although melting is primarily seen in the Reversing signal, it is a latent heat (no change in sample temperature) and is not a heat capacity component
Without Knowledge of the Baseline Due to Heat Capacity, Analysis of This Epoxy is Not Possible Heating Experiment at 3 C/min After 160 min Isothermal Cure at 100 C Note Onset of Decomposition Before Complete Cure Sample: Epoxy Size: 10. 85 mg Note Inability to Measure Tg or Integrate Peak Due to Cure
Understanding the Heat Flow Signal from DSC and MDSC® Experiments • For a given sample, the rate of heat flow (m. W = J/sec) due to heat capacity is linearly proportional to heating rate. • At a heating rate of zero, the heat flow due to heat capacity is also zero. • Any heat flow detected at a zero heating rate must be due to kinetic processes ƒ(T, t) in the sample. • The purpose of MDSC is to separate the total heat flow into the part that responds to heating rate and the part that responds to absolute temperature.
Heat flow due to heat capacity responds linearly to heating rate
Comparison of DSC and MDSC Heat Flow and Heat Capacity Signals DSC MDSC® COMMENTS Total Heat Flow Modulated Heat Flow Signals contain all thermal events occurring in the sample Total Heat Flow Quantitatively the same in both techniques at the same average heating rate Reversing Heat Flow Heat capacity component of total heat flow Nonreversing Heat Flow Kinetic component of total heat flow Heat Capacity All calculated heat flow signals are also available in heat capacity units
Selecting MDSC® Mode and Type of Experiment
Storing MDSC® Signals Signal Selection Button
Selecting MDSC® Signals for Plotting in Universal Analysis
Average & Modulated Temperature (Heat-Iso) Modulated Temperature Amplitude Average Temperature
Average & Modulated Heating Rate; MDSC® Does Not Require Cooling During Modulation Period
Signal Calculations (cont. ) Reversing Heat Flow • Calculated from Reversing Heat Capacity signal
Calculation of MDSC® Reversing Heat Flow and Heat Capacity Signals
Signal Calculations (cont. ) Nonreversing Heat Flow • Calculated by subtracting the Reversing Heat Flow signal from the Total Heat Flow signal Total = Reversing + Nonreversing = Total – Reversing
Calculated MDSC® Heat Flow Signals
Separation of Transitions into Modulated DSC® Signals MDSC® Data Signals Total = Transitions: Reversing + Nonreversing Heat Capacity Enthalpic Recovery Glass Transition Evaporation Most Melting Crystallization Thermoset Cure Protein Denaturation Starch Gelatinization Decomposition Some Melting
Calibration • Cp Calibration is independent of heating rate – 0 -5°C/min • Cp Calibration is independent of amplitude – 0 -1°C • Cp Calibration is dependent on period and purge gas – Calibrate with period that you intend to use for subsequent runs – Use purge gas that you plan to use for subsequent runs
Set Mode & Test as shown above
Sapphire Cp data Plot Heat Capacity and Rev Cp vs. temperature
Sapphire Cp data Theoretical values of Sapphire indicated
View spreadsheet of data
Cp Data Table
Determining K The heat capacity calibration constant, K, is calculated as the ratio of theoretical heat capacity of a standard material, to the measured heat capacity of the material.
Sapphire Cp Values
Determining K @ 1 temperature
Determining K(multiple temperatures)
Determining K(multiple temperatures)
Type K values into Cell Calibration table
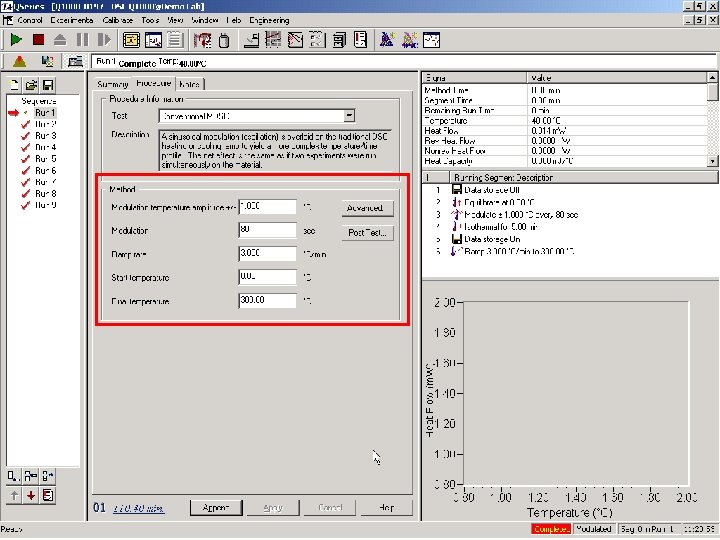
Optimization of MDSC® Experimental Conditions MDSC® controls the Heating Rate(s) applied to the sample through three experimental parameters: 1. Average Heating Rate (°C/min) – Typically less than 5°C/minute in order to get a minimum of 4 -5 temperature modulations during a transition 2. Temperature Modulation Amplitude (± °C) – Typically ± 0. 1 to 2°C 3. Temperature Modulation Period (Seconds) – Typically 40 – 100 seconds
Optimization (cont. ) Proper selection of the three experimental parameters is important in order to maximize the quality of the results. • Specific recommendations for different types of transitions will be provided in later sections. • In general, temperature is controlled to either provide or not provide cooling during the temperature modulation. • The combination of temperature modulation amplitude and period control the range in heating rate while its average is defined by the specified heating rate.
MDSC® Heat-Iso Amplitudes (no cooling/measure crystallinity) Period (sec) H e a t i n g 40 50 60 70 80 90 100 0. 1 0. 013 0. 016 0. 019 0. 021 0. 024 0. 027 0. 2 0. 021 0. 027 0. 032 0. 037 0. 042 0. 048 0. 053 0. 5 0. 053 0. 066 0. 080 0. 093 0. 106 0. 119 0. 133 1. 0 0. 106 0. 133 0. 159 0. 186 0. 212 0. 239 0. 265 R 2. 0 0. 212 0. 265 0. 318 0. 371 0. 424 0. 477 0. 531 a t 5. 0 0. 531 0. 663 0. 796 0. 928 1. 061 1. 194 1. 326 e This table is additive, i. e. the heat only amplitude for a period of 40 sec & a heating rate of 2. 5°C/min is the sum of the values for 2. 0°C/min & 0. 5°C/min Amplitude (40 s, 2. 5°C/min)=0. 212+0. 053=0. 265°C
MDSC® Heat-Iso Temperature Modulation No Cooling Heating Rate never goes below 0°C/min
MDSC® Heat-Cool Temperature Modulation Heating & Cooling Heating Rate goes below 0°C/min
Optimization of MDSC® Conditions for Glass Transitions w/ a Q Series MDSC (heat-cool)
MDSC® Analysis of the Glass Transition The following measurements will be illustrated • Measurement of Tg in Complex Samples • Quantitative Measurement of Amorphous Structure in Materials • Quantitative Measurement of Enthalpic Recovery (Relaxation) in Aged Samples – Glass transition is frequency dependent – MDSC applies a frequency (Period) during the measurement and this affects the measured temperature of the Reversing signal – It is necessary to do a “Frequency Correction” in order to measure absolute values of enthalpic recovery
Measuring Tg in Complex Samples with MDSC® • Complex samples are ones that have overlapping • • transitions which make it difficult to detect or measure Tg MDSC experimental conditions which provide some cooling during temperature modulation are recommended Use an underlying heating rate that is slow enough to provide 4 or more modulation cycles over the transition of interest in order to improve separation of overlapping events (resolution)
Figure 25 - MDSC® of Frozen Sucrose Solution
Advantage of MDSC® for Post Cure Scan Heating Experiment at 3 C/min After 160 min Isothermal Cure at 100 C Sample: Epoxy Size: 10. 85 mg
DSC of Complex Polymer Blend
MDSC® of Complex Polymer Blend
Optimization of MDSC® Experimental Conditions for Analysis of Melting and Crystallinity • Sample Size; 10 -15 mg • Period – 40 sec. Q Series for crimped pans – 60 sec. Q Series for hermetic pans • Heating Rate – Slow enough to get a minimum of 4 -5 cycles at halfheight of the melting peaks • Amplitude – Use “Heat-Iso” amplitude which provides no cooling during temperature modulation (see Table) – Crystallization will not be caused by a lowering of the temperature
Optimization of MDSC® Conditions for Melting (cont. ) Issues with Use of MDSC in Melting Region Before discussing how MDSC® can be used to analyze melting and crystallinity, it is necessary to discuss some technical issues with the measurement. • Issue 1: MDSC® cannot provide a meaningful measurement on samples that have a narrow melting range (pure metals and chemicals). The reason is that the temperature of the sample cannot be modulated during melting (Figures 43 -44). • Issue 2: Because there are two simultaneous endothermic processes occurring during melting (heat capacity and latent heat of fusion), and because those processes respond differently to temperature modulation, the separation of the Total signal into the Reversing and Nonreversing components changes when experimental conditions are changed (Fig 4553).
MDSC® Should Not Be Used on Sharp Melting Transitions
MDSC® of Water Melting/Boiling
MDSC® Raw Data Signals on Polymer Blend
MDSC® of 57/43 % PET/PC Blend
DSC Analysis of Cycoloy C 2950: Standard DSC Ramp
DSC Analysis of Cycoloy C 2950: MDSC Heat Cool Heat Method/ First Heat
Using the TMA Q 400 to Observe the Glass Transitions in Cycoloy C 2950
Summary • MDSC® is a slow technique. Always start the analysis of a new material with standard DSC and only use MDSC if you need. – – Improved sensitivity Better resolution Separation of overlapping transitions Most accurate measurement of polymer crystallinity • Don’t forget that MDSC can be used while • • cooling Optimum results require the selection of optimum experimental conditions When in doubt, ask TA Instruments for help?
What if I need help? • On-site training & e-Training courses - see Website • Call the TA Instruments Hotline – 302 -427 -4070 M-F 8 -4: 30 Eastern Time – thermalsupport@tainstruments. com • Call the TA Instruments Service Hotline – 302 -427 -4050 M-F 8 -4: 30 Eastern Time • Check out our Website – www. tainstruments. com