MODIS Burned Area Products and Applications Louis Giglio

MODIS Burned Area Products and Applications Louis Giglio University of Maryland TSMS – EUMETSAT Second SALGEE Workshop 4 - 7 April 2011, Antalya, Turkey

Satellite-Based Burned Area Products • Map spatial extent of post-fire burn scars over a particular time period – Approximate date of burn • Possibly provide additional information about area burned – Fire severity, burn severity

Discussion Topics • Standard MODIS Burned Area Product • MODIS Direct Broadcast Burned Area Algorithm • Collection 6 Plans
 MODIS Rapid Response System")
Burn scars in California (18 November 2003) MODIS Rapid Response System

ASTER Scene 2. 4 µm R 1. 6 µm G 0. 5 µm B
 BRDF-based")
• • Standard MODIS Burned Area Product Roy et al. (2002, 2005) BRDF-based approach 500 -m, daily resolution Produced on monthly basis Production commenced with Collection 5. 1 reprocessing planned MCD 45 A 1 No use of active fire information in algorithm

Algorithm: Rolling BRDF based expectation change detection Persistence of the signal BRDF Effects gaps Day of burning Algorithm applied independently per-pixel to daily gridded MODIS 500 m land surface reflectance time series to map approximate day of burning D. Roy
")
Consistency conceptual scheme BRDF Inversion window observed predicted Consistency window > r r (t+4|t) t time r (t+4|t) first detection D. Roy

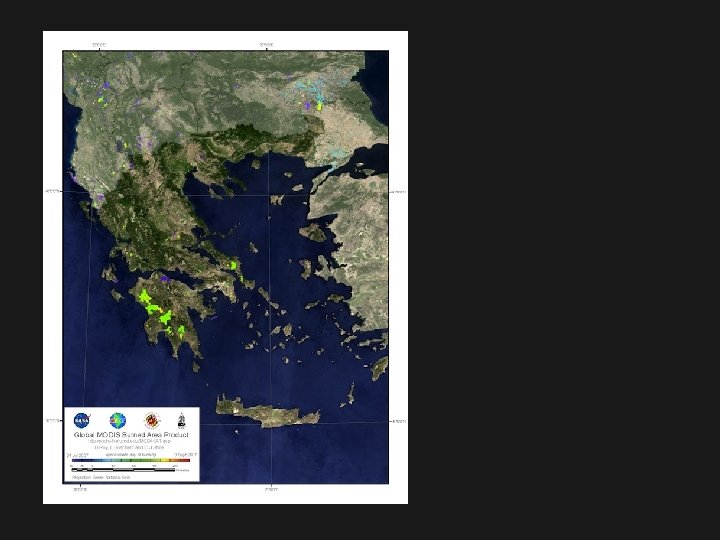
A closer look at the monthly product… Tile h 17 v 06 2000306 (November 2000) 205 251 SDS “Burndate” D. Roy

A closer look at the monthly product… 205 251 SDS “Burndate” D. Roy

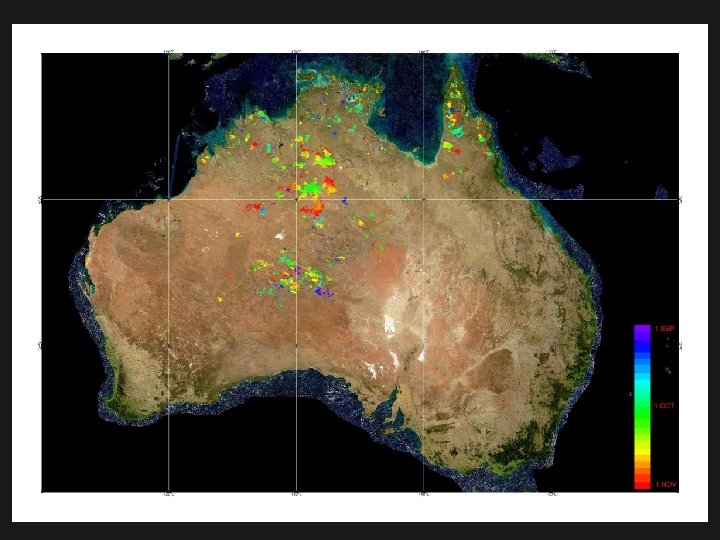
Australia 500 m burned areas 1 month 2002

Australia 1 km active fires 1 month 2002

Validation

Burned Area Product Validation Protocol • Compare MODIS burned area product with independent spatially explicit burned area data derived from multitemporal Landsat ETM+ data • SAFNet field trip held to develop the mapping protocol and to discuss southern African fire information needs, Zimbabwe. Zambia, July 2000 • SAFNet members map the areas burned between 2+ Landsat acquisitions, augmented by limited fieldwork • Consensus mapping protocol to ensure regionally consistent independent validation data • protocol followed 2000 -2002 at ~11 ETM+ scenes/year Roy, D. et al. 2005, The Southern Africa Fire Network (SAFNet) regional burned area product validation protocol, International Journal of Remote Sensing, 26: 4265 -4292. D. Roy

Burned Area Product Validation Protocol – Community endorsed validation protocol • • • common methodology common accuracy reporting being worked through GOFC/GOLD Independent reference data derived by expert interpretation of multi-date higher spatial resolution satellite data Landsat data an attractive data source given that the US Landsat archive is now free D. Roy

Southern Africa MODIS burned area validation - Landsat ETM+ validation scenes distributed from dry savanna to wet miombo woodland to quantify product accuracy over range of representative biomass burning conditions ETM+ scene ~185 * 185 km Each ETM+ scene has a local SAFNet collaborator 11 scenes = ~3% of southern African surface MODIS 1 km land cover product: of the 17 MODIS land cover classes, predominant classes illustrated include: evergreen broadleaf forest (dark green), barren or sparsely vegetated (gray), woody savannas (light green), open shrublands (cream), grasslands (light brown), savannas (orange), croplands (yellow), cropland/natural vegetation mosaic (olive brown), urban (red). D. Roy

Landsat ETM+ Sept. 4 th

Landsat ETM+ Oct. 6 th Yellow vectors = ETM+ interpreted burned areas occurring between the two ETM+ acquisitions

MODIS 500 m Burned Areas Sept. 4 to Oct. 6 White vectors = ETM+ interpreted burned areas occurring between the two ETM+ acquisitions

MODIS – A/S/O 2001

MODIS Burned Area product Validation The slope of the regression line is 0. 75, the intercept is -0. 005, and r 2 is 0. 746

Distribution • Level 3 MODIS Tiled Product – http: //wist. echo. nasa. gov • Geo. TIFF Sub-Continental Regions – http: //modis-fire. umd. edu/BA_getdata. html

Applications and Results
 VI time series")
MODIS Direct Broadcast Burned Area Algorithm • Giglio et al. (2009) VI time series approach • 500 -m, daily resolution • Limited production to support multiple projects – Global Fire Emissions Database (GFED) • Stand-alone code available for use in DR systems • Exploits active fire information to help identify burns

Australia 500 m burned areas 1 month 2002

Australia 1 km active fires 1 month 2002
")
India Siberia Giglio et al. (2006)
 band 7 (2. 1 m) VI 57")
burn band 5 (1. 2 m) band 7 (2. 1 m) VI 57
 band 7 (2. 1 m) Both magnitude of")
burn band 5 (1. 2 m) band 7 (2. 1 m) Both magnitude of drop and post -burn level depend on many variables -- fixed thresholds inappropriate. VI 57

Approach • Use “cleaned” active fire maps to select burned and unburned training samples from temporal composites • Generate temporally-composited change summary • Extract conditional PDFs for burned and unburned pixels • Assign prior burned probability to each pixel • Bayesian classifier + supplementary relative threshold tests

DAILY SURFACE REFLECTANCE DAILY ACTIVE FIRE MASKS Algorithm VI*, VI*post S*, tf IQR*pre, IQR*post TEMPORAL COMPOSITES TEMPORAL TEXTURE CONDITIONAL PDFs LAND COVER TRAINING MASK SPATIAL PRIORS INITIAL CLASSIFICATION change summaries primary role of active fire map CONTEXTUAL FILTER BURN MAP Giglio et al. (2009)

Change-summary examples: Maximum decrease in VI Day of maximum decrease Postdecrease VI Active-fire date Northern Australia, approx. August - October 2001

Region growing applied to “cleaned” active fire map to identify burned and unburned training pixels…

burned training pixel unburned training pixel

Conditional PDFs dynamic threshold burned unburned

Conditional PDFs unburned

Final result: Date of burn for each 500 -m grid cell

Validation of 500 -m Burned Area Maps Validation using high-resolution burn scar maps manually produced from Landsat imagery. ~40 Landsat scene pairs Giglio et al. (2009)

Application: GFED 3 1997 -2009 Annual Average Burned Area (% of 0. 5° grid cell) http: //www. globalfiredata. org/index. html
 http:")
Application: GFED 3 1997 -2009 Average Annual Carbon Emission (g C m-2 year-1) http: //www. globalfiredata. org/index. html

Planned Collection 6 MODIS Burned Area Refinements • Merge standard and direct-broadcast algorithms – Reduce omission errors • Annual synthesis burned area product • Global burned area product validation – low intensity and understory fires – high LAI, high %Tree cover conditions – Agricultural fires

Additional Information • MODIS Fire and Thermal Anomalies – http: //modis-fire. umd. edu/ • MODIS Burned Area Product User’s Guide – http: //modis-fire. umd. edu/BA_usermanual. html • MODIS Land Rapid Response System • http: //rapidfire. sci. gsfc. nasa. gov/ • WIST (order MODIS land products) – https: //wist. echo. nasa. gov/~wist/api/imswelcome/
- Slides: 44