MODIS Atmosphere Level3 Product Web Site Review Paul

MODIS Atmosphere Level-3 Product & Web Site Review Paul A. Hubanks Science Systems and Applications, Inc.
 Primer -2. Web Site Review -3. Case Studies")
Presentation Outline: 1. Level-3 (L 3) Primer -2. Web Site Review -3. Case Studies -4. L 3 Updates -- High-level algorithm & product description Web-based tools and key features Using web & interactive tools to diagnose algorithm issues Collection 005 change summary

Topic 1. The L 3 Algorithm

L 3 Daily Algorithm: Characteristics Important Limitations: Ø Ø Limited input - only L 2 files Fixed grid - equal-angle 1 x 1 degree Subsampling - L 2 pixels sampled at geolocation resolution No valid range check - inconsistently defined and implemented at L 2 - potential to mask L 2 algorithm problems Statistical Computation: Ø Ø Ø Aggregation - using L 2 QA flags (e. g: ice vs. water cloud phase) QA-weighted Statistics - using L 2 QA “confidence flags” Comparison Statistics - joint histogram and/or regression statistics may be computed of one L 2 parameter against another

Sub-sampling

L 3 Sub-sampling Impact Product Family L 2 Data Resolution L 2 Geolocation Resolution L 2 Input Pixels (Max) per 1° L 3 Grid (Equator) Impact Aerosol 04 10 km 10 km 121 out of 121 No Water Vapor 05 1 km 5 km 484 out of 12, 231 Yes Cirrus Detection 06_CD 1 km 5 km 484 out of 12, 231 Yes Cloud Top Properties 06_CT 5 km 484 out of 484 No Cloud Optical Properties 06_OD 1 km 5 km 484 out of 12, 321 Yes Atmosphere Profile 07 5 km 484 out of 484 No

The meaning of “QA”

Ø QA or Quality Assurance is a loosely defined term that covers a myriad of ancillary information produced along with many L 2 parameters Ø QA is described in the QA Plan document Ø The “runtime” QA flags produced by Level 2 algorithms are typically stored as packed bitstrings in “Quality Assurance” SDS’s. These flags cover many aspects of L 2 retrieval parameters including: (available on the modis-atmos web site -- being updated for Collection 005) ü ü ü Input (ancillary) data sources Approach (retrieval method) Various scene attributes Success or failure of various criteria Data quality or confidence estimate (QA confidence flags)

QA confidence flags, when computed, are set for every L 2 pixel. The four categories (for non-fill L 2 data) are: Ø Ø 0 = No Confidence → 0 x weight 1 = Questionable or Marginal → 1 x weight 2 = Good Confidence → 2 x weight 3 = Very Good Confidence → 3 x weight

Who is setting “meaningful” L 2 QA? Product Family L 2 QA Set? Detail Aerosol 04 Yes Differentiate experimental from nonexperimental results Water Vapor 05 Yes Negligible impact at L 3 Cirrus Detection 06_CD No No QA bits reserved in QA Plan Cloud Top Properties 06_CT No Dropped in Summer 2002 Cloud Optical Properties 06_OD Yes Based on joint distribution of Tau and Re Atmosphere Profile 07 No No impact visible at L 3
 Algorithm")
Unique Characteristics of the L 3 Multiday (8 -Day and Monthly) Algorithm

L 3 Multiday Algorithm: Characteristics 1. Only the L 3 daily files used as input (highly efficient) 2. Identical Grid, SDS dimensions, and Histogram Bins 3. Three weighting schemes used to compute multiday statistics from daily statistics Ø Unweighted (time-averaged mean, meaningful for computing temperature averages) Ø Pixel count weighted (count-averaged mean, ensures computed means match means from histograms) Ø Pixels count weighted with pixel count screen

L 3 Multiday Weighting Scheme Specification Product Family Multiday Weighting Scheme * Detail Pixel Count Weighted with Pixel Count Screen Each daily grid weighted by the pixel count & daily grids with counts < 6 are excluded Pixel Count Weighted Each daily grid weighted by the pixel count Cirrus Detection 06_CD Unweighted Each daily grid given the same weight Cloud Top Properties 06_CT Unweighted Each daily grid given the same weight Cloud Optical Properties 06_OD Pixel Count Weighted Each daily grid weighted by the pixel count (categorical, by phase) Atmosphere Profile 07 Pixel Count Weighted Each daily grid weighted by the pixel count Aerosol 04 Water Vapor 05 * Weighting is applied to all non-count based statistics (mean, std); but not applied to histograms

Example of “Pixel Count Weighted with Pixel Count Screen” (Multiday Weighting Scheme Update - before and after images) Implemented in L 3 on 1 January 2004

Topic 2. The MODIS-Atmosphere Web Site modis-atmos. gsfc. nasa. gov

New Product Sections

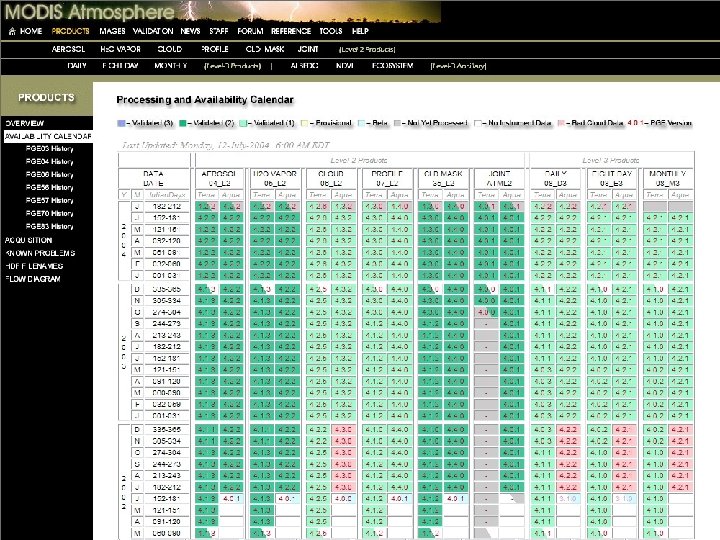
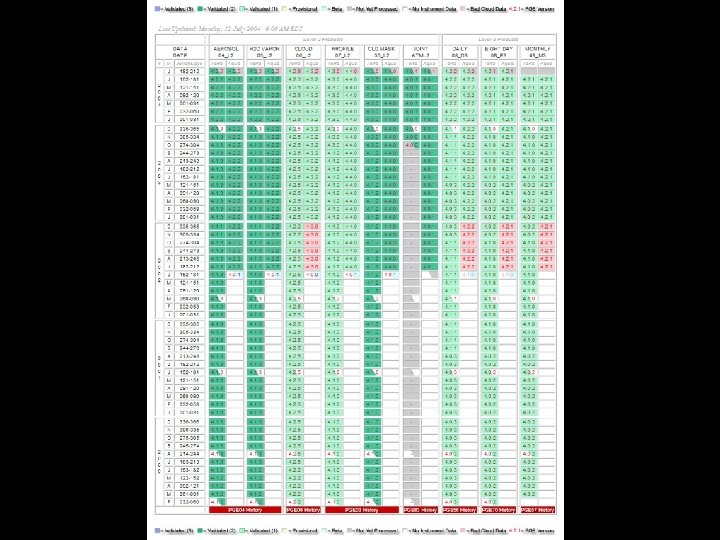
Data Product Processing and Availability Calendar

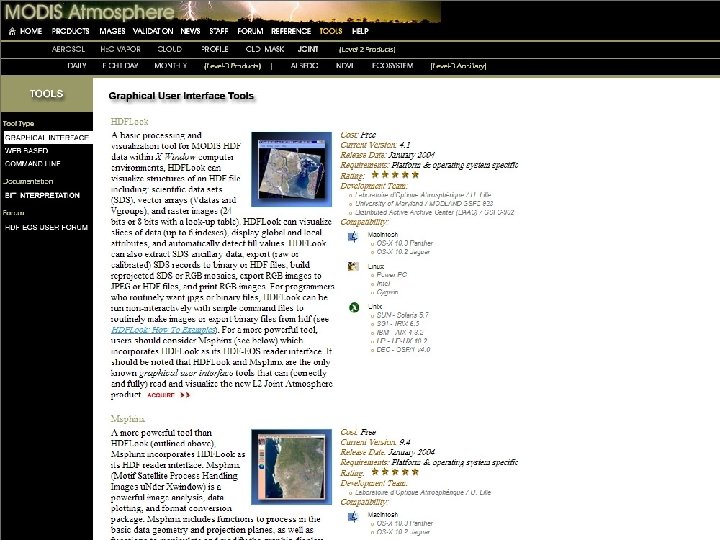
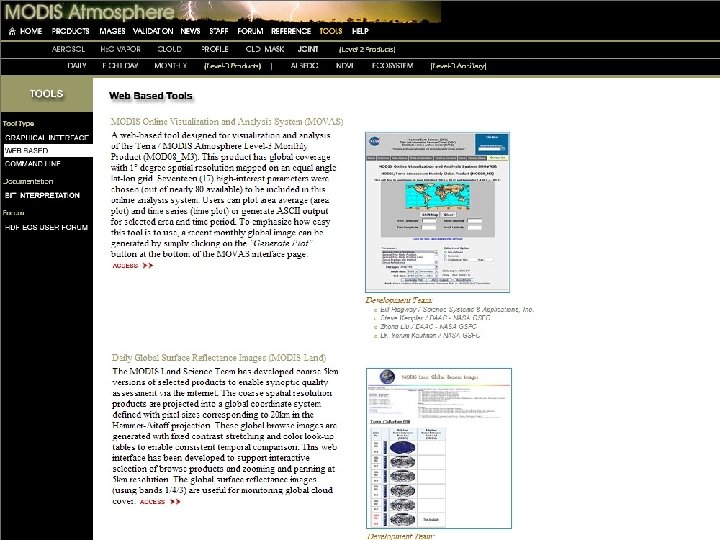
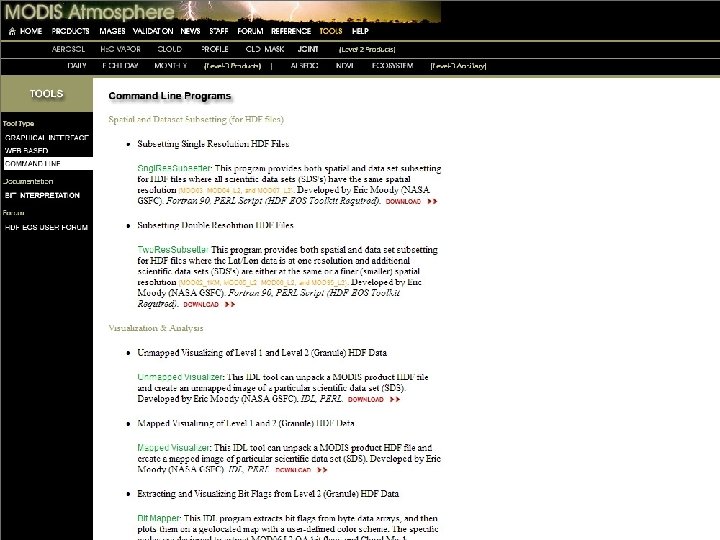
New Tools Section

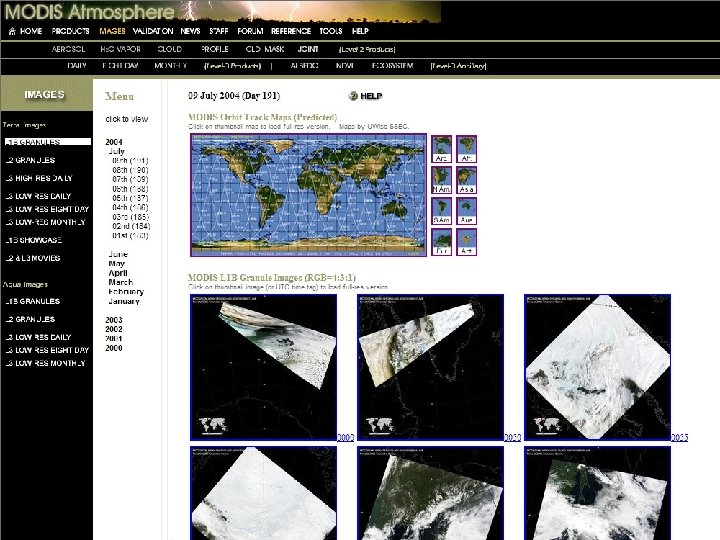
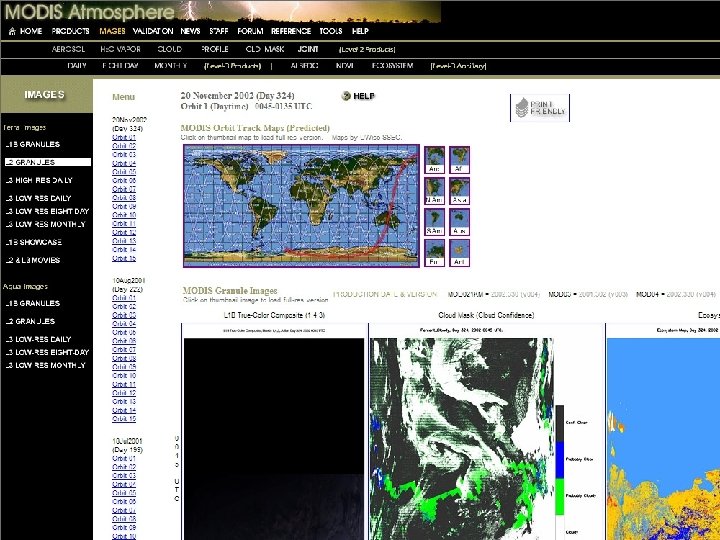
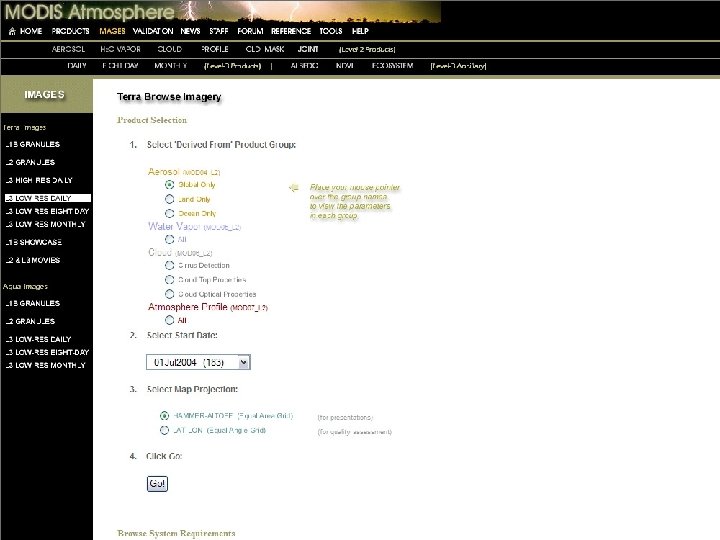
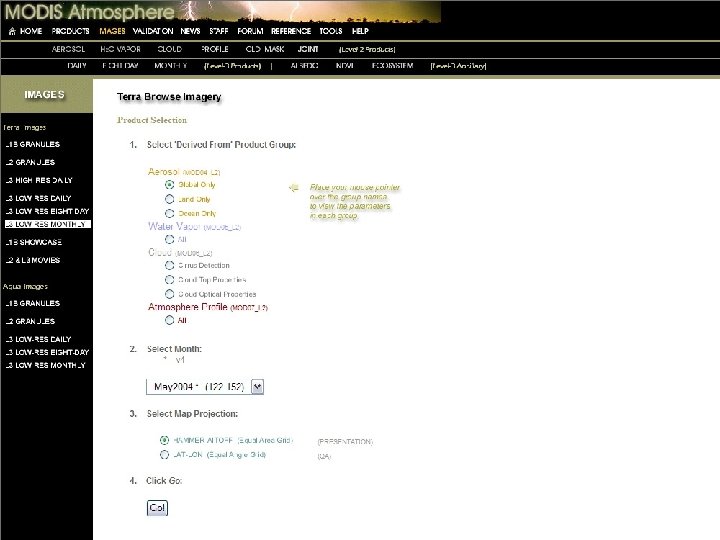
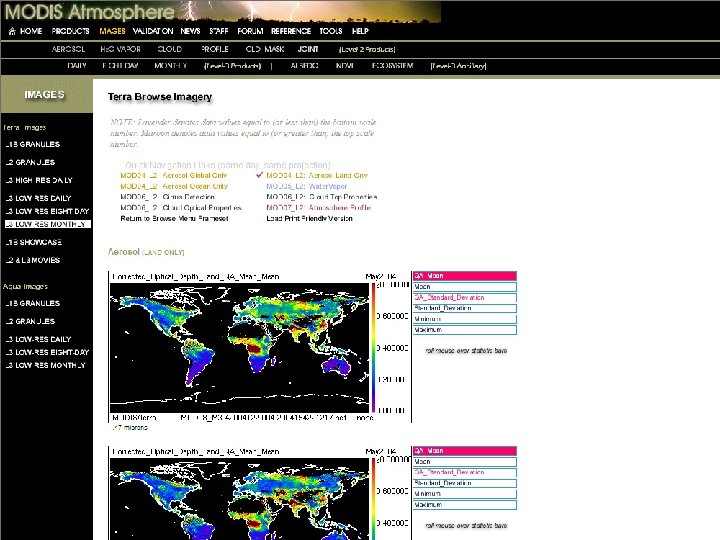
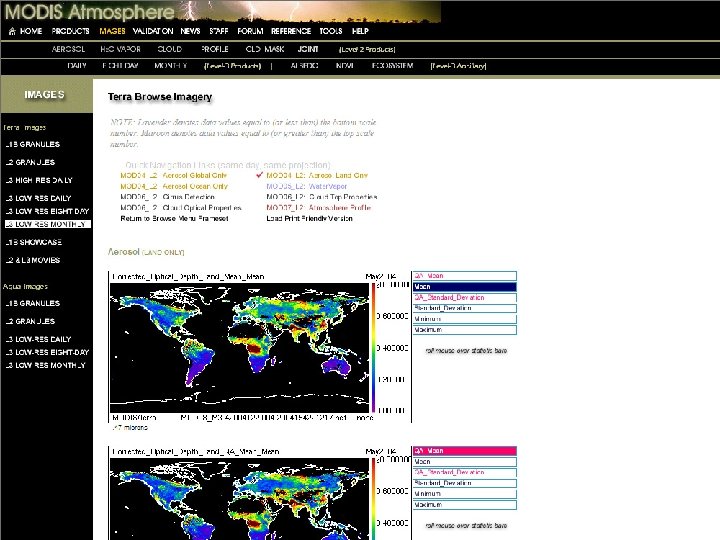
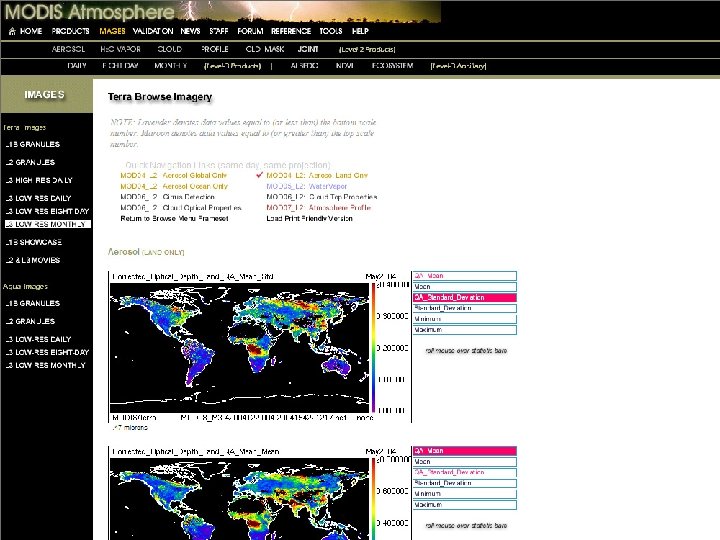
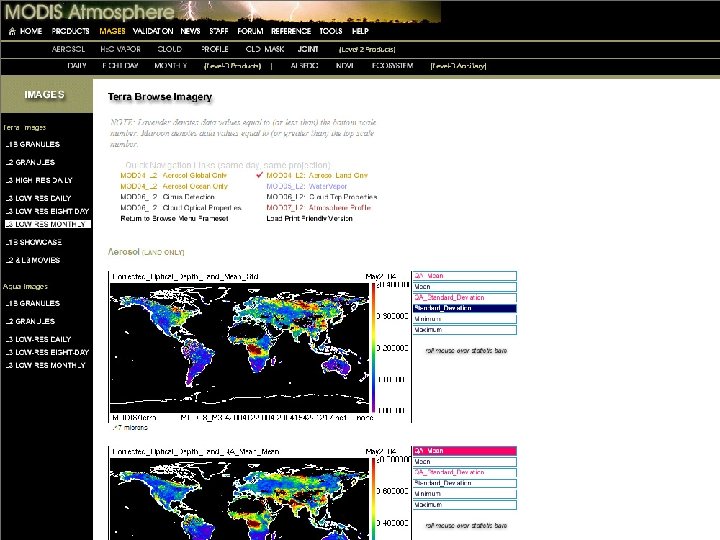
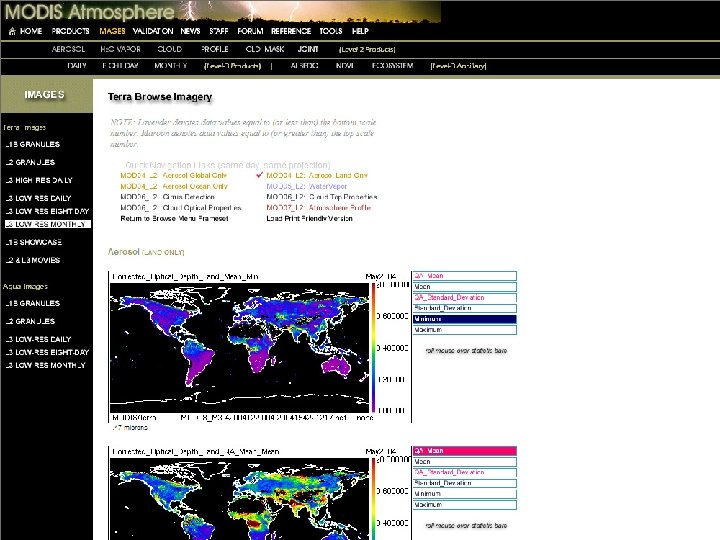
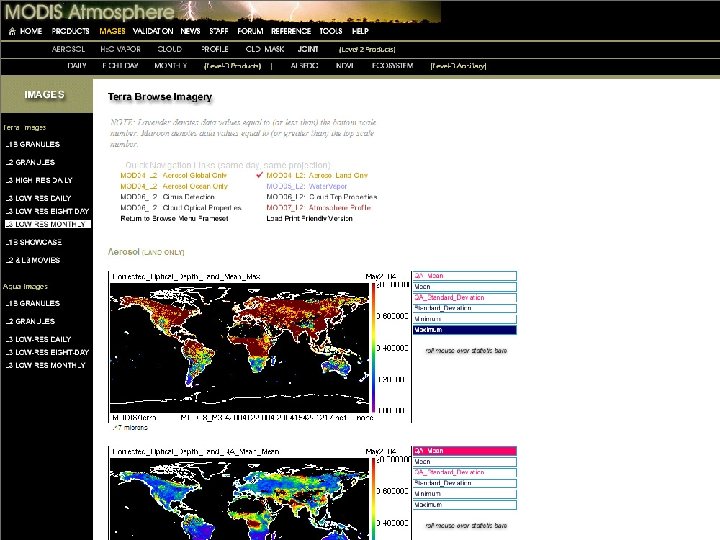
The Images Section

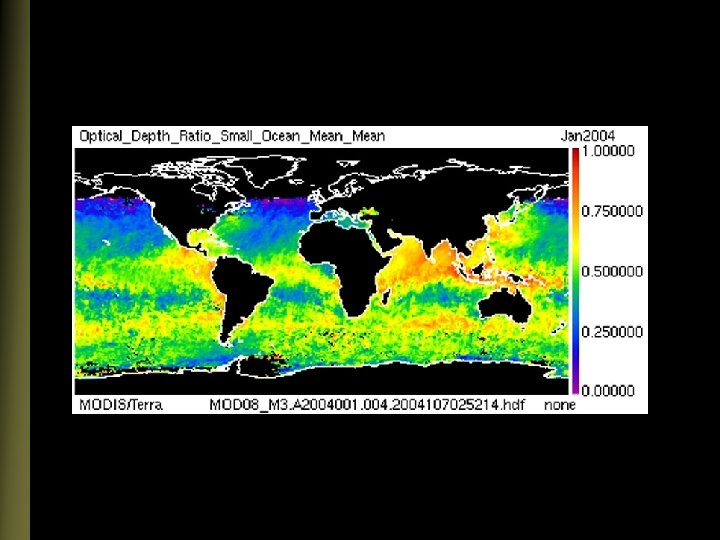
LL vs. HA Images: Data Detail Comparison Ø Equal Angle Grid 1 x 1° Lat-Lon Native L 3 Grid Ø Equal Area Grid Hammer-Aitoff Computed in IDL from Lat-Lon Image

Web Site Usage Statistics

Usage Statistics – Comparisons from 1 year ago March 2002 – March 2003 Ø Ø Unique visitors = 63, 000 Total downloads = 137 Terrabytes July 2003 – July 2004 Ø Ø Unique visitors = 148, 000 Total downloads = 742 Terrabytes

Topic 3. Using web & interactive tools to diagnose L 2 algorithm issues 3 Case Studies
")
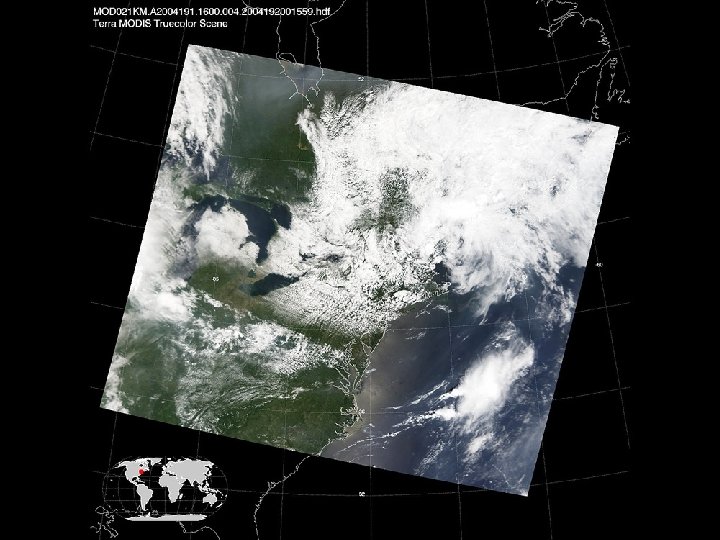
Case 1. The “Sahara Streak” (Aerosol)


Computation of Geolocation in L 2 Atmosphere Products 5 -km resolution Ø 5 -km geolocation is copied from center (3, 3) 1 -km L 1 B input pixel in each 5 x 5 km area 10 -km resolution Ø 10 -km geolocation is computed by averaging the 4 central (5, 5), (5, 6), (6, 5), (6, 6) 1 -km L 1 B input pixels in each 10 x 10 -km area
 Clear = bright")
Case 2. Anomalous Water Vapor scans (Water Vapor Near Infrared Clear) Clear = bright land ocean sunglint Similar anomalous property found in Cirrus Detection Parameters
 Image (”Clear” = bright land")
Dec 03 Monthly L 3 - Water Vapor (NIR) Image (”Clear” = bright land ocean sunglint only)
 Image (”Clear” = bright")
03 Dec 03 Daily L 3 - Water Vapor (NIR) Image (”Clear” = bright land ocean sunglint only)
 vs. Daily Water Vapor (NIR) 03 Dec 03")
L 1 B (Alaska) vs. Daily Water Vapor (NIR) 03 Dec 03
 7. 5 cm 0.")
L 1 B image vs. L 2 Water Vapor (NIR) 7. 5 cm 0. 0 cm
 Sunglint Cloudy Ocean")
L 1 B image vs. L 2 Surface Type Flag (NIR) Sunglint Cloudy Ocean Bright Land
 (Cloud Top Properties)")
Case 3. Unphysical results from Cirrus Fraction (IR) (Cloud Top Properties)

Two “CO 2 Slicing Algorithm” Cloud Flags set in 06_L 2 Quality_Assurance_5 km array Parameter Definitions: Cirrus Cloud: CTP ≤ 700 mb and CEE ≤ 0. 95 High Cloud: CTP < 400 mb → →

Cirrus Cloud: CTP ≤ 700 mb and CEE ≤ 0. 95 → High Cloud: CTP < 400 mb →

CO 2 Slicing Algorithm Old Cloud Top Properties CO 2 slicing subroutine: Ø High Cloud Flags initialized using “window retrieval” CTP’s. High Cloud Flags overwritten with valid “CO 2 retrieval” CTP’s. Ø Cirrus Flags were not initialized. Cirrus Flags overwritten with valid “CO 2 retrieval” CTP’s and CEE’s. Bug Fix Implemented for Collection 005 Ø Cirrus Flags initialized using “window retrieval” values.

Cirrus Cloud: CTP ≤ 700 mb and CEE ≤ 0. 95 → High Cloud: CTP < 400 mb →

Topic 4. Level-3 Collection 005 Change Summary
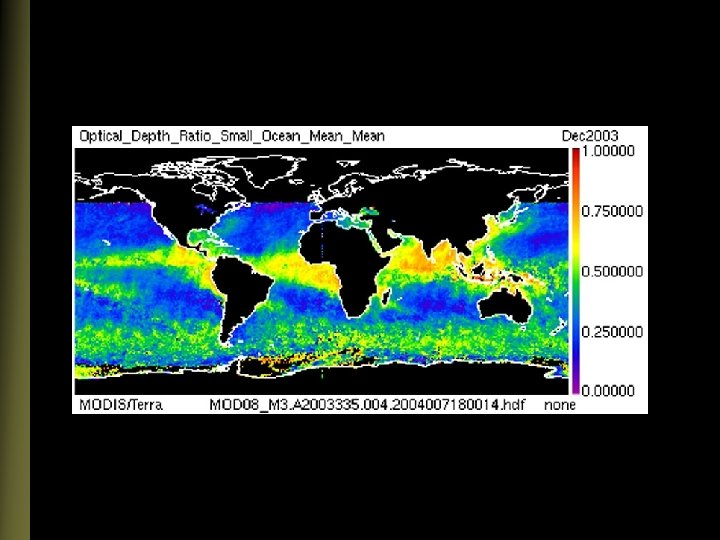
 statistics derived from Aerosol (04_L 2) • Combined Land &")
Daily Global (08_D 3) statistics derived from Aerosol (04_L 2) • Combined Land & Ocean • Land only Collection 005 Updates L 2 Aerosol algorithm improvements: - reduced snow contamination in land retrievals at the snow/ice edge
 statistics derived from Aerosol (04_L 2) • Ocean only Collection")
Daily Global (08_D 3) statistics derived from Aerosol (04_L 2) • Ocean only Collection 005 Updates
 statistics derived from Atm. Profile (07_L 2) Collection 005 Updates")
Daily Global (08_D 3) statistics derived from Atm. Profile (07_L 2) Collection 005 Updates
 statistics derived from Water Vapor (05_L 2) & Cloud (06_L")
Daily Global (08_D 3) statistics derived from Water Vapor (05_L 2) & Cloud (06_L 2) • Cirrus detection • Cloud Top properties Collection 005 Updates
 statistics derived from Cloud (06_L 2) • Cloud Optical properties")
Daily Global (08_D 3) statistics derived from Cloud (06_L 2) • Cloud Optical properties Collection 005 Updates File Size Change Est. C 004 D 3 = 440 mb C 005 D 3 = 550 mb
- Slides: 69