Modified Time Series Decomposition Model The Weathermen Rob

Modified Time Series Decomposition Model The Weathermen: Rob Harrison RD Trinidad Niall Needham

Presentation Overview • • • Company Background The Problem Methods of Attack The Model Results Managerial Recommendations

Skin. Ceuticals’ History • Founded in 1994 • Originally manufactured and sold 1 product • Now manufacture and distribute around 40 products to more to all 50 states and 30 countries worldwide

The Problem • Cash is being poured into stocking a large inventory to prevent backorders and potential lost sales • Skin. Ceuticals needs an accurate demand forecast for each individual product • Lead times

Methods of Attack • • • Associative Time Series? Product clustering Moving Averages Forecasting Software Time Series Decomposition Modified Time Series Decomposition

Time Series Decomposition Model • Breaks forecast into four components – Trend – Seasonal – Cyclical – Irregular
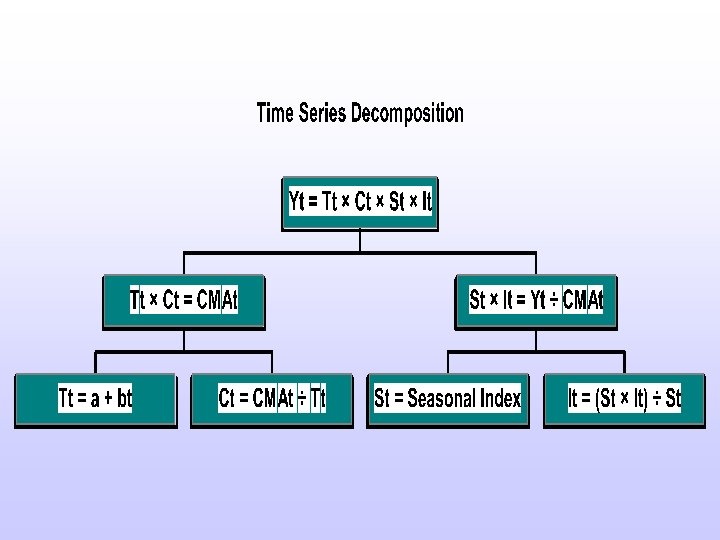

The Components • Trend Øb = ( t × Yt – ( t × Yt)/n) ( t 2 – ( t)2/n) Øa = Ŷ – b × ť • Cyclical ØC = CMA Tc • Seasonal and Irregular ØS × I = (T × C × S × I) (T × C) • Forecast ØFt = Tt × St × Ct

Modified Time Series Decomposition • Monthly Moving Error Forecast – Sales information for last year of sales deleted – Each of these months are forecasted – Forecast compared to actual sales data – Percent error is recorded and used in the final forecast

Yearly Results for Six Products Product # Total: A B C D E F Actual Demand 21795 Forecasted Demand 22047 Percentage Error 1% Actual Demand 18259 Forecasted Demand 18590 Percentage Error 2% Actual Demand 55501 Forecasted Demand 58004 Percentage Error 5% Actual Demand 9381 Forecasted Demand 9281 Percentage Error 1% Actual Demand 5169 Forecasted Demand 5290 Percentage Error 2% Actual Demand 4630 Forecasted Demand 4538 Percentage Error 2%

Monthly Results Prod. # A B C D E F 1 -Feb 1 -Mar 1 -Apr 1 -May 1 -Jun 1 -Jul 1 -Aug 1 -Sep 1 -Oct 1 -Nov 1 -Dec 2 -Jan Total: Actual 1855 2238 2226 1933 2198 1414 1323 1529 2101 1732 1165 2081 21795 Forecas t 1971 2377 2650 1701 2146 1736 1377 1178 1898 1602 1599 1812 22047 Error 6. 25% 6. 21% 19. 05% 12. 00% 2. 37% 22. 77% 4. 08% 22. 96% 9. 66% 7. 51% 37. 25% 12. 93% 1. 16% Actsal 1642 1442 1642 1727 1313 895 2269 1261 1510 995 1836 18259 Forecas t 2093 1762 2175 2430 1690 1265 1361 731 1552 1117 970 1444 18590 Error 27. 47% 22. 19% 32. 46% 40. 71% 2. 14% 3. 66% 52. 07% 67. 78% 23. 08% 26. 03% 2. 51% 21. 35% 1. 81% Actual 4989 5610 5044 4946 4185 3197 3638 4288 4556 4955 3527 6566 55501 Forecas t 5123 6084 5518 5087 5444 4142 4122 3963 4308 4279 4363 5571 58004 Error 2. 69% 8. 45% 9. 40% 2. 85% 30. 08% 29. 56% 13. 30% 7. 58% 5. 44% 13. 64% 23. 70% 15. 15% 4. 51% Actual 688 566 681 677 800 747 753 896 900 919 637 1117 9381 Forecas t 740 1074 744 734 807 857 765 712 671 654 589 934 9281 Error 7. 56% 89. 75% 9. 25% 8. 42% 0. 88% 14. 73% 1. 59% 20. 54% 25. 44% 28. 84% 7. 54% 16. 38% 1. 07% Actual 423 393 420 376 412 294 422 440 453 367 716 5169 Forecas t 388 720 494 428 475 427 369 299 434 363 409 484 5290 Error 8. 27% 83. 21% 17. 62% 13. 83% 15. 29% 45. 24% 12. 56% 32. 05% 4. 19% 19. 87% 11. 44% 32. 40% 2. 34% Actual 378 380 381 310 361 254 391 329 438 414 332 662 4630 Forecas t 340 644 414 320 416 354 323 283 387 325 332 400 4538 Error 10. 05% 69. 47% 8. 66% 3. 23% 15. 24% 39. 37% 17. 39% 13. 98% 11. 64% 21. 50% 0. 00% 39. 58% 1. 99%

Forecast Comparison

Forecast Comparison Cont.

Managerial Recommendations • The Modified Time Series Decomposition Model will increase have greater forecasting accuracy with time • In the meantime, the Modified Time Series Decomposition Model forecast should be used along with associative forecasting techniques to create a more accurate demand forecast.
- Slides: 14