Modes of Pattern Recognition system Dr N Santhiyakumari


![Fish x. T = [x 1, x 2] Weight Width](https://slidetodoc.com/presentation_image_h2/1f70f9152d2c72136076d37b8aab234f/image-10.jpg "Fish x. T = [x 1, x 2] Weight Width")


 NEURAL NETWORKS BAYESIAN HMM")


 33")


 Ø threshold Ø")


 where X is a set of numeric inputs Y")


 output")


 Momentum descent Advanced")


- Slides: 76
Modes of Pattern Recognition system Dr. N. Santhiyakumari Prof & Head/ECE Knowledge Institute of technology, Salem
What is Pattern Recognition? The study of how machines can observe the environment, learn to distinguish patterns of interest from their background Object Detection make sound and reasonable decisions about the categories of the patterns Classification
Examples of Pattern Recognition • Handwritten: sorting letters by postal code • Optical Character Recognition (OCR) • Printed texts: reading machines for blind people, digitalization of text documents. • Biometrics • Face recognition, verification, retrieval. • Finger prints recognition. • Speech recognition. • Diagnostic systems • Medical diagnosis: Abnormality Detection in MRI, ECG, EEG analysis. • Content Based Image Retrieval • Video Surveillance • Online Shopping • Advanced Compression / Denoising Techniques
Two Modes of a Pattern Recognition system Classification Mode test pattern training pattern Preprocessing Feature Extraction Classification Preprocessing Feature Extraction Selection Learning Training Mode
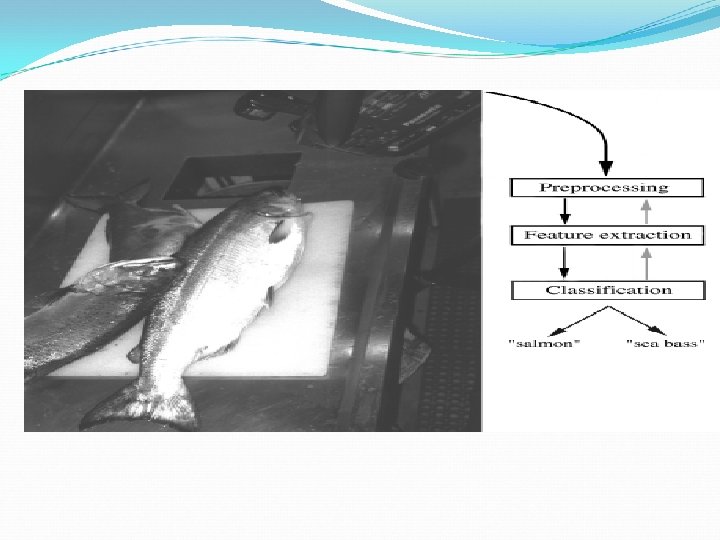
Example - Fish Classification “Sort incoming Fish on a conveyor according to species using optical sensing” Sea bass Species Salmon
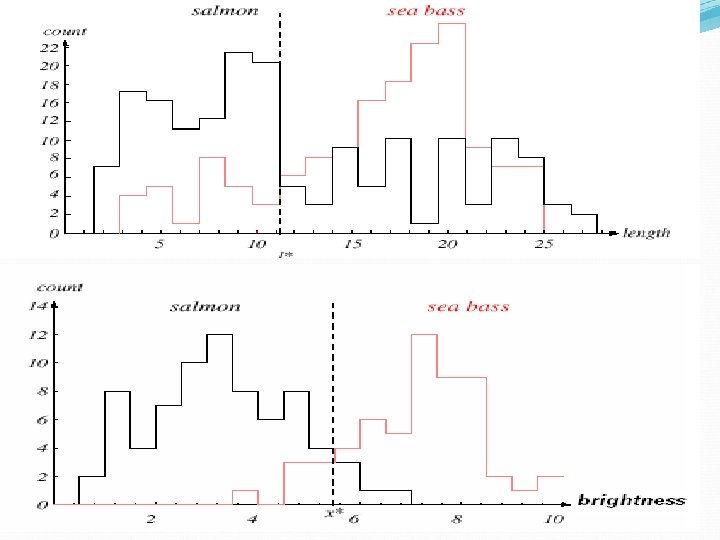
Preprocessing Use a segmentation operation to isolate fishes from one another and from the background To extract one fish for the next step Feature extraction Measuring certain features of the fish to be classified Is one of the most critical steps in the pattern recognition system design Classification Select the length of the fish as a possible feature for discrimination
Problem Analysis Useful features – Simple Set Length Brightness Width Number and shape of fins Position of the mouth, etc…
Fish x. T = [x 1, x 2] Weight Width
Dimensionality Reduction Feature Extraction Discriminant Features
Feature Selector m d, usually
Feature extraction Task: to extract features which are good for classification. Good features: • Objects from the same class have similar feature values. • Objects from different classes have different values. “Good” features “Bad” features
Classifier A classifier partitions feature space X into class-labeled regions such that and The classification consists of determining to which region a feature vector x belongs to. Borders between decision boundaries are called decision regions.
Overfitting and underfitting good fit Problem of generalization -overfitting
Feature Extraction
Feature Extractor xi Feature Extractor m d, usually yi
Feature Extraction Algorithms Chain Codes Skeleton Transforms 2 D Fourier Transform Principal Component Analysis Wavelet Transform Fisher Linear Discriminant
CLASSIFIERS CLUSTERING (K MEANS ALGORITHM) NEURAL NETWORKS BAYESIAN HMM
Classification Systems and Inductive Learning Pattern Feature Extraction Features Classification E Measurement of aspects of input pattern 1 vert. bar 3 horz. bars Mapping of features to class ID Class E Dominant application for ANNs Necessary to understand basic mathematics 20
Classification Systems and Inductive Learning 1. Parametric - when the distribution of patterns is known, and parameters can be estimated => STANDARD STATISTICS 2. Non-parametric - when distribution is unknown, and the number and type of parameters are unknown => ARTIFICIAL NEURAL NETWORKS 21
What Are Artificial Neural Networks? ØAn extremely simplified model of the brain ØEssentially a function approximator ●Transforms inputs into outputs to the best of its ability Inputs Outputs NN Outputs 22
Motivation for Neural Networks ØScientists are challenged to use machines effectively for tasks currently solved by humans. more ØSymbolic Rules don't reflect processes actually used by humans ØTraditional computing excels in many areas, but not in others. 23
Why use neural networks? ØNeural networks, with their remarkable ability to derive meaning from complicated or imprecise data, can be used to extract patterns and detect trends that are too complex to be noticed by either humans or other computer techniques. A trained neural network can be thought of as an "expert" in the category of information it has been given to analyse. Adaptive learning ØAn ability to learn how to do tasks based on the data given for training or initial experience. Self-Organisation ØAn ANN can create its own organisation or representation of the information it receives during learning time. Real Time Operation ØANN computations may be carried out in parallel, and special hardware devices are being designed and manufactured which take advantage of this capability. Fault Tolerance via Redundant Information Coding ØPartial destruction of a network leads to the corresponding degradation of performance. However, some network capabilities may be retained even with major network damage. 24
Where are neural networks being used? Signal processing: suppress line noise, with adaptive echo canceling, blind source separation Control: e. g. backing up a truck: cab position, rear position, and match with the dock get converted to steering instructions. Manufacturing plants for controlling automated machines. Siemens successfully uses neural networks for process automation in basic industries, e. g. , in rolling mill control more than 100 neural networks do their job, 24 hours a day Robotics - navigation, vision recognition Pattern recognition, i. e. recognizing handwritten characters, e. g. the current version of Apple's Newton uses a neural net Medicine, i. e. storing medical records based on case information Speech production: reading text aloud (NETtalk) Speech recognition Vision: face recognition , edge detection, visual search engines Business, e. g. . rules for mortgage decisions are extracted from past decisions made by experienced evaluators, resulting in a network that has a high level of agreement with human experts. Financial Applications: time series analysis, stock market prediction Data Compression: speech signal, image, e. g. faces Game Playing: backgammon, chess, go, . . . 25
Neural networks versus conventional computers ØNeural networks take a different approach to problem solving than that of conventional computers. Conventional computers use an algorithmic approach i. e. the computer follows a set of instructions in order to solve a problem. ØUnless the specific steps that the computer needs to follow are known the computer cannot solve the problem. That restricts the problem solving capability of conventional computers to problems that we already understand know how to solve. ØBut computers would be so much more useful if they could do things that we don't exactly know how to do. 26
ØNeural networks process information in a similar way the human brain does. The network is composed of a large number of highly interconnected processing elements(neurones) working in parallel to solve a specific problem. ØNeural networks learn by example. They cannot be programmed to perform a specific task. The examples must be selected carefully otherwise useful time is wasted or even worse the network might be functioning incorrectly. ØThe disadvantage is that because the network finds out how to solve the problem by itself, its operation can be unpredictable. 27
ØOn the other hand, conventional computers use a cognitive approach to problem solving; the way the problem is to solved must be known and stated in small unambiguous instructions. ØThese instructions are then converted to a high level language program and then into machine code that the computer can understand. ØThese machines are totally predictable; if anything goes wrong is due to a software or hardware fault. 28
ØNeural networks and conventional algorithmic computers are not in competition but complement each other. ØThere are tasks are more suited to an algorithmic approach like arithmetic operations and tasks that are more suited to neural networks. ØEven more, a large number of tasks, require systems that use a combination of the two approaches (normally a conventional computer is used to supervise the neural network) in order to perform at maximum efficiency. Neural networks do not perform miracles. But if used sensibly they can produce some amazing results 29
Human and Artificial Neurones. The synapse 30
From Human Neurones to Artificial Neurones The neuron model 31
An engineering approach A simple neuron. 32
Mc. Culloch and Pitts model (MCP) 33
Architecture of neural networks üFeed-forward networks üFeedback networks An example of a simple feedforward network 34
An example of a complicated network 35
Perceptrons 36
Learning ØSupervised learning ØUnsupervised learning Transfer Function Ø linear (or ramp) Ø threshold Ø sigmoid 37
¨ Artificial neuron Neural Network Structure ¨ An ANN is a set of processing elements (PEs) and connections with adjustable strengths (weights) input output 38
How Do Neural Networks Work? Train the Network 1. Present data to the network 2. Network computes an output 3. Network output compared to desired output 4. Network weights are modified to reduce error Use the Network 1. Present new data to the network 2. Network computes an output based on its training input output 39
Types of Neural Networks ADALINE Adaline Network BPN Backpropagation Network HOPFIELD Hopfield Model BAM Bidirectional Associative Memory BOLTZMAN Boltzmann Machine CPN Counterpropagation Network SOM Self-Organizing Map ART 1 Adaptive Resonance Theory 40
What Are They Used For? ØClassification Pattern recognition, feature extraction, image matching ØNoise Reduction Recognize patterns in the inputs and produce noiseless outputs ØPrediction Extrapolation based on historical data 41
How Do Perceptrons Learn? • Uses supervised training • If the output is not correct, the weights are adjusted according to the formula: α is the learning rate ■ wnew = w old + α(desired – output)*input 1 0. 5 0 0. 2 1 0. 8 1 * 0. 5 + 0 * 0. 2 + 1 * 0. 8 = 1. 3 > 1. 2 1 Assuming Output Threshold = 1. 2 Assume α = 1 W 1 new = 0. 5 + 1*(0 -1)*1 = -0. 5 W 2 new = 0. 2 + 1*(0 -1)*0 = 0. 2 W 3 new = 0. 8 + 1*(0 -1)*1 = -0. 2 42
Pattern Recognition - an example 43
The network of figure is trained to recognise the patterns T and H. The associated patterns are all black and all white respectively as shown below. If we represent black squares with 0 and white squares with 1 then the truth tables for the 3 neurones after generalisation are; X 11: 0 X 12: Top neuron 0 0 0 1 1 X 13: 0 1 0 1 OUT : 0 0 1 1 44
Middle neuron X 21: 0 0 1 1 X 22: 0 0 1 1 X 23: 0 1 0 1 OUT : 1 0/1 0/1 0 Bottom neuron X 21: 0 0 1 1 X 22: 0 0 1 1 X 23: 0 1 0 1 OUT : 1 0 1 1 0 0 1 0 45
From the tables it can be seen the following associasions can be extracted: In this case, it is obvious that the output should be all blacks since the input pattern is almost the same as the 'T' pattern. Here also, it is obvious that the output should be all whites since the input pattern is almost the same as the 'H' pattern. Here, the top row is 2 errors away from the a T and 3 from an H. So the top output is black. The middle row is 1 error away from both T and H so the output is random. The bottom row is 1 error away from T and 2 away from H. Therefore the output is black. The total output of the network is still in favour of the T shape. 46
47
Typical ANN Applications Classification Medical diagnosis, target recognition, character recognition, fraud detection, speech recognition Function Approximation Process modeling, process control, data modeling, machine diagnostics Time Series Prediction Financial forecasting, bankruptcy prediction, sales forecasting, dynamic system modeling Data Mining Clustering, data visualization, data extraction 48
Classification Similar to function approximation except that the output is a “class”, thus they are discrete For example: Outputs = on or off Outputs = Ford, Chevy, or Buick Outputs = Sick or Healthy Classification problems are evaluated by thresholding the outputs of the model 49
Classification Example Optical Character Recognition: determine if the input image is the digit 0, 1, 2, 3, … 9 For more than 2 classes, typically we create one output for each class (e. g. class 0: true or false, class 1: true or false, etc. ). This is called unary encoding. 10 outputs (0. . . 9). Each image is labeled with a class image 0 will be (1, 0, 0, 0) image 1 will be (0, 1, 0, 0, 0, 0), etc. Must train the network to recognize the digit 50
Function Approximation Y = f(X) where X is a set of numeric inputs Y is a set of numeric outputs f() is an unknown functional relationship between the input and the output The ANN must approximate f() in order to find the appropriate output for each set of inputs 51
Function Approximation Example Use a neural network to create a model that can be used to estimate the “body density” (e. g. % body fat) of an individual. Train the neural network Inputs: Age (years), Weight (lbs), Height (inches), Neck circumference (cm), Chest circumference (cm), Abdomen circumference (cm), Hip circumference (cm), Thigh circumference (cm), Knee circumference (cm), Ankle circumference (cm), Biceps (extended) circumference (cm), Forearm circumference (cm), Wrist circumference (cm) Output: Actual body density measured with a submersion test Use the neural network Inputs: Same as above Output: Estimate of the body fat percentage 52
Time Series Prediction Time series prediction is very similar to function approximation except time plays an important role In “static” function approximation, all information needed to create the output is contained in the current input (e. g. , image processing) In time series prediction (dynamic function approximation), information from the past is needed to determine the output (e. g. , stock price prediction) 53
Time Series Prediction Example Predict Mackey Glass chaotic signal Chaos is a signal that has characteristics similar to randomness, but can be predicted accurately in the short term (e. g. , weather) Accurate predictions can be made only a few samples in advance 54
Data mining/Preprocessing All of the three previous problem types required a known (desired) output for each input In data mining, you don’t know the answer ahead of time -you want to extract data from the input Clustering Compression Principal Component Analysis This type of network is called “unsupervised” because there is no “teaching” signal 55
Data Mining/Preprocessing Example Clustering Cluster 2 D data into N different clusters Divide up the input space into N regions Uses competitive learning Data Mining ü Prediction - use some variables or fields in the database to predict unknown or future values of other variables of interest. üClassification - map (classify) a data item into one of several predefined classes. üChange and Deviation Detection - uncover certain data records that are in some way out of the ordinary records; determine, which cases/records suspiciously diverge from the pattern of their peers. üKnowledge Discovery - find new relationships and non-obvious trends in the data. üResponse Modeling - build a neural network based response model. üTime Series Analysis - forecast future values of a time series. 56
Neural Networks in Practice sales forecasting industrial process control customer research data validation risk management target marketing Neural Networks in business Marketing Credit Evaluation Neural networks in medicine Modelling and Diagnosing the Cardiovascular System Electronic noses Instant Physician 57
Sales and Marketing Sales Forecasting - predict future sales based on historical information about previous marketing and sales activities. Input data: historical data about marketing budget, number of ads, special offers and other factors affecting sales. Targeted Marketing - reduce costs by targeting a particular marketing campaign to the group of people which have the highest response rate. Avoid wasting money on unlikely targets. Input data: information about customers and their response rate. Service Usage Forecasting - forecast the number of service calls, customer transactions, customer arrivals, reservations or restaurant covers (patrons) in order to effectively schedule enough staff to handle the workload. Input data: season, day-of-week, hour of the day, special events in the city/area, marketing budget, promotional events, weather, etc. Retail Margins Forecasting - forecast the behavior of margins in the future to determine the effects of price changes at one level on returns at the other. Input data: retail prices, expenditures at the retail level, marketing costs, past margin values, price variability and other market characteristics. 58
Financial Stock Market Prediction - predict the future movement of the security using the historical data of that security. Input data: Open, High, Low, Close, Volume, technical indicators, market indexes and prices of other securities. Credit Worthiness - decide whether an applicant for a loan is a good or bad credit risk. Input data: applicant's personal data, income, expenses, previous credit history, etc. Credit Rating - assign credit ratings to companies or individuals based on their financial state. Input data: current financial state indicators and past financial performance of a company or individual. Bankruptcy prediction - classify a company as potential bankruptcy. Input data: company characteristics and business ratios, such as working capital/total assets, retained earnings/total assets, earnings before interest and taxes/total assets, market value of equity/total debt, and sales/total assets. Property Appraisal - evaluate real estate, automobiles, machinery and other property. Input data: property parameters, environment conditions as well as appropriate demographic, ecological, industrial and other factors. Fraud Detection - detect and automatically decline fraudulent insurance claims, client transactions, and taxes. Input data: transaction parameters, applicant's information and other data of past incident 59
Price Forecasts - forecast prices of raw materials, commodities, and products. Input data: previous price movements, economical indicators, market indexes. Economic Indicator Forecasts - forecast economic indicators for the next week, month, and quarter. Input data: social and economical indicators, time-series data of an indicator. Industrial Process Control - determine the best control settings for a plant. Complex physical and chemical processes that may involve interaction of numerous (possibly unknown) mathematical formulas can be modeled heuristically using a neural network. Quality Control - predict the quality of plastics, paper, and other raw materials; machinery defect diagnosis; diesel knock testing, tire testing, beer testing. Input data: product/part/machinery characteristics, quality factor. Temperature and force prediction in mills and factories Input data: previous values of temperature, force and other characteristics of mills and factories. 60
Human Resources Management Employee Selection and Hiring - predict on which job an applicant will achieve the best job performance. Input data: information about an applicant: personal information, previous jobs, educational levels, previous performance, etc. Employee Retention - identify potential employees who are likely to stay with the organization for a significant amount of time based on data about an applicant. Input data: applicant's hours of availability, previous jobs, educational levels and other routine information. Staff Scheduling - predict staff requirements for restaurants, retail stores, police stations, banks, etc. Input data: time of year, day of week, pay-days, holidays, weather, etc. Personnel Profiling - forecast successful completion of training program; identify employees most suitable for a certain task. Input data: background characteristics of individuals. 61
Medical Diagnosis - Assisting doctors with their diagnosis by analyzing the reported symptoms. Input data: patient's personal information, patterns of symptoms, heart rate, blood pressure, temperature, laboratory results, etc. Detection and Evaluation of Medical Phenomena - detect epileptic attacks, estimate prostate tumor size, detects patient breathing abnormalities when a patient is under anesthesia, etc. Input data: patient's personal information, breathing rate, heart rate, patterns of symptoms, blood pressure, temperature, etc. Patient's Length of Stay Forecasts - forecast which patients remain for a specified number of days. Input data: personal information such as age and sex, level of physical activity, heart rate, blood pressure, temperature and laboratory results, treatment procedures, etc. Treatment Cost Estimation Input data: personal information such as age and sex, physiological data, the use of drug or otherapies, treatment procedures, number of recurrences after first treatment, etc. 62
Operational Analysis Retail Inventories Optimization - forecast optimal stock level that can meet customer needs, reduce waste and lessen storage; predict the demand based on previous buyers' activity. Input data: characteristics of previous buyers' activity, operating parameters, season, stock, and budgets. Scheduling Optimization - predict demand to schedule buses, airplanes, and elevators. Input data: season, day-of-week, hour of the day, special events in the city/area, weather, etc. Managerial decision making - select the best decision option using the classification capabilities of neural network. Input data: initial problem parameters and final outcome. Cash flow forecasting - maximize the use of resources with more accurate cash flow forecasts. Input data: accounts payable, accounts receivable, sales forecasts, budgets, capital expenditures, stock, season, operating data, etc. 63
Science Pattern Recognition Recipes and Chemical Formulation Optimization Chemical Compound Identification Physical System Modeling Ecosystem Evaluation Polymer Identification Recognizing Genes Botanical Classification Signal Processing: Neural Filtering Biological Systems Analysis Ground Level Ozone Prognosis Odor Analysis and Identification 64
Educational Teaching Neural Networks Neural Network Research College Application Screening Predict Student Performance Energy Electrical Load Forecasting Energy Demand Forecasting Short and Long-Term Load Estimation Predicting Gas/Coal Index Prices Power Control Systems Hydro Dam Monitoring Other Sports Betting Making Horse and Dog Racing Picks Quantitative Weather Forecasting Games Development Optimization Problems, Routing Agricultural Production Estimates 65
Network Design & Training 66
Network Design & Training Issues Design: Architecture of network Structure of artificial neurons Learning rules Training: Ensuring optimum training Learning parameters Data preparation and more. . 67
Network Design 68
Network Design Architecture of the network: How many nodes? Determines number of network weights How many layers? How many nodes per layer? Input Layer Hidden Layer Output Layer Automated methods: augmentation (cascade correlation) weight pruning and elimination 69
Network Design Architecture of the network: Connectivity? Concept of model or hypothesis space Constraining the number of hypotheses: selective connectivity shared weights recursive connections 70
Network Design Structure of artificial neuron nodes Choice of input integration: summed, squared and summed multiplied Choice of activation (transfer) function: sigmoid (logistic) hyperbolic tangent Guassian linear soft-max 71
Network Design Selecting a Learning Rule Generalized delta rule (steepest descent) Momentum descent Advanced weight space search techniques Global Error function can also vary - normal - quadratic - cubic 72
Network Training 73
Network Training How do you ensure that a network has been well trained? Objective: To achieve good generalization accuracy on new examples/cases Establish a maximum acceptable error rate Train the network using a validation test set to tune it Validate the trained network against a separate test set which is usually referred to as a production test set 74
Network Training Mastering ANN Parameters Typical Range learning rate 0. 1 0. 01 - 0. 99 momentum 0. 8 0. 1 - 0. 9 weight-cost 0. 1 0. 001 - 0. 5 Fine tuning : - adjust individual parameters at each node and/or connection weight automatic adjustment during training 75
THANKYOU