Modern Evolutionary Biology I Population Genetics II Genes

Modern Evolutionary Biology I. Population Genetics II. Genes and Development: "Evo-Devo" A. Overview Can changes like this…. …explain changes like this?

Modern Evolutionary Biology I. Population Genetics II. Genes and Development: "Evo-Devo" …explain changes like this? A. Overview Can changes like this…. Differences correlate with what they make (different proteins make them different colors) Differences don’t correlate with what they make; they are pretty much the same stuff, just in a different shape.

Modern Evolutionary Biology I. Population Genetics II. Genes and Development: "Evo-Devo" A. Overview - the importance of embryology and development: In embryological development, we see structures emerging where they did not exist before. Maybe the evolution of new structures during the history of life ‘emerged’ in the same way, through the evolution and regulation of developmental pathways that gave rise to new structures.

Modern Evolutionary Biology I. Population Genetics II. Genes and Development: "Evo-Devo" A. Overview B. Homeotic Genes

Modern Evolutionary Biology I. Population Genetics II. Genes and Development: "Evo-Devo" A. Overview B. Homeotic Genes Normal antennae “antennapedia mutant

Modern Evolutionary Biology I. Population Genetics II. Genes and Development: "Evo-Devo" A. Overview B. Homeotic Genes

Modern Evolutionary Biology I. Population Genetics II. Genes and Development: "Evo-Devo" A. Overview B. Homeotic Genes

Modern Evolutionary Biology I. Population Genetics II. Genes and Development: "Evo-Devo" A. Overview B. Homeotic Genes

Modern Evolutionary Biology I. Population Genetics II. Genes and Development: "Evo-Devo" A. Overview B. Homeotic Genes C. Environmental Effects and Phenotypic Plasticity without fish predators with fish predators

Modern Evolutionary Biology I. Population Genetics II. Genes and Development: "Evo-Devo" A. Overview B. Homeotic Genes C. Environmental Effects and Phenotypic Plasticity Norm of reaction Selection for making that phenotype more efficiently selection

Modern Evolutionary Biology I. Population Genetics II. Genes and Development: "Evo-Devo" A. Overview B. Homeotic Genes C. Environmental Effects and Phenotypic Plasticity D. Regulation and Selection

Modern Evolutionary Biology I. Population Genetics II. Genes and Development: "Evo-Devo" A. Overview B. Homeotic Genes C. Environmental Effects and Phenotypic Plasticity D. Regulation and Selection

Modern Evolutionary Biology I. Population Genetics II. Genes and Development: "Evo-Devo" A. Overview B. Homeotic Genes C. Environmental Effects and Phenotypic Plasticity D. Regulation and Selection E. Allometry and Speciation Allometry – difference in growth rates of different body parts – causes change in body proportionality

Modern Evolutionary Biology I. Population Genetics II. Genes and Development: "Evo-Devo" A. Overview B. Homeotic Genes C. Environmental Effects and Phenotypic Plasticity D. Regulation and Selection E. Allometry and Speciation Allometry – difference in growth rates of different body parts – causes change in body proportionality

II. Genes and Development: "Evo-Devo" A. Overview B. Homeotic Genes C. Environmental Effects and Phenotypic Plasticity D. Allometry and Speciation VARIATION Recombination DEVELOPMENT Mutation Agents of Change PHYSIOLOGY Sources of Variation Selection Drift Mutation Migration Non-Random Mating

Modern Evolutionary Biology I. Population Genetics II. Genes and Development: "Evo-Devo" III. Species A. Overview

Modern Evolutionary Biology I. Population Genetics II. Genes and Development: "Evo-Devo" III. Species and Phylogenies A. Overview B. What is a Species? 1. Morphological species concept: “a species is what a professional taxonomist says it is”

B. What is a Species? 1. Morphological species concept: Problems… Polymorphism Sibling species H. erato H. melpomene

B. What is a Species? 1. Morphological species concept: 2. Biological species concept: “a group of interbreeding organisms that are reproductively isolated from other such groups” – Ernst Mayr

B. What is a Species? 1. Morphological species concept: 2. Biological species concept: “a group of interbreeding organisms that are reproductively isolated from other such groups” Problems: Asexual species? Fossils? The process of divergence…

B. What is a Species? C. How Does Speciation Occur? Pre-zygotic Isolating Mechanisms Post-zygotic Isolating Mechanisms Geographic isolation Genome Incompatibility Temporal Isolation Hybrid Sterility Behavioral Isolation Low Hybrid Fitness Mechanical Isolation Chemical Isolation

IV. Reconstructing Phylogenies A. Fossil Evidence 1. Radioactive Decay and Geological Clocks 1862 – “Lord Kelvin” 1903 – Marie Curie 1904 - Ernst Rutherford "The discovery of the radio-active elements, which in their disintegration liberate enormous amounts of energy, thus increases the possible limit of the duration of life on this planet, and allows the time claimed by the geologist and biologist for the process of evolution. “ - Rutherford

IV. Reconstructing Phylogenies A. Fossil Evidence 1. Radioactive Decay and Geological Clocks - measure amt of parent and daughter isotopes = total initial parental - with the measureable 1/2 life, determine time needed to decay this fraction - K 40 -Ar 40 suppose 1/2 of total is Ar 40 = 1. 3 by (Now, you might say "be real"! How can we measure something that is this slow? ) Well, 40 grams of Potassium (K) contains: 6. 0 x 1023 atoms (Avogadro's number, remember that little chemistry tid-bit? ). So, For 1/2 of them to change, that would be: 3. 0 x 1023 atoms in 1. 3 billion years (1. 3 x 10⁹) So, divide 3. 0 x 1023 by 1. 3 x 109 = 2. 3 X 10¹⁴ atoms/year. Then, divide 2. 3 x 1014 by 365 (3. 65 x 102) days per year = 0. 62 x 1012 atoms per day ( shift decimal = 6. 2 x 10¹¹) Then, divide 6. 2 x 1011 by 24*60*60 = 86, 400 seconds/day: (= 8. 64 x 104) = 0. 7 x 10⁷ atoms per second 0. 7 x 107 = 7 x 106 = 7 million atoms changing from Potassium to Argon every second!!!

IV. Reconstructing Phylogenies A. Fossil Evidence 1. Radioactive Decay and Geological Clocks 2. Transitional Fossils a. Ichthyostega and the fish-amphibian transition FISH AMPHIBIANS Ichthyostega - Struts in the tailfin (FISH) - Feet (AMPHIBIANS) XXX - After fish, before amphibians (just where evolution predicts it should be)
 - Placoderms - Sharks - Lobe-finned Fishes 365 mya")
D. Devonian (417 -354 mya) - Placoderms - Sharks - Lobe-finned Fishes 365 mya 385 mya

IV. Reconstructing Phylogenies A. Fossil Evidence 1. Radioactive Decay and Geological Clocks 2. Transitional Fossils a. Ichthyostega and the fish-amphibian transition

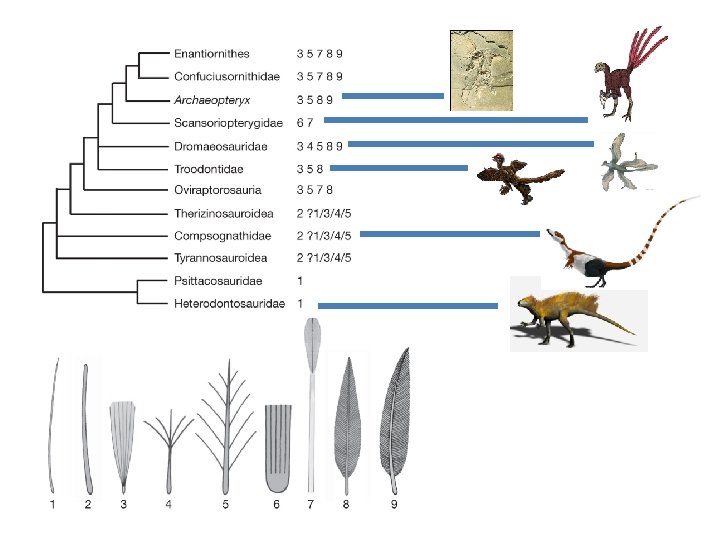
IV. Reconstructing Phylogenies A. Fossil Evidence 1. Radioactive Decay and Geological Clocks 2. Transitional Fossils b. The evolution of birds REPTILES BIRDS XXX – 150 mya - Fingers, teeth, tail (Reptiles) - Feathers (birds) - After reptiles, before birds (just where evolution predicts it should be) Archeopteryx lithographica

IV. Reconstructing Phylogenies A. Fossil Evidence 1. Radioactive Decay and Geological Clocks 2. Transitional Fossils b. The evolution of birds

IV. Reconstructing Phylogenies A. Fossil Evidence 1. Radioactive Decay and Geological Clocks 2. Transitional Fossils b. The evolution of birds Epidipteryx – 165 mya

IV. Reconstructing Phylogenies A. Fossil Evidence 1. Radioactive Decay and Geological Clocks 2. Transitional Fossils b. The evolution of birds Microraptor – 120 mya

IV. Reconstructing Phylogenies A. Fossil Evidence 1. Radioactive Decay and Geological Clocks 2. Transitional Fossils b. The evolution of birds Anchiornis – 160 mya

IV. Reconstructing Phylogenies A. Fossil Evidence 1. Radioactive Decay and Geological Clocks 2. Transitional Fossils b. The evolution of birds Sinosauropteryx – 120 mya

IV. Reconstructing Phylogenies A. Fossil Evidence 1. Radioactive Decay and Geological Clocks 2. Transitional Fossils b. The evolution of birds Tianyulong – 200 mya

IV. Reconstructing Phylogenies A. Fossil Evidence 1. Radioactive Decay and Geological Clocks 2. Transitional Fossils c. The evolution of mammals REPTILES Therapsids MAMMALS - Mammalian skeleton - Intermediate ear - primitive dentition XXX - After reptiles, before mammals (just where evolution predicts it should be)
 Therapsids from the Permian (280 mya) to the")
Mammals from the Jurassic (185 mya) Therapsids from the Permian (280 mya) to the Triassic (200 mya) Pelycosaur Reptiles of the Carboniferous (300 mya)

IV. Reconstructing Phylogenies A. Fossil Evidence 1. Radioactive Decay and Geological Clocks 2. Transitional Fossils d. The evolution of humans APES Australopithecines HUMANS - After apes, before humans (just where evolution predicts it should be) - bipedal (human trait) - chimp-sized cranial volume XXX

IV. Reconstructing Phylogenies A. Fossil Evidence 1. Radioactive Decay and Geological Clocks 2. Transitional Fossils d. The evolution of humans Australopithecines Australopithecus afarensis

IV. Reconstructing Phylogenies A. Fossil Evidence 1. Radioactive Decay and Geological Clocks 2. Transitional Fossils d. The evolution of humans Teeth

IV. Reconstructing Phylogenies A. Fossil Evidence 1. Radioactive Decay and Geological Clocks 2. Transitional Fossils d. The evolution of humans Legs

IV. Reconstructing Phylogenies A. Fossil Evidence 1. Radioactive Decay and Geological Clocks 2. Transitional Fossils d. The evolution of humans Skulls

IV. Reconstructing Phylogenies A. Fossil Evidence 1. Radioactive Decay and Geological Clocks 2. Transitional Fossils d. The evolution of humans

IV. Reconstructing Phylogenies A. Fossil Evidence 1. Radioactive Decay and Geological Clocks 2. Transitional Fossils e. Summary After 150 years of paleontology in the Darwinian age, we have remarkably good transitional sequences that link all major groups of vertebrates. This solves Darwin’s dilemma – sequences of intermediates DO exist – and we have found many of them, even though fossilization is a rare event.

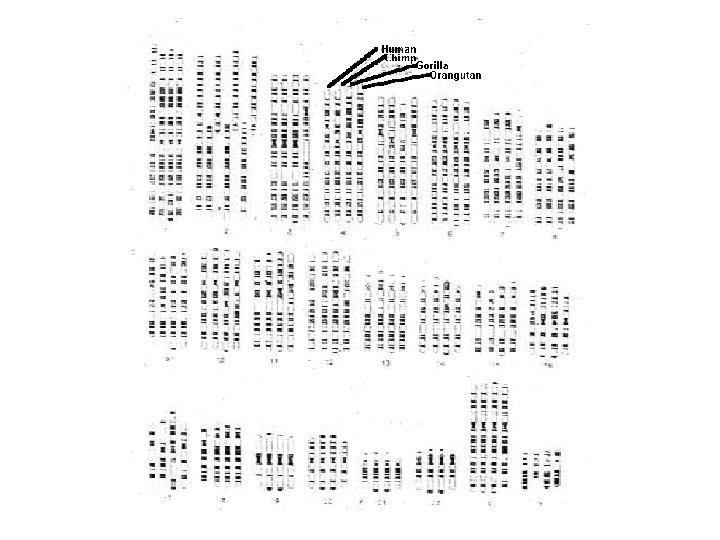
IV. Reconstructing Phylogenies A. Fossil Evidence B. Genetic Evidence 1. Gross Chromosomal Similarities

IV. Reconstructing Phylogenies A. Fossil Evidence B. Genetic Evidence 1. Gross Chromosomal Similarities 2. Mutational Clocks - mutations tend to accumulate in a DNA sequence at a constant rate… so if we count up the genetic differences between organisms and we know the rate, we can determine how must time must have elapsed for these differences to accumulate. (Time since divergence).

IV. Reconstructing Phylogenies A. Fossil Evidence B. Genetic Evidence 1. Gross Chromosomal Similarities 2. Mutational Clocks 3. Genetic Phylogenies Chen and Li, 2001. Percentage sequence divergence between humans and other hominids[4] Locus Human-Chimp Human-Gorilla Human-Orangutan Alu elements 2 - - Non-coding (Chr. Y) 1. 68 ± 0. 19 2. 33 ± 0. 2 5. 63 ± 0. 35 Pseudogenes (autosomal) 1. 64 ± 0. 10 1. 87 ± 0. 11 - Pseudogenes (Chr. X) 1. 47 ± 0. 17 - - Noncoding (autosomal) 1. 24 ± 0. 07 1. 62 ± 0. 08 3. 08 ± 0. 11 Genes (Ks) Introns Xq 13. 3 1. 11 0. 93 ± 0. 08 0. 92 ± 0. 10 1. 48 1. 23 ± 0. 09 1. 42 ± 0. 12 2. 98 3. 00 ± 0. 18 Subtotal for X 1. 16 ± 0. 07 1. 47 ± 0. 08 - Genes (Ka) 0. 8 0. 93 1. 96

IV. Reconstructing Phylogenies A. Fossil Evidence B. Genetic Evidence 1. Gross Chromosomal Similarities 2. Mutational Clocks 3. Genetic Phylogenies Stauffer, et al. , (2001). J. Hered.

IV. Reconstructing Phylogenies A. Fossil Evidence B. Genetic Evidence C. Concordant Phylogenies Testing Evolutionary Theory (yet again) IF species are descended from common ancestors (like people in a family), and IF we know the rate of genetic change (mutation), THEN we should be able to compare genetic similarity and predict when common ancestors lived. AND, if the fossil record is also a product of evolution, THEN the species though to be ancestral to modern groups should exist at this predicted age, too. In other words, we should be able to compare DNA and protein sequences in living species and predict where, in the sedimentary strata of the Earth’s crust, a third different species should be.

IV. Reconstructing Phylogenies A. Fossil Evidence B. Genetic Evidence C. Concordant Phylogenies Clustering analysis based on amino acid similarity across seven proteins from 17 mammalian species.

IV. Reconstructing Phylogenies A. Fossil Evidence B. Genetic Evidence C. Concordant Phylogenies Now, we date the oldest mammalian fossil, which our evolution hypothesis dictates should be ancestral to all mammals, both the placentals (species 1 -16) and the marsupial kangaroo. …. This dates to 120 million years 16

IV. Reconstructing Phylogenies A. Fossil Evidence B. Genetic Evidence C. Concordant Phylogenies And, through our protein analysis, we already know how many genetic differences (nitrogenous base substitutions) would be required to account for the differences we see in these proteins - 98. 16

C. Concordant Phylogenies So now we can plot genetic change against time, hypothesizing that this link between placentals and marsupials is ancestral to the other placental mammals our analysis. 16

C. Concordant Phylogenies Now we can test a prediction. IF genetic similarity arises from descent from common ancestors, THEN we can use genetic similarity to predict when common ancestors should have lived. . . 16

C. Concordant Phylogenies This line represents that prediction. Organisms with more similar protein sequences (requiring fewer changes in DNA to explain these protein differences) should have more recent ancestors. . . 16

C. Concordant Phylogenies And the prediction here becomes even MORE precise. For example, we can predict that two species, requiring 50 substitutions to explain the differences in their proteins, are predicted to have a common ancestor that lived 58 -60 million years ago. . . 16

C. Concordant Phylogenies Let’s test that prediction. Rabbits and the rodent differ in protein sequence to a degree requiring a minimum of 50 nucleotide substitutions. . . Where is the common ancestor in the fossil record?

C. Concordant Phylogenies Just where genetic analysis of two different EXISTING species predicts. 16

C. Concordant Phylogenies OK, but what about all of our 16 "nodes"? Evolution predicts that they should also exist on or near this line. . 16

C. Concordant Phylogenies And they are. Certainly to a degree that supports our hypothesis based on evolution. Tested and supported.

C. Concordant Phylogenies - We can compare the DNA in existing species and predict where, in the sedimentary layers of the Earth’s crust, a third DIFFERENT species should be. - No explanation other than evolution predicts and explains this ability. Evolution by Common Descent is a tested, predictive theory; like atomic theory or the heliocentric theory.

Modern Evolutionary Biology I. Population Genetics II. Genes and Development: "Evo-Devo" III. Species IV. Reconstructing Phylogenies V. Modern Evolutionary Theory

V. Modern Evolutionary Theory A. Peripatric Speciation

V. Modern Evolutionary Theory A. Peripatric Speciation B. Punctuated Equilibria – Eldridge and Gould - 1972

- 1972 - Eldridge and Gould - Punctuated Equilibrium VARIATION 1. Consider a large, well-adapted population TIME

- 1972 - Eldridge and Gould - Punctuated Equilibrium 1. Consider a large, well-adapted population VARIATION Effects of Selection and Drift are small - little change over time TIME

- 1972 - Eldridge and Gould - Punctuated Equilibrium VARIATION 2. There always small sub-populations "budding off" along the periphery of a species range. . . TIME

- 1972 - Eldridge and Gould - Punctuated Equilibrium 2. Most will go extinct, but some may survive. . . X VARIATION X X TIME

- 1972 - Eldridge and Gould - Punctuated Equilibrium 2. These surviving populations will initially be small, and in a new environment. . . so the effects of Selection and Drift should be strong. . . X VARIATION X X TIME

- 1972 - Eldridge and Gould - Punctuated Equilibrium 3. These populations will change rapidly in response. . . X VARIATION X X TIME

- 1972 - Eldridge and Gould - Punctuated Equilibrium 3. These populations will change rapidly in response. . . and as they adapt (in response to selection), their populations should increase in size (because of increasing reproductive success, by definition). X VARIATION X X TIME

- 1972 - Eldridge and Gould - Punctuated Equilibrium 3. As population increases in size, effects of drift decline. . . and as a population becomes better adapted, the effects of selection decline. . . so the rate of evolutionary change declines. . . X VARIATION X X TIME

- 1972 - Eldridge and Gould - Punctuated Equilibrium 4. And we have large, well-adapted populations that will remain static as long as the environment is stable. . . X VARIATION X X TIME

- 1972 - Eldridge and Gould - Punctuated Equilibrium 5. Since small, short-lived populations are less likely to leave a fossil, the fossil record can appear 'discontinuous' or 'imperfect' X VARIATION X X TIME

- 1972 - Eldridge and Gould - Punctuated Equilibrium 5. Large pop's may leave a fossil. . X VARIATION X X TIME

- 1972 - Eldridge and Gould - Punctuated Equilibrium 5. Small, short-lived populations probably won't. . . X VARIATION X X TIME

- 1972 - Eldridge and Gould - Punctuated Equilibrium 6. So, the discontinuity in the fossil record is an expected result of our modern understanding of how evolution and speciation occur. . . X VARIATION X X TIME

- 1972 - Eldridge and Gould - Punctuated Equilibrium 6. both in time (as we see), and in SPACE (as changing populations are probably NOT in same place as ancestral species). X VARIATION X X TIME
- Slides: 78