
Moden Portfolio Theory Dan Thaler Definition Proposes how


- Slides: 51
Moden Portfolio Theory Dan Thaler
Definition • Proposes how rational investors will use diversification to optimize their portfolios • MPT models an asset’s return as a random variable, and models a portfolio as a weighted combination of assets
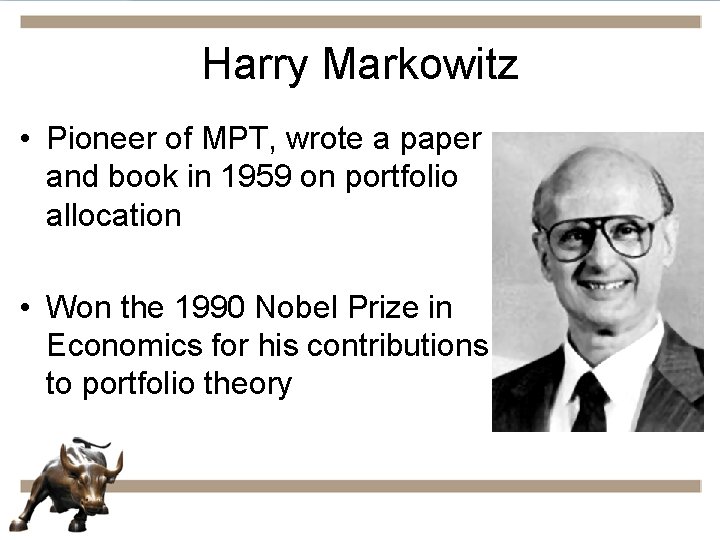
Harry Markowitz • Pioneer of MPT, wrote a paper and book in 1959 on portfolio allocation • Won the 1990 Nobel Prize in Economics for his contributions to portfolio theory
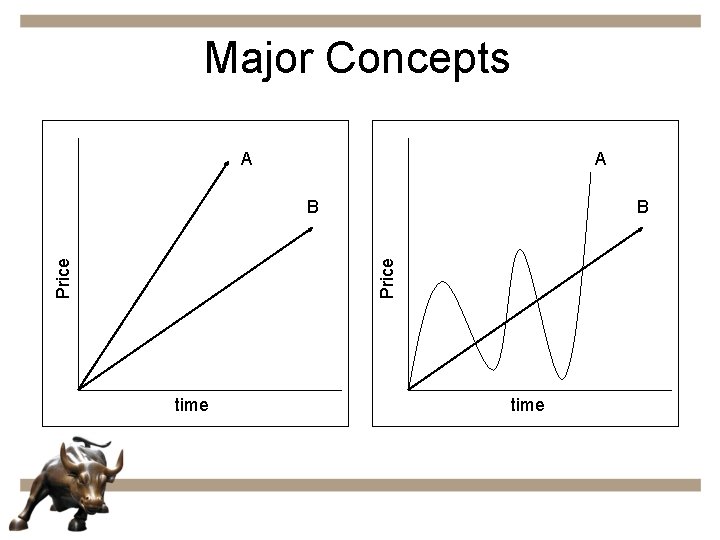
Major Concepts • Attempts to explain how investors can maximize return and minimize risk • MPT uses the concept of diversification with the aim of selecting a group of investments that will collectively have a lower risk than any single investment.
Major Concepts A A B Price B time
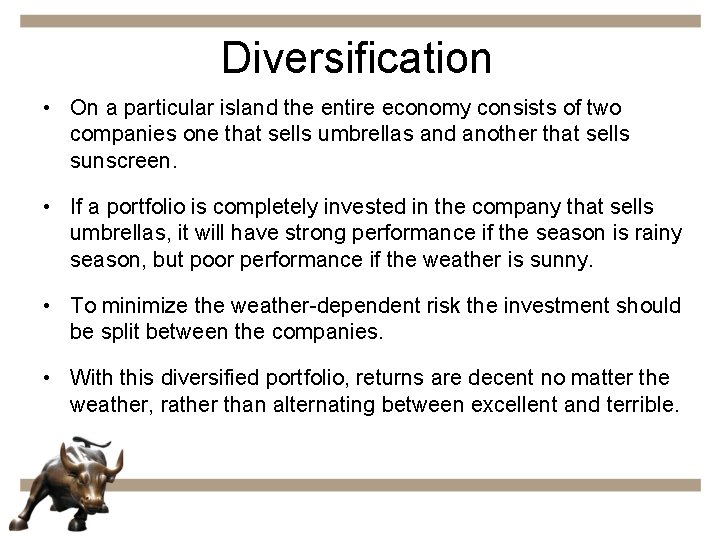
Diversification • On a particular island the entire economy consists of two companies one that sells umbrellas and another that sells sunscreen. • If a portfolio is completely invested in the company that sells umbrellas, it will have strong performance if the season is rainy season, but poor performance if the weather is sunny. • To minimize the weather-dependent risk the investment should be split between the companies. • With this diversified portfolio, returns are decent no matter the weather, rather than alternating between excellent and terrible.
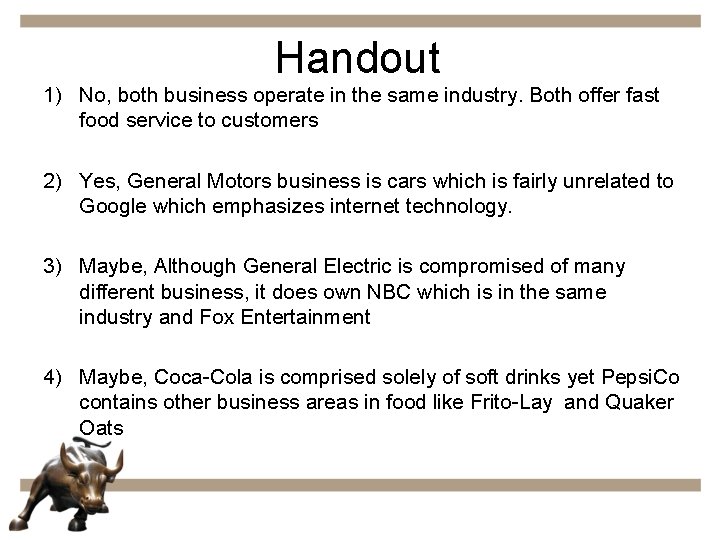
Handout 1) No, both business operate in the same industry. Both offer fast food service to customers 2) Yes, General Motors business is cars which is fairly unrelated to Google which emphasizes internet technology. 3) Maybe, Although General Electric is compromised of many different business, it does own NBC which is in the same industry and Fox Entertainment 4) Maybe, Coca-Cola is comprised solely of soft drinks yet Pepsi. Co contains other business areas in food like Frito-Lay and Quaker Oats
Diversification
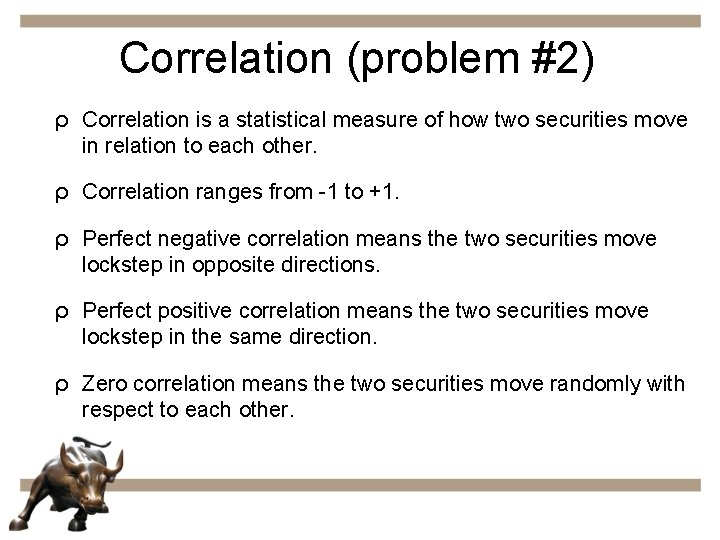
Correlation (problem #2) ρ Correlation is a statistical measure of how two securities move in relation to each other. ρ Correlation ranges from -1 to +1. ρ Perfect negative correlation means the two securities move lockstep in opposite directions. ρ Perfect positive correlation means the two securities move lockstep in the same direction. ρ Zero correlation means the two securities move randomly with respect to each other.
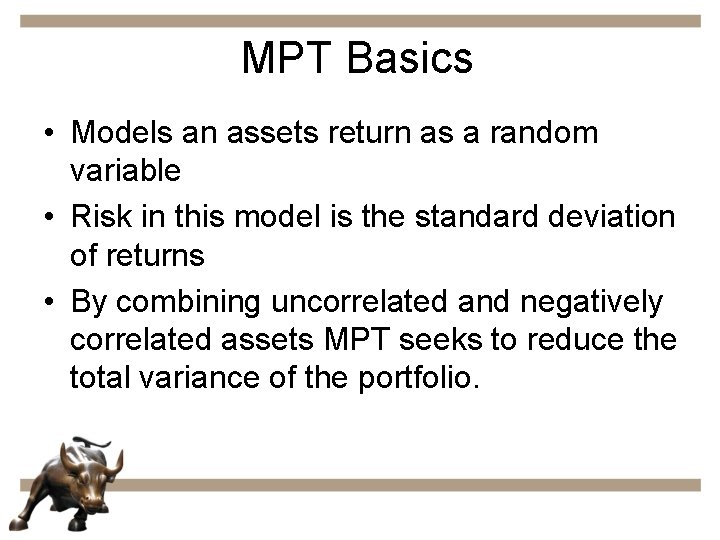
MPT Basics • Models an assets return as a random variable • Risk in this model is the standard deviation of returns • By combining uncorrelated and negatively correlated assets MPT seeks to reduce the total variance of the portfolio.
, MPT Mathematically • Expected return: • Portfolio variance: • Portfolio volatility:
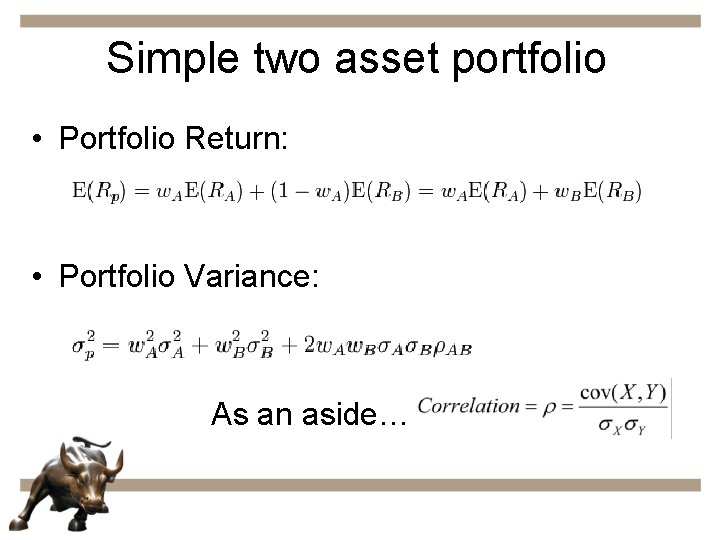
Simple two asset portfolio • Portfolio Return: • Portfolio Variance: As an aside…
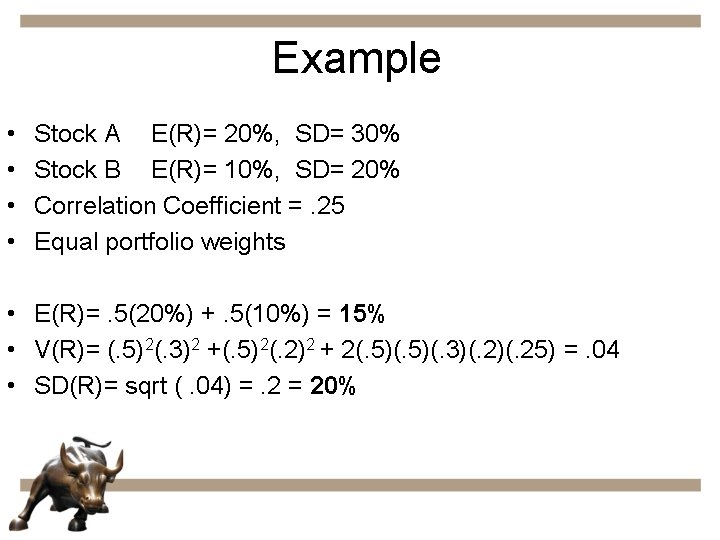
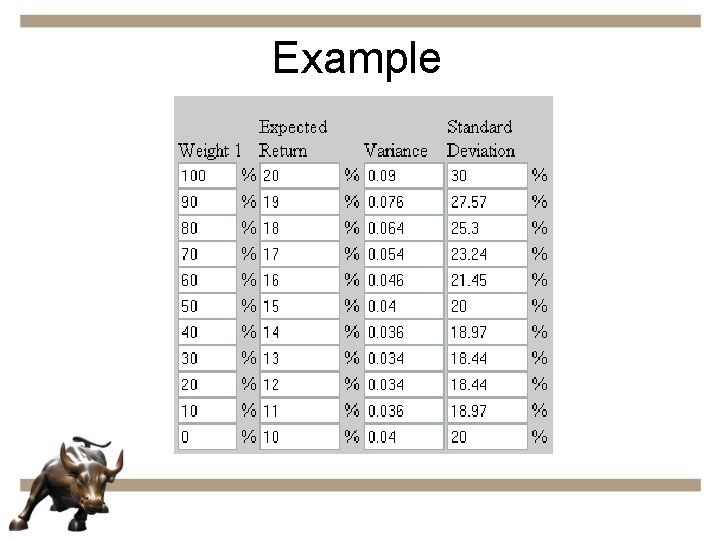
Example • • Stock A E(R)= 20%, SD= 30% Stock B E(R)= 10%, SD= 20% Correlation Coefficient =. 25 Equal portfolio weights • E(R)=. 5(20%) +. 5(10%) = 15% • V(R)= (. 5)2(. 3)2 +(. 5)2(. 2)2 + 2(. 5)(. 3)(. 25) =. 04 • SD(R)= sqrt (. 04) =. 2 = 20%
Example
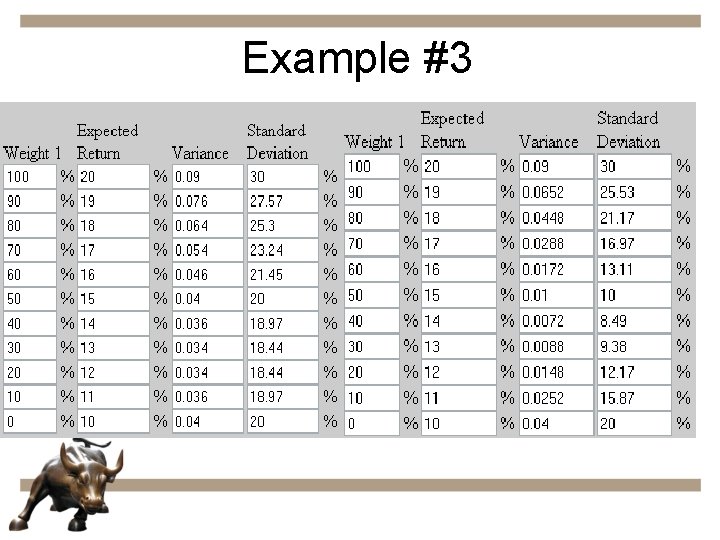
Example #3 • Try problem #3 on the handout • the same example except use -. 75 for the correlation coefficient
Efficient Frontier • Every possible asset combination can be plotted in risk-return space • The collection of all such possible points is used to determine the efficient frontier • The efficient frontier is the upper edge of these points • Combinations along this line represent portfolios for which there is lowest risk for a given level of return
Excel
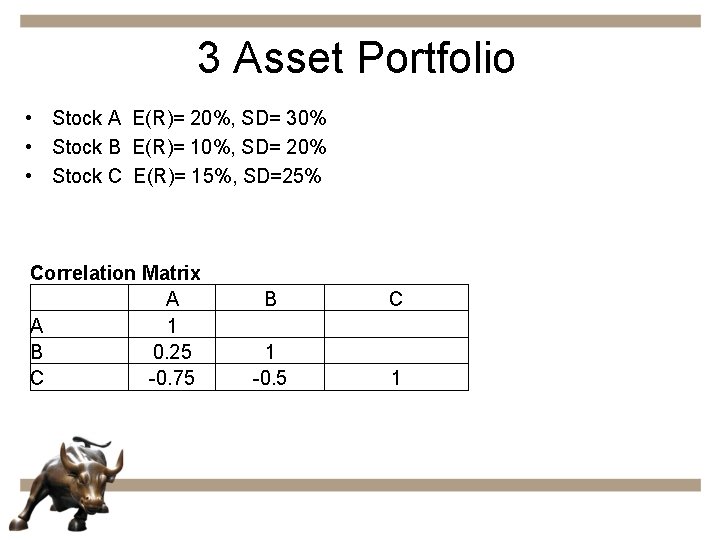
3 Asset Portfolio • Stock A E(R)= 20%, SD= 30% • Stock B E(R)= 10%, SD= 20% • Stock C E(R)= 15%, SD=25% Correlation Matrix A A 1 B 0. 25 C -0. 75 B 1 -0. 5 C 1
Excel
Best Portfolio • We will use Optimization • Refers to choosing the best element from a set of available alternatives • In our case we are tying to minimize or maximize a real function by choosing real variables from within an allowed set determined by constraints
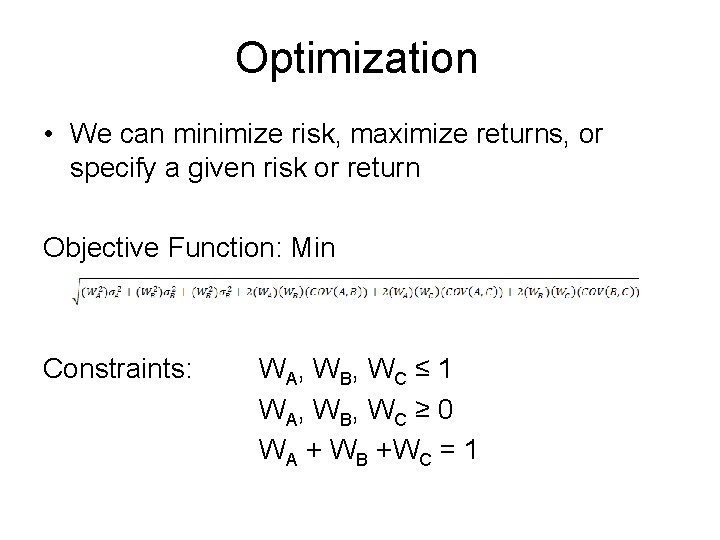
Optimization • We can minimize risk, maximize returns, or specify a given risk or return Objective Function: Min Constraints: WA, WB, WC ≤ 1 WA, WB, WC ≥ 0 WA + WB +WC = 1
Excel
Best Portfolio • Need to find a metric to determine which portfolio on the efficient frontier is the best • Most popular metric is the Sharpe Ratio • It is often used to rank the performance of portfolio and mutual fund managers
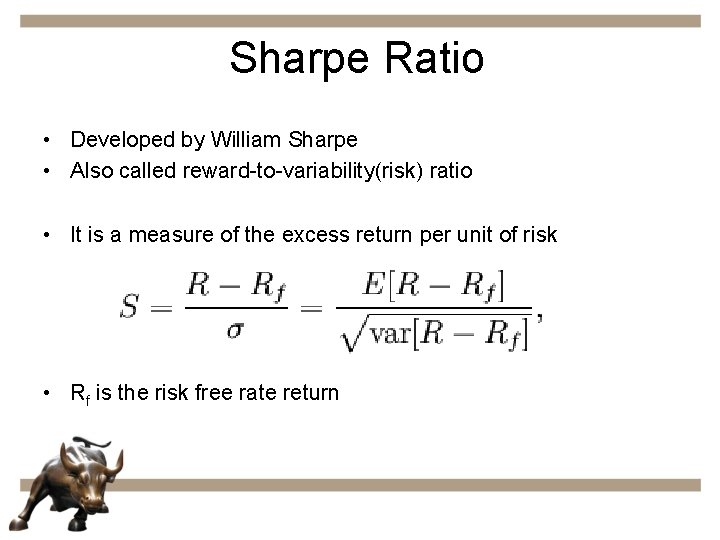
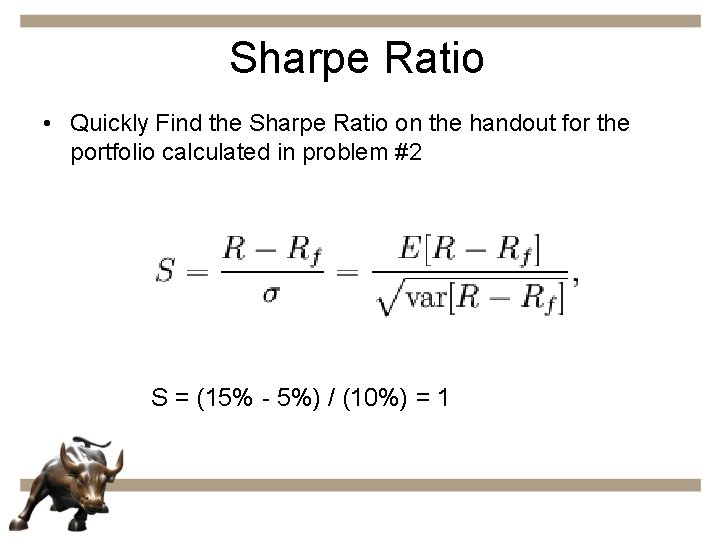
Sharpe Ratio • Developed by William Sharpe • Also called reward-to-variability(risk) ratio • It is a measure of the excess return per unit of risk • Rf is the risk free rate return
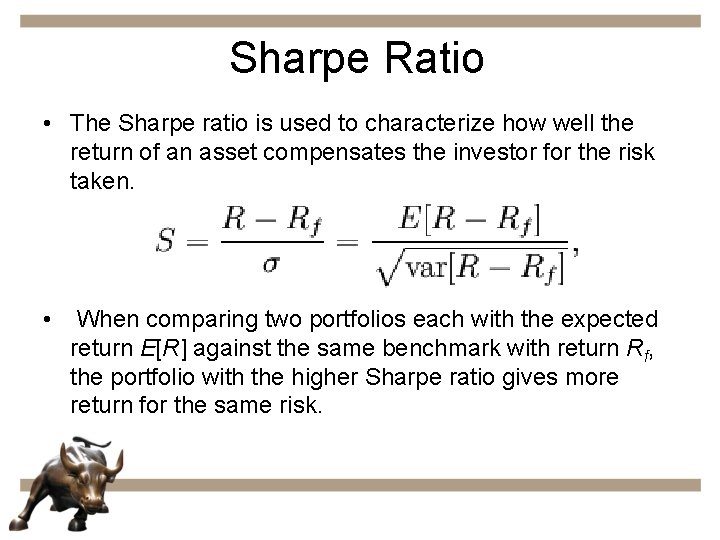
Sharpe Ratio • The Sharpe ratio is used to characterize how well the return of an asset compensates the investor for the risk taken. • When comparing two portfolios each with the expected return E[R] against the same benchmark with return Rf, the portfolio with the higher Sharpe ratio gives more return for the same risk.
Sharpe Ratio • Quickly Find the Sharpe Ratio on the handout for the portfolio calculated in problem #2 S = (15% - 5%) / (10%) = 1
Excel
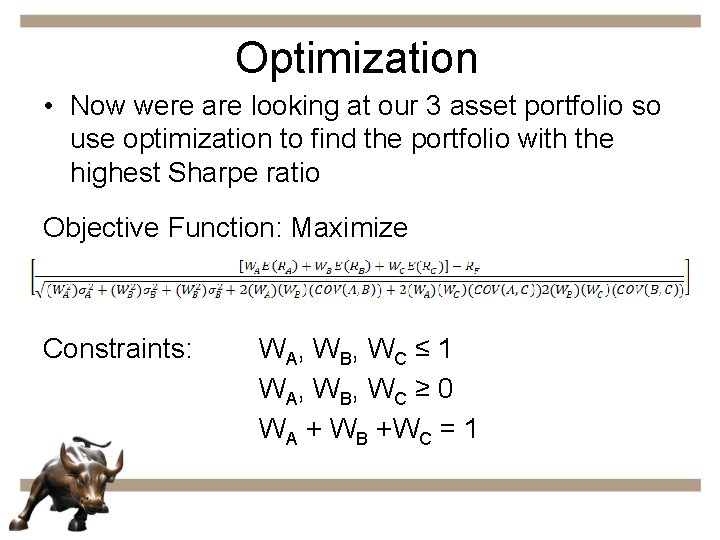
Optimization • Now were are looking at our 3 asset portfolio so use optimization to find the portfolio with the highest Sharpe ratio Objective Function: Maximize Constraints: WA, WB, WC ≤ 1 WA, WB, WC ≥ 0 WA + WB +WC = 1
Excel
How do you find the inputs? • How do you calculate: – Expected return? – Standard Deviation? – Correlation?
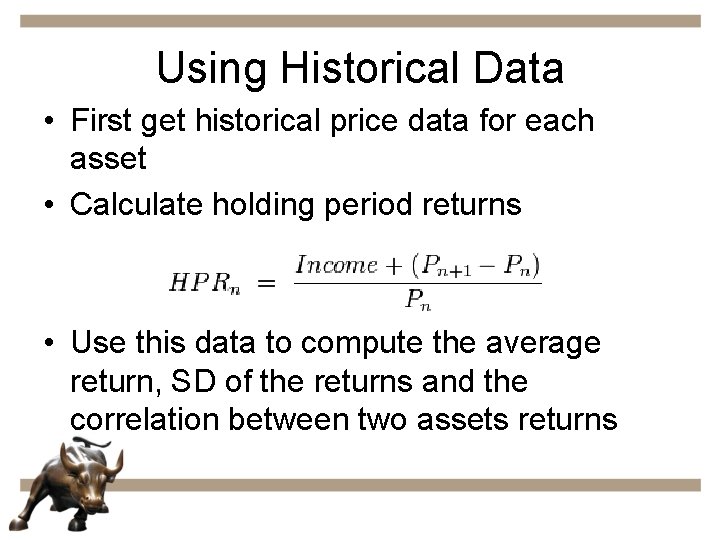
Using Historical Data • First get historical price data for each asset • Calculate holding period returns • Use this data to compute the average return, SD of the returns and the correlation between two assets returns
Excel
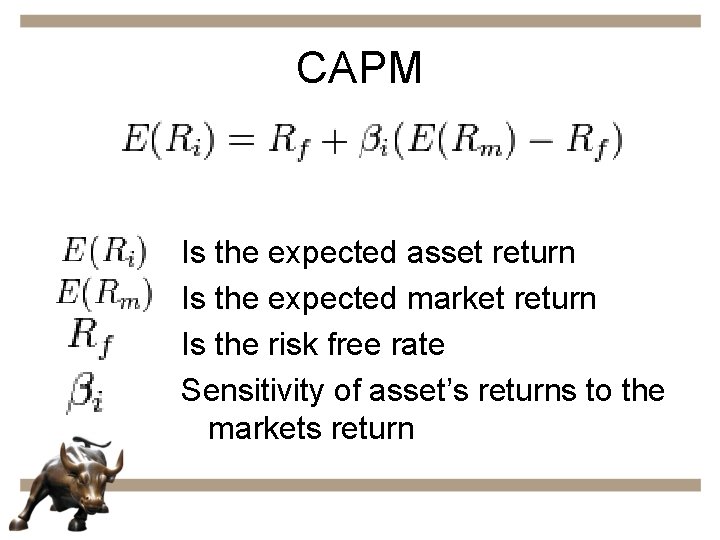
How to Calculate E(R) • The Capital Asset Pricing Model (CAPM) model is used to determine a theoretically appropriate required rate of return of an asset • This model was partially introduced by Sharpe who won a Noble Prize in Economics for his contribution
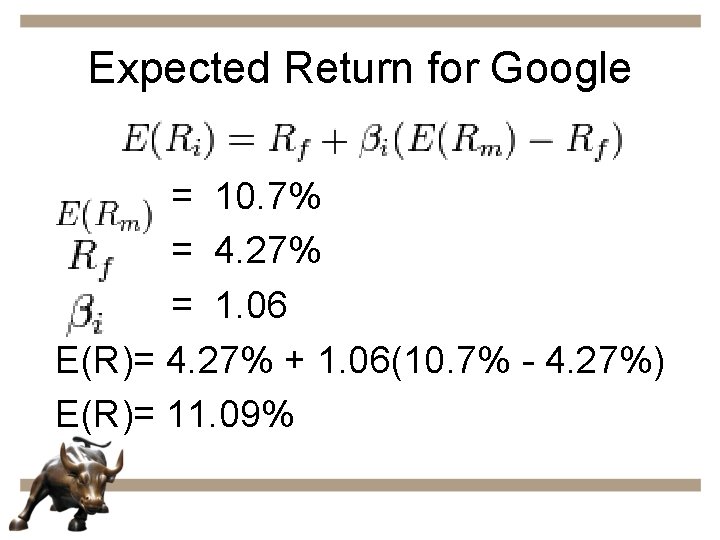
CAPM Is the expected asset return Is the expected market return Is the risk free rate Sensitivity of asset’s returns to the markets return
Market Return • Used a historical figure based on a large index – Dow Jones – S&P • Over last 20 years S&P grew by 10. 7% annually
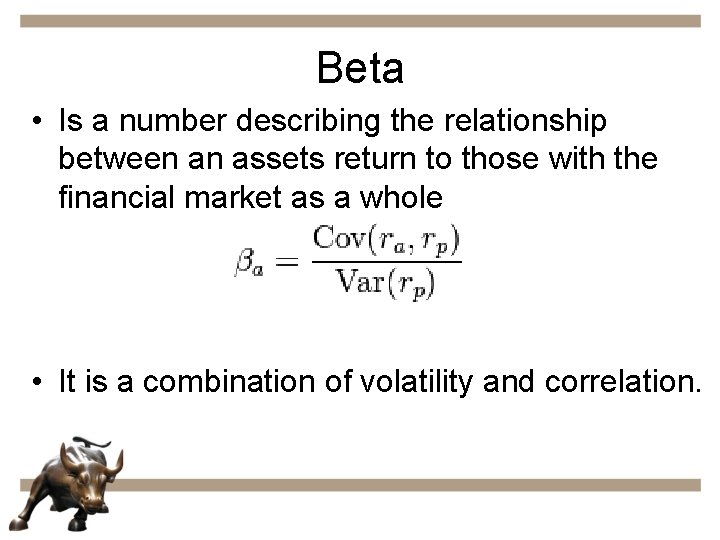
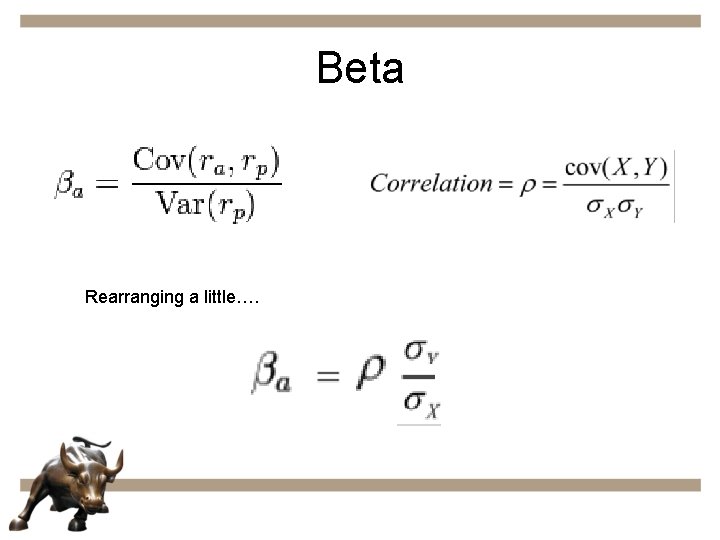
Beta • Is a number describing the relationship between an assets return to those with the financial market as a whole • It is a combination of volatility and correlation.
Beta • A way to distinguish between beta and correlation is to think about direction and magnitude. • If the market is always up 10% and a stock is always up 20%, the correlation is 1 • Beta takes into account both direction and magnitude, so the beta would be 2
Beta Rearranging a little….
Beta • We can use historical market returns of both an asset and the benchmark (S&P 500) to find beta with a linear regression • The slope of the fitted line is the assets Beta
Excel
Expected Return for Google = 10. 7% = 4. 27% = 1. 06 E(R)= 4. 27% + 1. 06(10. 7% - 4. 27%) E(R)= 11. 09%
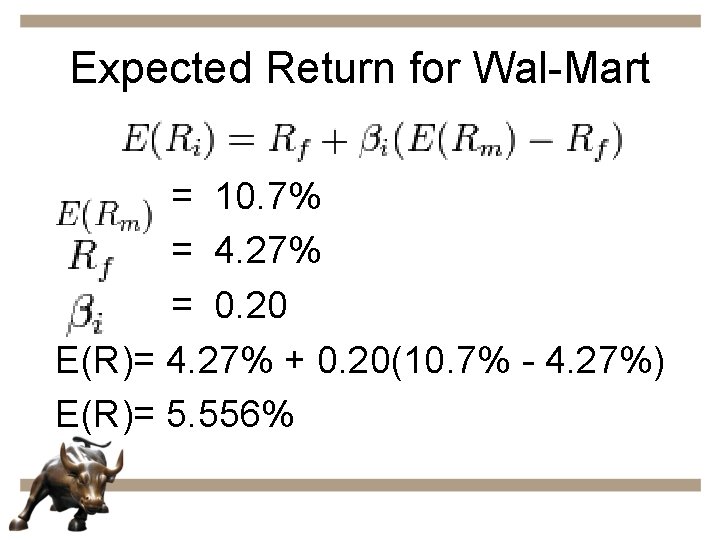
Expected Return for Wal-Mart = 10. 7% = 4. 27% = 0. 20 E(R)= 4. 27% + 0. 20(10. 7% - 4. 27%) E(R)= 5. 556%
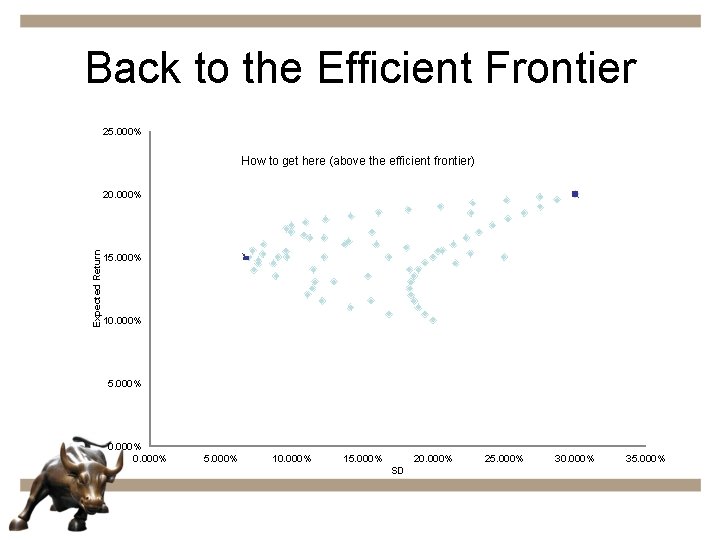
Back to the Efficient Frontier 25. 000% How to get here (above the efficient frontier) Expected Return 20. 000% 15. 000% 10. 000% 5. 000% 10. 000% 15. 000% 20. 000% SD 25. 000% 30. 000% 35. 000%
Short Selling • We can go beyond the efficient frontier by borrowing at the risk free rate and investing the proceeds in another asset OR……… • We can short sell one of our assets and invest in another asset
Short Selling • • • Example Stock A E(R)= 20%, SD= 30% Stock B E(R)= 10%, SD= 20% Correlation Coefficient =. 25 Portfolio is currently equally weighted • What is the E(Rp) and SD if we short 50% of B and put it in Stock A?
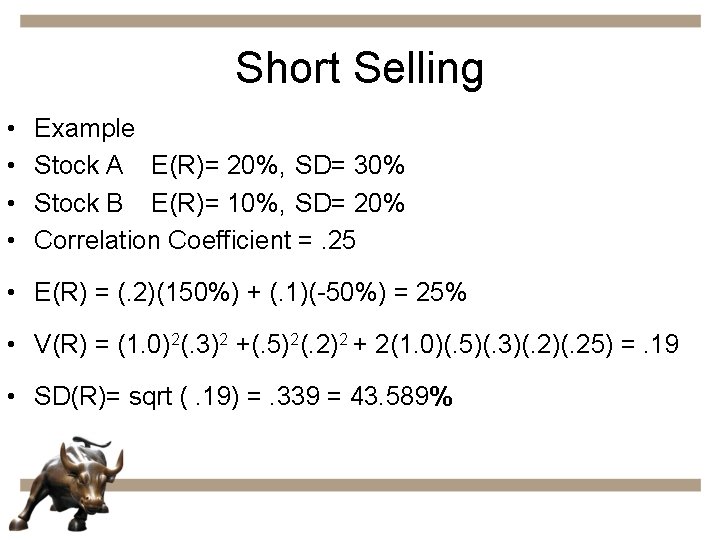
Short Selling • • Example Stock A E(R)= 20%, SD= 30% Stock B E(R)= 10%, SD= 20% Correlation Coefficient =. 25 • E(R) = (. 2)(150%) + (. 1)(-50%) = 25% • V(R) = (1. 0)2(. 3)2 +(. 5)2(. 2)2 + 2(1. 0)(. 5)(. 3)(. 25) =. 19 • SD(R)= sqrt (. 19) =. 339 = 43. 589%
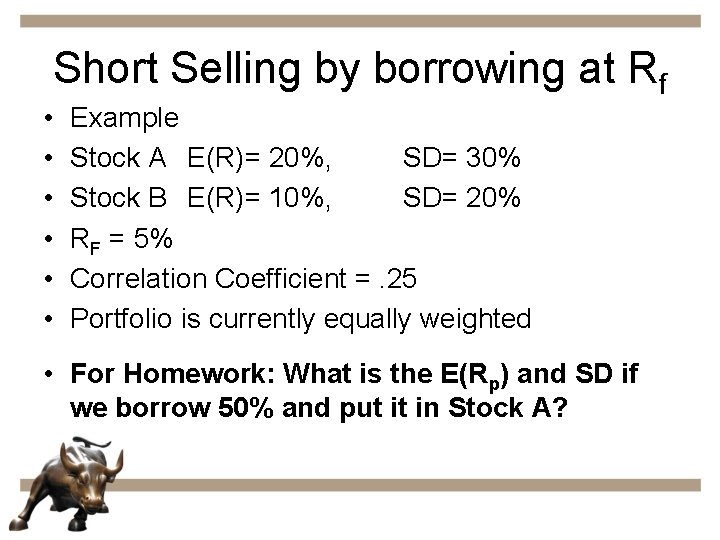
Short Selling by borrowing at Rf • • • Example Stock A E(R)= 20%, SD= 30% Stock B E(R)= 10%, SD= 20% RF = 5% Correlation Coefficient =. 25 Portfolio is currently equally weighted • For Homework: What is the E(Rp) and SD if we borrow 50% and put it in Stock A?
Excel
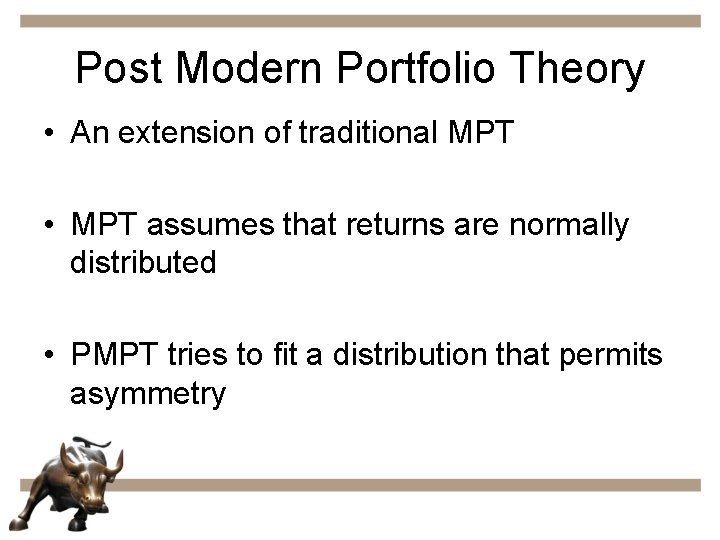
Post Modern Portfolio Theory • An extension of traditional MPT • MPT assumes that returns are normally distributed • PMPT tries to fit a distribution that permits asymmetry
Main Sources • http: //viking. som. yale. edu/will/finman 540/cl assnotes/notes. html • http: //www. stanford. edu/~wfsharpe/mia/rr/ mia_rr 0. htm