Models of the Earth Roundness of Earth Evidence


 and")


 or change (dynamic) – Static:")


- Slides: 40
Models of the Earth
Roundness of Earth • Evidence: – Photographs from space – Objects over horizon – Earth shadow on Moon @ eclipse – Altitude of Polaris – Shadow angles at different parts of the world • The name for the shape of Earth is oblate spheroid – Results in differential gravity; greater distance at equator = less gravity
Eratosthenes Method • Watch how shadow length varies with the angle from the sun!
Lab: Earth’s Circumference • Calculate the size of Earth using your own data! Amazing! S C = L 360
Test of the day: 9/23 1. Given 360° longitude (180 E, 180 W) and Earth rotates 1 x/day (24 hours), how fast is Earth spinning? • • • What is this speed in Rochester? L=cos(Lat)*Eq. Long Our lat = 43. 13°, Eq. Long = 69. 172 mi Speed = 15 * L (because of your rotational speed calculated above) =683 mph!!
What do you think? 9/25 • At what altitude would Polaris be if you were at 30° N? • What does gradient mean? – (don’t just give the formula, you geek) • How many labs do you owe? Turn them in.
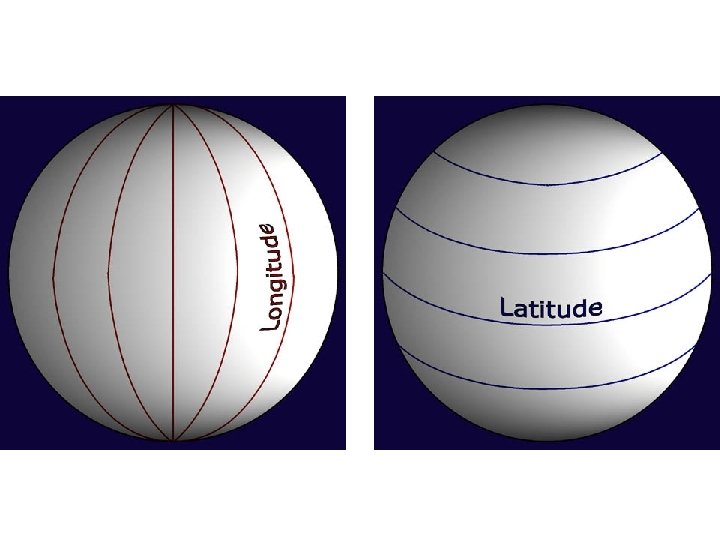
Latitude and Longitude • Used for measuring Earth • Useful in providing accurate locations on a sphere • What is the basis of latitude? • What is the basis of longitude? • Who came up with this, anyway? – 1884, Washington DC conference
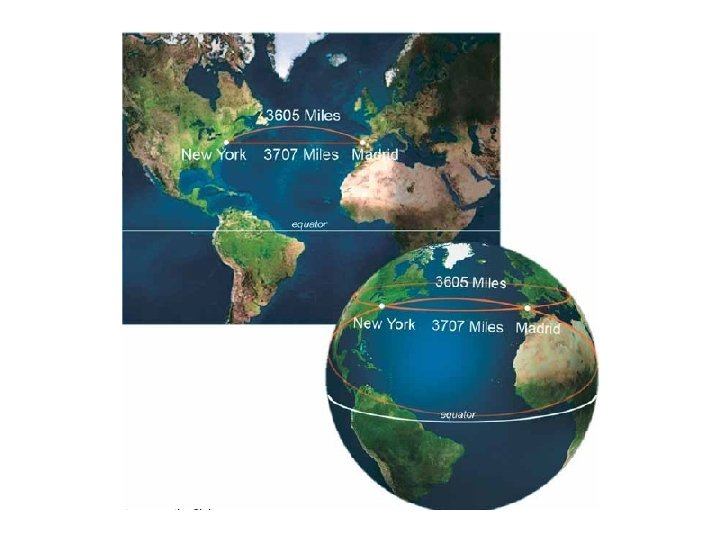
What is the fastest way to get from NYC to Madrid?
What is a Field Map? • Map indicating measurement of some value • What kind of value? – Temperature – Elevation – Election results – Strength of manure odor
Fields, Isolines, and Gradients, Oh MY!! • A field is just an area of space. – A soccer field – A topographic quadrangle – A continent • Isolines connect points of equal value within the field – Contour lines are special kinds of isolines, connecting points of equal elevation • Gradient is just how steep an area is, and can be estimated by observing how close together isolines are. Formula for gradient is change in field value divided by distance.
Fields • Field values can either remain constant (static) or change (dynamic) – Static: elevation – Dynamic: grades • Field values can either be just a number (scalar) or show a direction (vector) – Scalar: temperature – Vector: migratory patterns of European swallows • But, is it unladen?
Isoline RULES!!!! • Isolines may NEVER cross • Isolines connect points of equal value • Isolines either entirely close upon themselves…. OR go off the map
Find a high or low in the center 250 280 290 370 350 310 390 310 460 290 410 540 370 560 430 490 405 320 410 540 530 490 385 425 475 285 480
Insert points where needed 250 280 290 370 350 310 390 310 460 290 410 540 370 560 430 490 405 320 410 540 530 490 385 425 475 285 480
Connect your points 250 280 290 370 350 310 390 310 460 290 410 540 370 560 430 490 405 320 410 540 530 490 385 425 475 285 480
Reminders 10/1 1. How do you record measurements of latitude and longitude? 2. How does a topographic map distinguish areas of steep gradient from gentle gradient? 3. What is the latitude of NY?
Topographic Maps • What do they have on them? – Scale – Elevations – Roads – Buildings – Railroads – Name – Date – Nearby maps
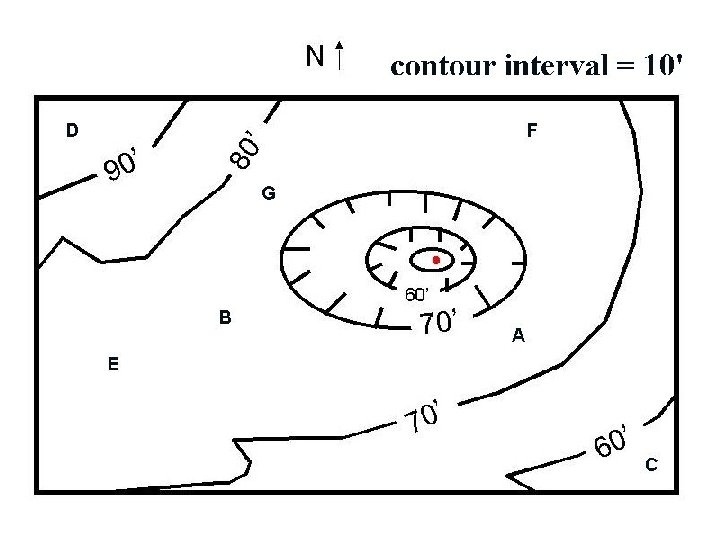
Hachure Lines • Show enclosed topographic depressions, such as – Sinkholes – Volcanic craters – Meteor craters • Are illustrated with a contour line with small marks on the inside of it. • The elevation is the same as the previous contour line.
How to Make a Profile 1. 2. 3. 4. 5. Align scrap paper along profile line Mark starting and ending points Mark contour lines on scrap Move scrap over to profile sheet Follow marks up to elevation indicated, mark on profile sheet 6. Connect the dots, La-la-la
0 B 48 46 0 500 A 500 CI = 20 ft
Transfer points straight up to their elevations Connect the dots, la-la-la! 580 ess ion 560 lose 520 Enc 500 Riv er dd epr 540 480 460 480 Voila! 460 500 440
10/3 1. Calculate the elevation gradient between my house and this school, given that my house is 436 ft and the elevation of the school is 486 ft. The distance between them is 5. 6 miles. -units? 2. How many different 20 -foot contour lines do I cross when I ride my bicycle to school? LTI in your network drive? ? ?
How to Read Quadrangles • • • What is a quadrangle? What information is around the map? How is the map oriented? What scale am I looking at? How to use rectangles 1 -9
Topographic Map Symbols • Check out this radical sheet!
Things I noticed… • • Parallel = latitude Meridian = longitude Quadrangle locator map 3 different Norths – Geographic – Polaris – Magnetic • Declination is the angle (also shown in Mils!) • Lat/Long vs UTM coordinates • Contour lines form a V, pointing upstream • Ratio scale (1: 24000) is unitless
Comments from Lab • What is the highest possible elevation?
Comments from Lab • What is the latitude/longitude of Rochester?
Comments from Labs • As the difference in field value increases between two spot locations, the isolines move closer together • Labels for gradients • Hachure marks show enclosed depressions • Depression contours are the same elevation as the previous contour
Other Map Comments… • What is a scale? How many different kinds do we use? • Streams create V-shaped contours, POINTING UPSTREAM • What is declination? Mils? !? – From military-net. com, “there are 6400 mils in a circle” • Profiles from volcano lab are sloppy! Make them … curvaceous, ooh-la-la!
10/7 1. Sketch a stream flowing southwest, crossing at least three contour lines 2. What does “contour interval” mean?
Lab List and “Lessons Learned” • Lab 5: Earth’s Circumference – Size of Earth is approx 40 k km – Using Eratosthenes method – Ratio of angle and 360 = ratio of distance and circumf. • Lab 6: Latitude and Longitude – How to use coordinate systems – Altitude of Polaris = your latitude – Prime Meridian, equator, N/S poles, int’l date line
• Lab 7: Constructing a Field Map – What isolines are, isotherms, contour lines – Isoline rules (extend to edge, circle back, don’t cross) – Calculating gradient – Visually identifying steep/gentle gradient • Lab 8: Constructing a Contour Map – Contour lines connect points of equal elevation – Hachured lines for depressions – Constructing profiles – V-shape when crossing streams, points upstream
• Lab 9: Topographic Maps – Quadrangle map reading skills, lat/long – Declination – Rectangles – Spot elevations (benchmarks) – Contour intervals, man-made structures – Scales (ratio, bar) – Nearby locations
• Earth’s size • Earth’s shape • Earth’s spheres Topics and Tasks – Atmosphere – Hydrosphere – Lithosphere • Using ESRT! • Eratosthene’s method – FORMULA! • Latitude/Longitude – Using Polaris – Labels! • Field maps • • Drawing Isolines Topographic maps Drawing Profiles Gradient – Formula – Spacing of contours – Units! • Streamflow • Relationships: As 1 variable increases, what happens to the other variable? • How to tell Lat/Long without a direction- which way is increasing?
And more… • Contour Interval is the elevation change between contours • Labels for degrees, minutes, seconds – Include N/S for Latitude, E/W for Longitude. (the US is North and West!) • • Units! Using the ESRT Making profiles Eratosthenes Method • Sketch a profile v. Create/Draw a profile
A B 500 CI = 20 ft
580 560 540 520 500 480 460 440