
Models and Components of Great Nonprofit Dashboards A
Models and Components of Great Nonprofit Dashboards A Tutorial with Hilda Polanco, FMA Sponsored by: Tweet us! #Hilda. On. Finance
Operational Excellence Operational excellence is an organizational culture that values learning, problem solving and a strong commitment to continuous improvement Key component: Performance Measurement 2
Benefits of Performance Measurement By actively engaging in performance measurement, an organization: • Aligns definitions of success across the organization • Encourages dialogue about progress toward goals • Facilitates timely identification of successes and challenges • Grounds decisions in concrete data and evidence • Illuminates relationships between different activities 3
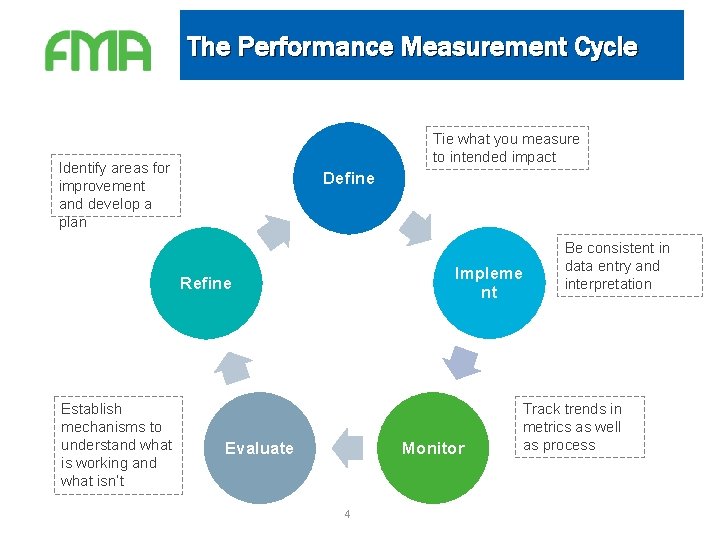
The Performance Measurement Cycle Tie what you measure to intended impact Identify areas for improvement and develop a plan Define Impleme nt Refine Establish mechanisms to understand what is working and what isn’t Monitor Evaluate 4 Be consistent in data entry and interpretation Track trends in metrics as well as process
Effective Dashboards that effectively communicate strategic-level results: • Should be presented in a user-friendly visual format: • Create a “snapshot” of current status as well as trends over time • Clearly show performance against defined targets • Highlight out-of-the-ordinary results • Include a manageable set of Key Performance Indicators (KPIs) The goal is to support planning and decision-making 5
What Should We Measure? Key Performance Indicators (KPIs) • Successful KPIs will: – Represent business model drivers – Reflect progress toward intended outcomes – Guide priorities and decisions (“what gets measured gets done”) • The “Key” in KPIs is important: limit total KPIs to a number that can realistically be monitored • A set of KPIs isn’t forever: metrics should be periodically reassessed 6
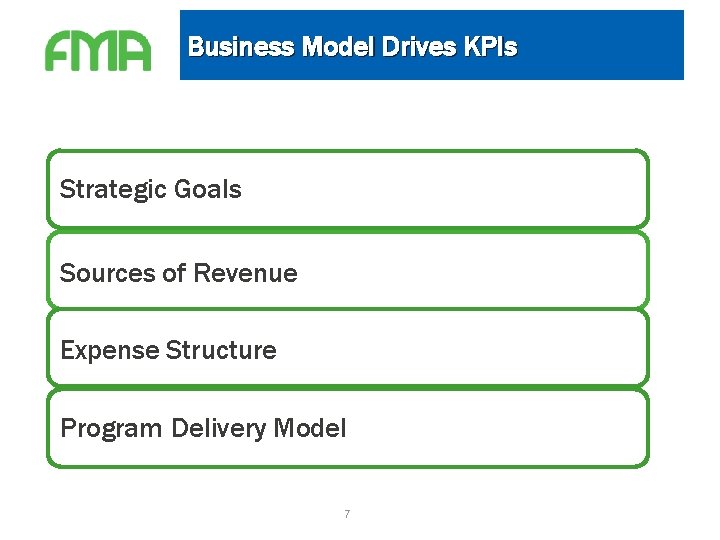
Business Model Drives KPIs Strategic Goals Sources of Revenue Expense Structure Program Delivery Model 7
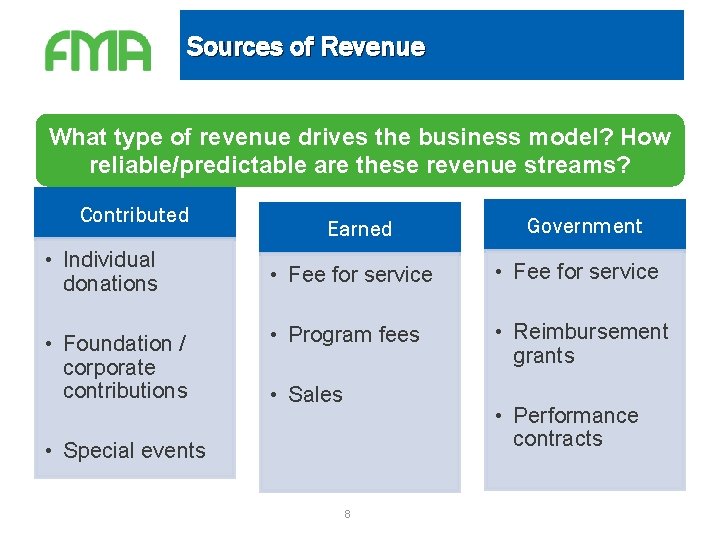
Sources of Revenue What type of revenue drives the business model? How reliable/predictable are these revenue streams? Contributed • Individual donations • Foundation / corporate contributions Earned Government • Fee for service • Program fees • Reimbursement grants • Sales • Performance contracts • Special events 8
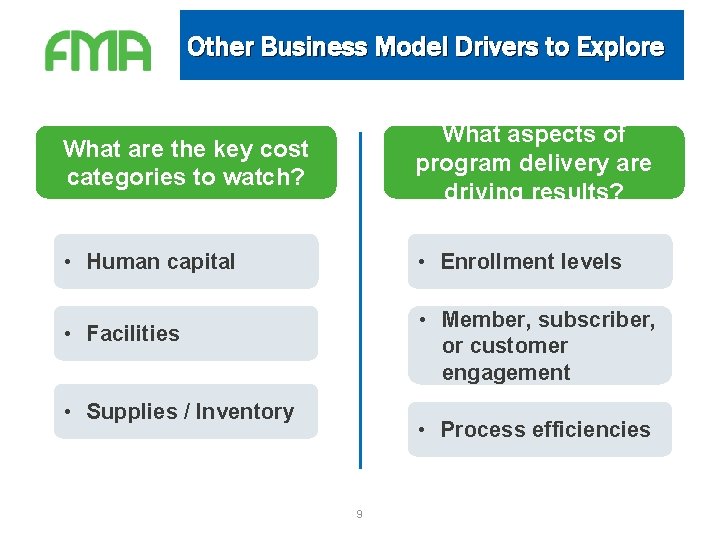
Other Business Model Drivers to Explore What are the key cost categories to watch? What aspects of program delivery are driving results? • Human capital • Enrollment levels • Member, subscriber, or customer engagement • Facilities • Supplies / Inventory • Process efficiencies 9
DASHBOARD EXAMPLES 10
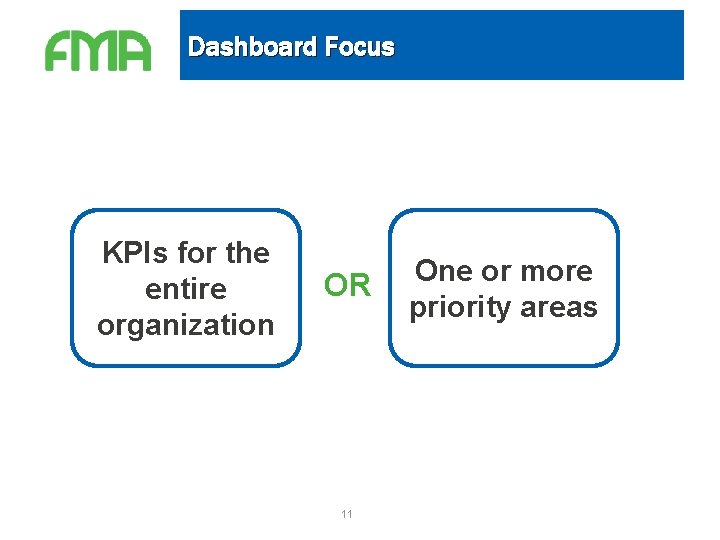
Dashboard Focus KPIs for the entire organization OR 11 One or more priority areas
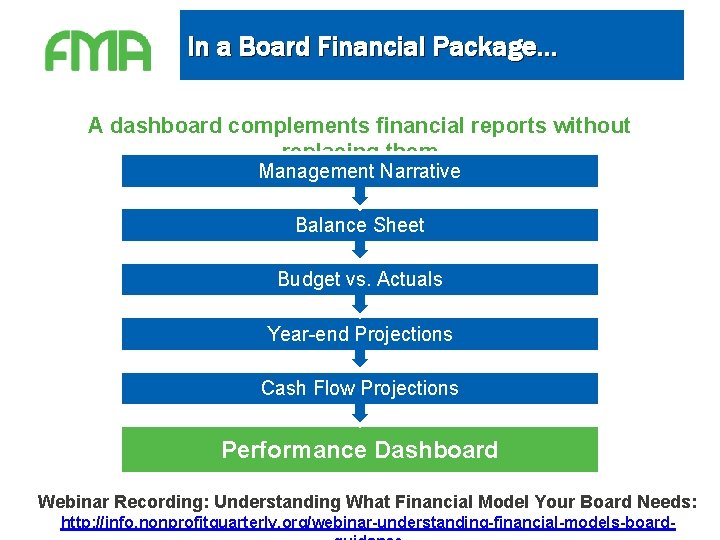
In a Board Financial Package… A dashboard complements financial reports without replacing them Management Narrative Balance Sheet Budget vs. Actuals Year-end Projections Cash Flow Projections Performance Dashboard Webinar Recording: Understanding What Financial Model Your Board Needs: 12 http: //info. nonprofitquarterly. org/webinar-understanding-financial-models-board-
Dashboard: Early Education Program This multi-service organization provides a range of youth-based programs for the community it serves, including an early childhood education program. Revenue for this program is a mix of government contracts and tuition/program fees. Key Driver: Enrollment Levels Key Performance Indicators 1. Monitor the program’s Operating Surplus (Deficit) 2. Track Program Enrollment and attendance 3. Track revenue from Program Fees 13
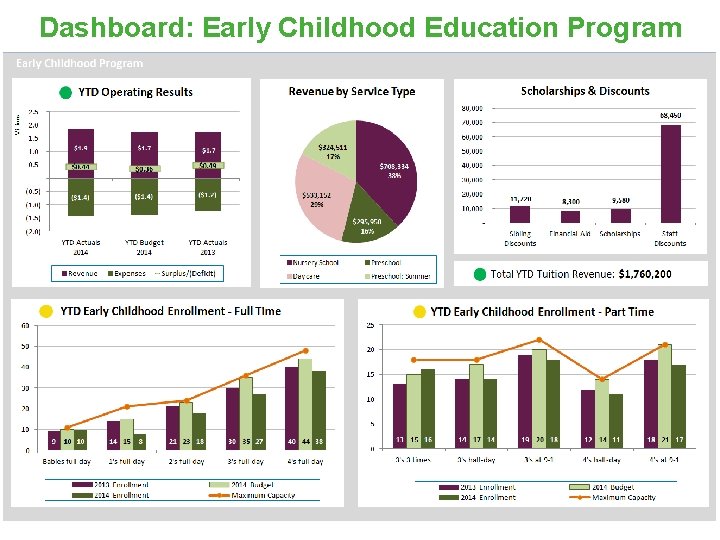
Dashboard: Early Childhood Education Program
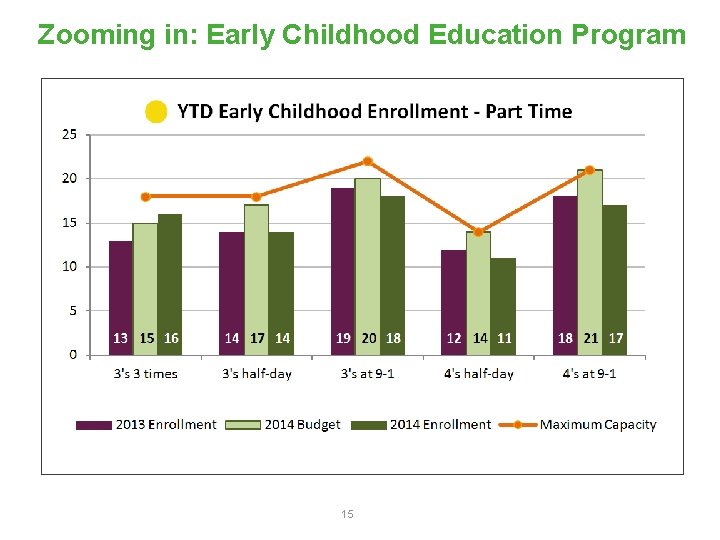
Zooming in: Early Childhood Education Program 15
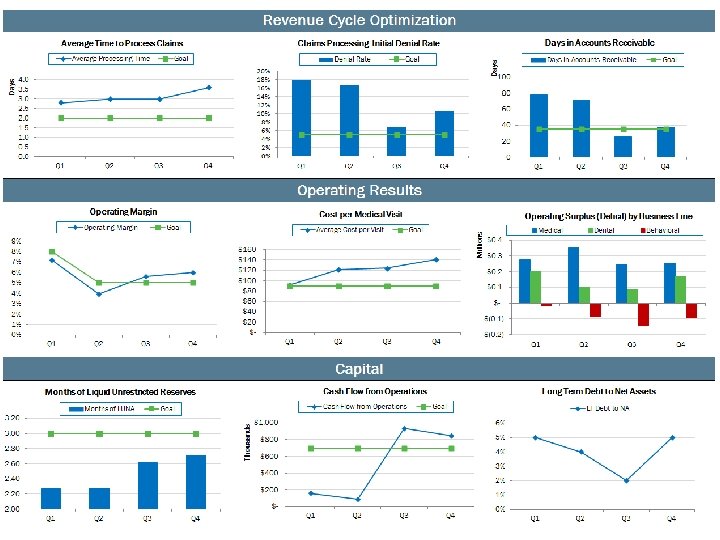
Dashboard: Community Health Clinic Designated as an FQHC, this Community Health Clinic offers medical, dental, and behavioral health services to the rural population it serves. Revenue sources are a mix of patient fees, Medicare/Medicaid, and payments from private insurers. Key Driver: Operational Efficiency Key Performance Indicators 1. Monitor the Operating Surplus (Deficit) by business line 2. Track Access to Capital, including reserves, cash flow, and debt levels 3. Analyze the efficiency of the Revenue Cycle 4. Track the Cost per Patient Visit 16
17
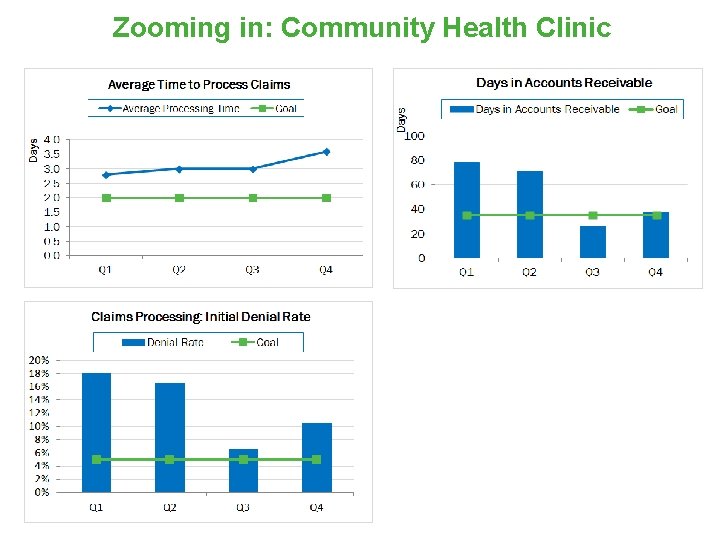
Zooming in: Community Health Clinic 18
Dashboard: Homeownership Nonprofit This Community Development Organization increases homeownership rates by making low-interest loans, providing credit counseling, educating first-time homebuyers, and rehabbing dilapidated properties. Revenue is a mix of earned income and government contracts. Key Challenge: Achieving revenue self-sufficiency for each business line Key Performance Indicators 1. Track Cost per Customer for each business line 2. Track the Profitability (i. e. surplus/deficit) of each business line 3. Monitor Earned Revenue by business line 19
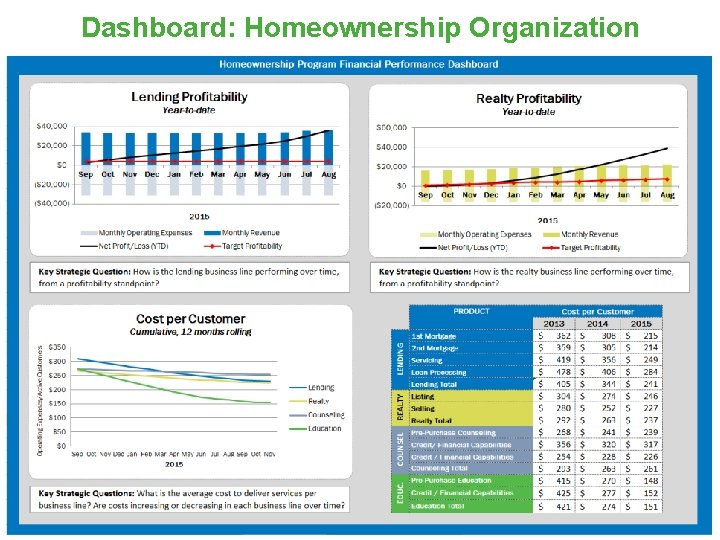
Dashboard: Homeownership Organization 20
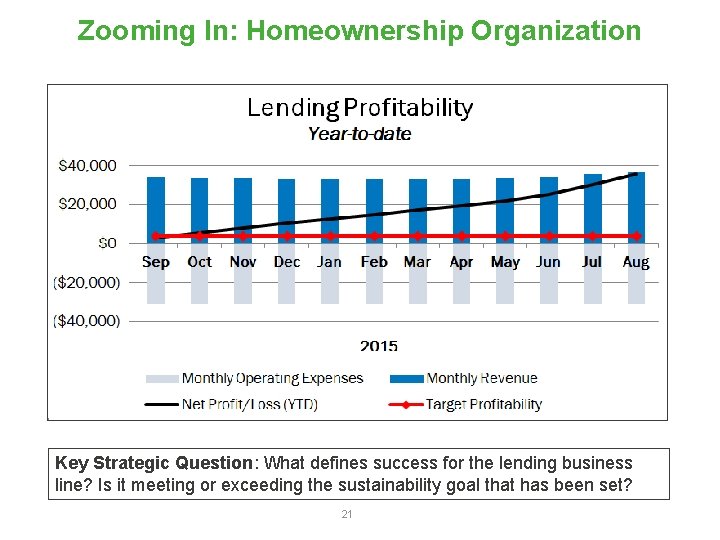
Zooming In: Homeownership Organization Key Strategic Question: What defines success for the lending business line? Is it meeting or exceeding the sustainability goal that has been set? 21
Dashboard: Performing Arts Nonprofit With a mission of making dance more accessible to the public, this organization has both a dance company and a school. Their goal is to increase revenue so they can afford to hold more free performances for the community. Key Challenges: Optimizing pricing and maximizing attendance Key Performance Indicators 1. Analyze Median Revenue per Performance 2. Monitor Enrollment in the summer workshop series 3. Track the Retention Rate at the academy 4. Monitor the Percentage of Performance Weeks where they are able to offer a free public show 22
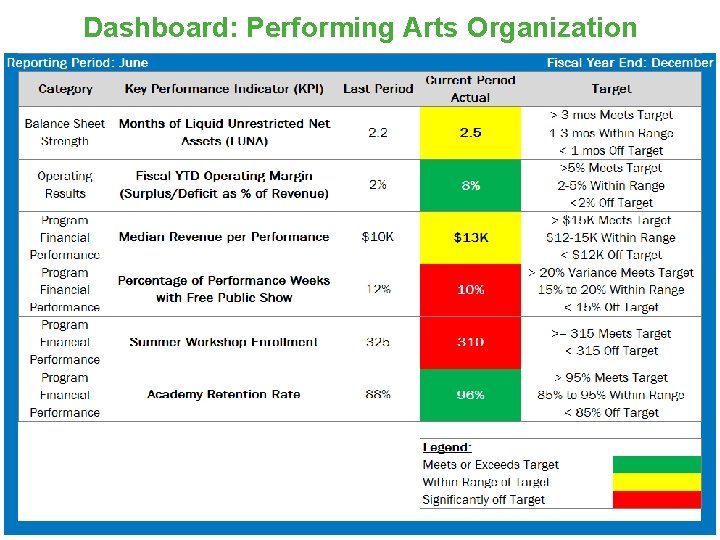
Dashboard: Performing Arts Organization
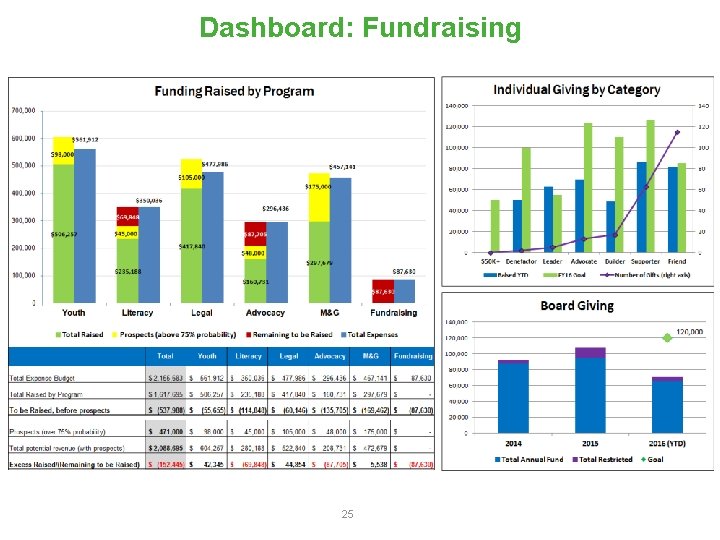
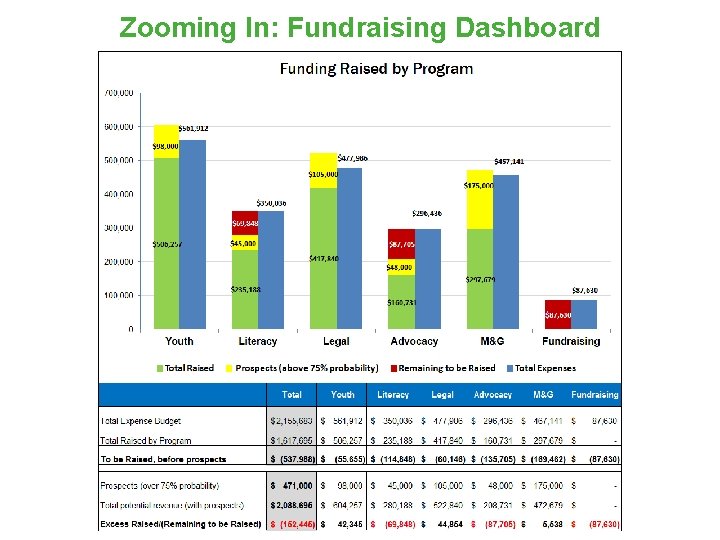
Dashboard: Fundraising This community-based organization works in the areas of literacy, youth, and advocacy. It is funded primarily by restricted foundation grants, with some additional income provided by individual donors and board members. Key Performance Indicators 1. Track restricted funding raised by program and the Gap still to be Raised 2. Track progress toward Individual Donor revenue goals, by category 3. Monitor rate of Board Member Giving 24
Dashboard: Fundraising 25
Zooming In: Fundraising Dashboard
JUMPSTARTING DASHBOARD DEVELOPMENT 27
Creating & Implementing Dashboards Start with the Big Picture • Understand the target audience for the dashboard: is it the • Start Board? Leadership? Program managers? • Explore and understand your organization’s business model drivers • Determine KPIs in an inclusive, team-based process • Begin to cultivate a culture of data driven decisionmaking at your organization 28
Creating & Implementing Dashboards Put your Dashboard Plan into Action • Create a cross-functional team around data at your • Start organization • Define accountability for each data point being measured • Set parameters about who will maintain and update the dashboard and how often it will be updated • Develop the data analytics skill set of staff • Choose an appropriate platform for dashboard reporting 29

QUESTIONS? 30
RESOURCES 31
Resources • Why Financial Dashboards Matter, and Five Pointers to Get You Started, Neela Pal, FMA, Forbes, 2015. http: //www. forbes. com/sites/skollworldforum/2015/04/09/why-financialdashboards-matter-and-five-pointers-to-get-you-started/ • How Hands On Atlanta Uses a Dashboard to Track Progress and Reach Its Goals, The Bridgespan Group. http: //www. bridgespan. org/Publications-and-Tools/Performance-Measurement/How -Hands-On-Atlanta-Uses-Dashboards. aspx • Performance Measurement: Getting Results, Harry P. Hatry, Urban Institute, 2006. https: //books. google. com/books? isbn=0877667349 • A Nonprofit Dashboard and Signal Light for Boards, Jeanne Bell and Jan Masaoka, Blue Avocado. http: //www. wallacefoundation. org/knowledgecenter/Resources-for-Financial-Management/Pages/A-Nonprofit-Dashboard-and. Signal-Light-for-Boards. aspx 32
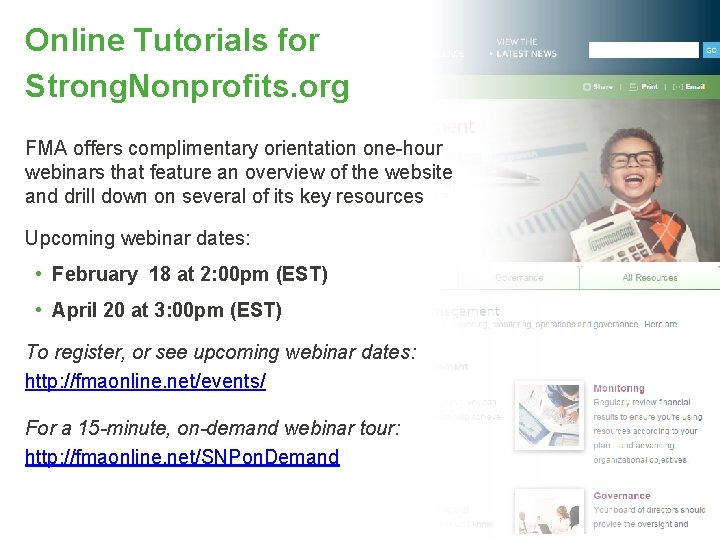
Online Tutorials for Strong. Nonprofits. org FMA offers complimentary orientation one-hour webinars that feature an overview of the website and drill down on several of its key resources Upcoming webinar dates: • February 18 at 2: 00 pm (EST) • April 20 at 3: 00 pm (EST) To register, or see upcoming webinar dates: http: //fmaonline. net/events/ For a 15 -minute, on-demand webinar tour: http: //fmaonline. net/SNPon. Demand
Resources and Links For access to NPQ’s other webinars: https: //nonprofitquarterly. org/category/webinars/ To subscribe to NPQ’s quarterly magazine: https: //nonprofitquarterly. org/series/summer-2015/
Fiscal Management Associates, LLC • Established in 1999 to serve not-for-profit organizations around the country • Provides customized financial management, accounting, software, organizational development, human resources, and other consulting services • Works directly with organizations or through funder-supported management assistance programs FMA's mission is to empower not-for-profit organizations with the knowledge and skills to successfully serve their constituents and fulfill their missions Hilda Polanco, CPA, CCSA®, CGMA hpolanco@fmaonline. net @FMA 4 Nonprofits /Fiscal. Management. Associates New York | Chicago | San Francisco | LA www. fmaonline. net linkedin. com/company/fiscal-management- associates-llc
- Slides: 35