Modelling of a Coastal Aquifer Using FEFLOW Seawater


")

 Dr. Sudhir Kumar (NIH, Roorkee) Dr.")

 and identification")


")
 = 50 m below MSL")
 = 50 m below MSL")


 Number of Layers")


- Slides: 34
Modelling of a Coastal Aquifer Using FEFLOW
Seawater Intrusion Ø In coastal regions, overexploitation of groundwater has caused the encroachment of seawater into freshwater aquifers. Ø Saltwater is heavier, hence tends to move underneath the freshwater layer. Ø The freshwater, however, has a hydraulic gradient downward towards the coast, hence will flow to the sea. Ø This outflow momentum force can counter balance the density-driven seawater. Ø Without it, seawater will continue to move inland until the entire aquifer below sea level is occupied by it. Ø Since such a hydraulic gradient always exists due to the precipitation recharge inland, an equilibrium position will establish. The toe then marks the maximum extent of intrusion.
Seawater Intrusion in Coastal Area of North Goa Ø Coastal tracts of Goa (India) are rapidly being transformed into settlement areas. Ø The poor water supply facilities have encouraged people to have their own source of water by digging or boring a well. Ø During the last decade, there have been large-scale withdrawals of groundwater by builders, hotels and other tourist establishments. Ø Though the seawater intrusion has not yet assumed serious magnitude, but in the coming years it may turn to be a major problem if corrective measures are not initiated at this stage. Ø It is necessary to understand how fresh and salt water move under various realistic pumping and recharge scenarios.
Objectives of the Study • Simulation of seawater intrusion in a region along Goa coast. • Evaluation of the impact on seawater intrusion due to various groundwater pumping scenarios. • Sensitivity analysis to find the most sensitive parameters affecting the simulation. • Suggestions for remedial measures.
Study Group: Mr. C. P. Kumar (NIH, Roorkee) Dr. Sudhir Kumar (NIH, Roorkee) Dr. B. K. Purandara (NIH, Belgaum) Dr. A. G. Chachadi (Goa University) Duration: 3 Years (April 2004 to March 2007) Budget: NIH Funding
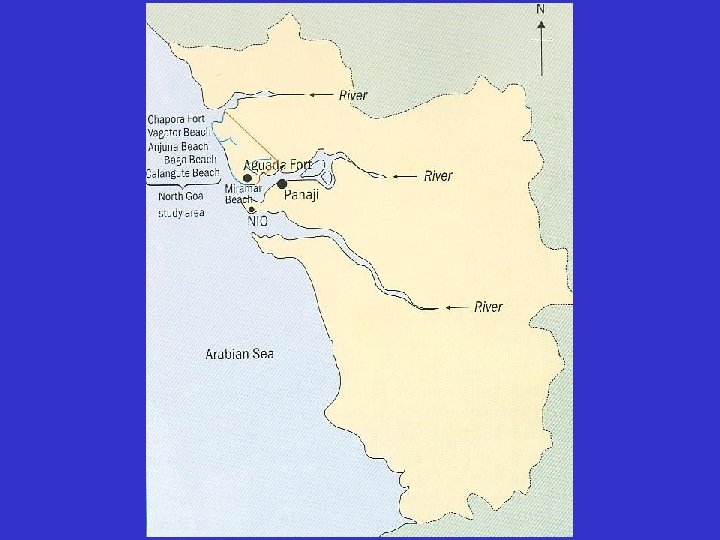
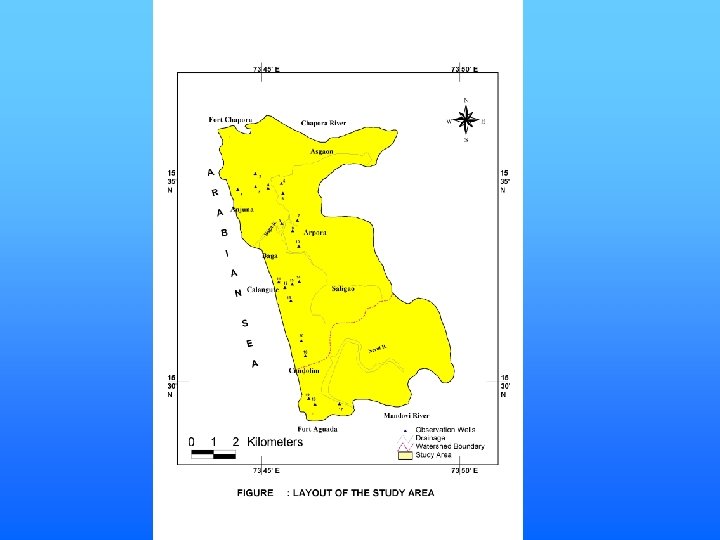
Study Area • The study area is bound by rivers Chapora and Mandovi in north and south directions respectively, besides Arabian sea in the west. • Bardez Taluk of North Goa (catchments of Baga & Nerul rivers = 74 km 2) • Coastal tract from Fort Aguada to Fort Chapora (15 km) • One third tourists visit Bardez coastal areas (Anjuna, Baga, Calangute beaches) • Area of interest = 30 km 2
Work Plan: • Establishment of technical collaboration with participating agency (Goa University) and identification of a part of the coastal area in Bardez taluk of North Goa for the present study. • Collection of relevant data, literature and maps. • Field investigations: Ø Identification of 20 observation wells. Ø Measurement of monthly groundwater level data in observation wells (September 2004 to August 2005). Ø Collection of groundwater samples in September, November 2004, January, March, April, June 2005.
Laboratory analysis: Ø Measurement of salinity for collected groundwater samples in the laboratory. Ø Based upon bi-monthly measurements of salinity, groundwater quality in all the observation wells was found to be reasonably fresh, both in pre- and post-monsoon periods. Ø It can be attributed to the fact that the transition zone of fresh water-saline water lies below the shallow open wells, as evidenced by vertical electrical soundings.
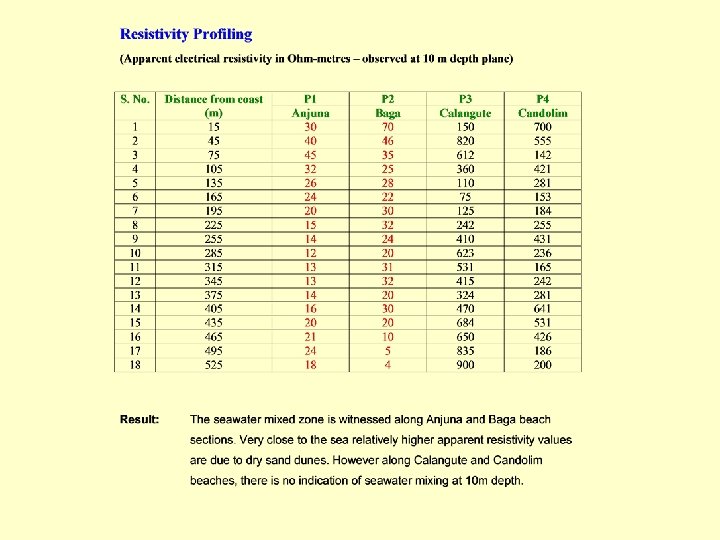
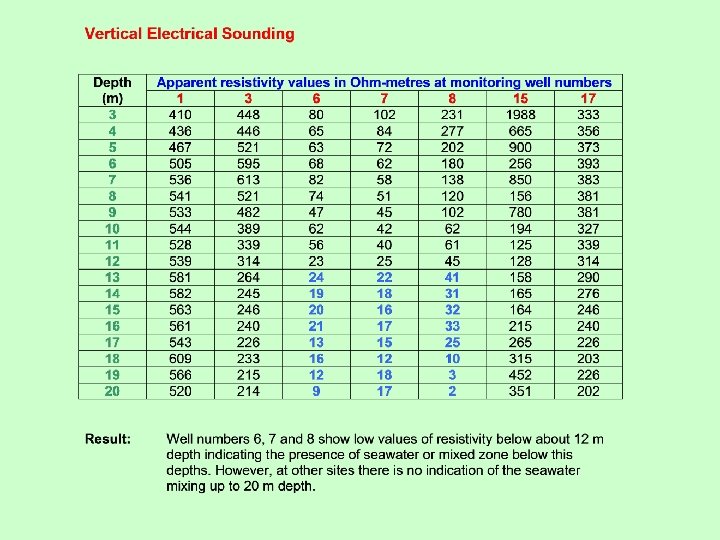
Resistivity Profiling and Sounding: To know the distribution of salt-water/fresh-water interface - Resistivity profiling: Apparent electrical resistivity measured along four profiles (Anjuna, Baga, Calangute and Candolim) from sea coast to 525 meters inland. Vertical electrical sounding: Carried out at 7 monitoring well locations upto a depth of 20 metres. Ø Results of resistivity profiling and vertical electrical sounding have been presented in forthcoming slides.
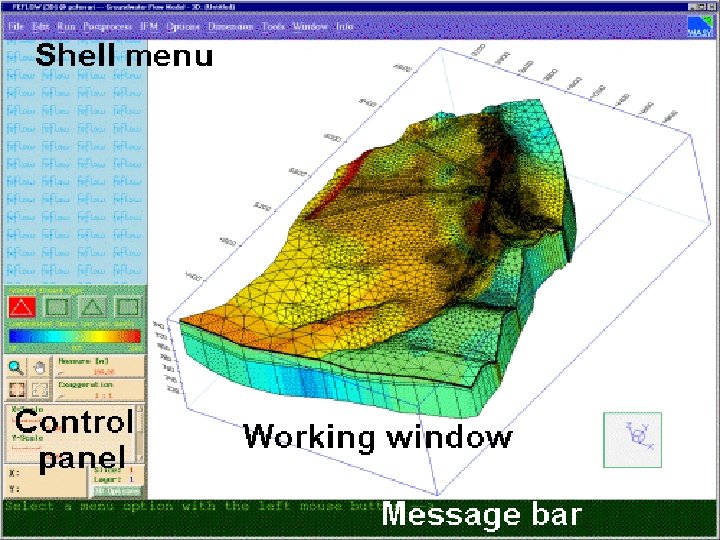
Modelling Software Package Ø A sophisticated finite-element package for simulating 3 D fluid density-coupled flow and contaminant mass (salinity) in the subsurface.
Model Setup Ø Digitization of the study area map Ø Creation of finite element mesh Ø Design of slices and layers (3 D model) Ø Flow data (initials, boundaries, materials) Ø Transport data (initials, boundaries, materials)
Digitized Map & Observation Wells
Finite Element Mesh (Initially, the model was setup with 734 nodes and 607 elements) Nodes = 32053 Elements = 52656 Total Area = 73. 796 km 2
Topography Reference zero elevation (datum) = 50 m below MSL
Initial Head Distribution Reference zero elevation (datum) = 50 m below MSL
Hydraulic Conductivity Measured at 6 locations in the study area (3. 3 to 31. 6 m/d or 0. 381 e-4 to 3. 657 e-4 m/s) - Data regionalization through Akima inter/extra-polation.
Groundwater Draft & Recharge Density = 25 wells / km 2 Average annual gw draft per structure = 0. 65 ha-m Rainfall Recharge: Laterite = 7% Alluvium = 10%
Ø Initially, the model was setup with 734 nodes and 607 elements and trial simulation run was made. Ø However, it caused numerical oscillations. Therefore, the entire mesh was re-created with 32053 nodes and 52656 elements and all the subsequent steps were repeated.
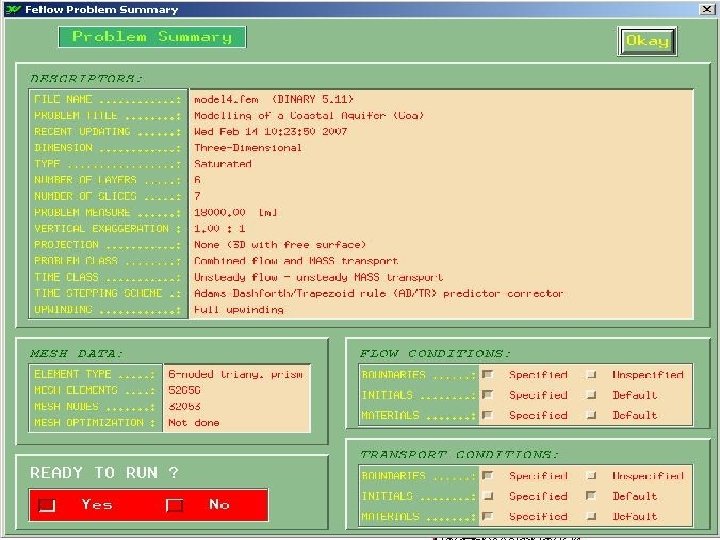
FEFLOW Problem Summary Dimension : Three-Dimensional Type : Saturated media (groundwater) Number of Layers : 6 Number of Slices : 7 Projection : None (3 D with free surface) Problem Class : Combined flow and mass transport Time Class : Unsteady flow – Unsteady mass transport Upwinding : Full upwinding Element Type : 6 -noded triangular prism Mesh Elements : 52656 Mesh Nodes : 32053 Incorporate fluid viscosity dependencies Extended Boussinesq approximation applied to density coupling Time Stepping Scheme : Automatic time step control via predictor-corrector schemes - Forward Adams-Bashforth/backward trapezoid (AB/TR time integration scheme) Initial time step length : 0. 001 d Final time : 3650 d Slice No. 1 2 3 4 5 6 7 Unconfined (phreatic) aquifer(s) Status Free & movable Unspecified Fixed
Three-dimensional Fringes for Hydraulic Head at the End of Simulation Period
Three-dimensional Plot for Mass Distribution
Mass at Top Section
Mass at Middle Section
Mass at Bottom Section
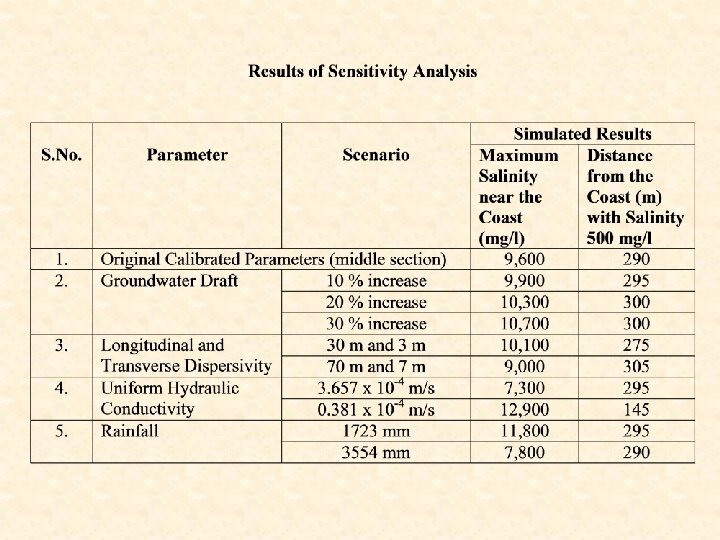
Simulated Extent of Seawater Intrusion
ØPresently, seawater intrusion in Bardez taluk of North Goa is confined only upto 290 m from the coast under normal rainfall conditions and present draft pattern. It may slightly extend farther for low rainfall years. ØSeawater intrusion may further advance inland if withdrawals of groundwater by builders, hotels and other tourist establishments continue to increase in the coming years. ØGroundwater salinity needs to be continuously monitored near the coastal area, especially within 2 km from the coast. ØCorrective measures with proper planning and management of groundwater resources in the area need to be initiated so that it may not turn to be a major water quality problem in the coming times.