
Modelling Credit ratings of international banks Authors MSc
Modelling Credit ratings of international banks Authors: MSc student Ella Khromova Doctor of Economics, Professor Karminsky Alexander M.
Actuality of the paper and the aim of the research Aim of the paper To create a reliable model of credit ratings for international banks based on the publicly available information Actuality of the paper Ø valuable for banks themselves for internal control of financial performance under increasing importance of IRB approach Ø valuable for regulators who control the financial stability of the banking system as a whole. Ø valuable for counteragents in order to choose the optimal investment strategy

Goals of the paper Ø Make a review and comparison of academic literature on the following topic Ø Compose a table of representative variables that have potential influence on ratings Ø Construct a relevant sample from the database Ø Make a model forecasting banks credit rating Ø Check in sample and out of sample fit Ø Make conclusions on the hypothesis of the paper
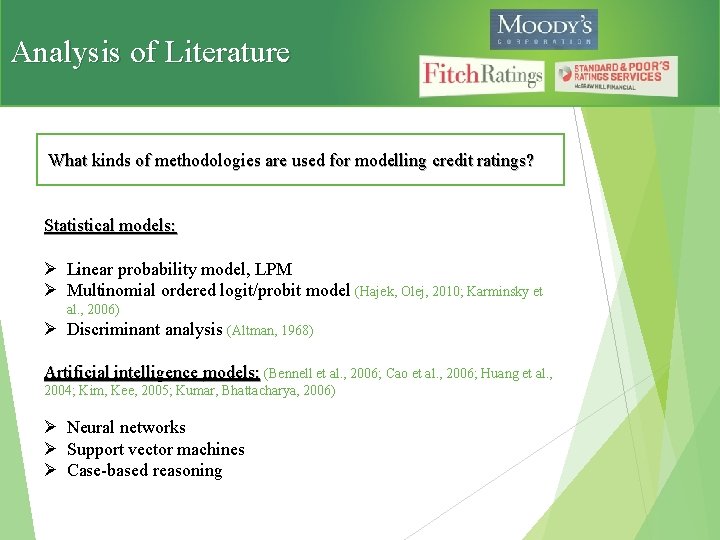
Analysis of Literature What kinds of methodologies are used for modelling credit ratings? Statistical models: Ø Linear probability model, LPM Ø Multinomial ordered logit/probit model (Hajek, Olej, 2010; Karminsky et al. , 2006) Ø Discriminant analysis (Altman, 1968) Artificial intelligence models: (Bennell et al. , 2006; Cao et al. , 2006; Huang et al. , 2004; Kim, Kee, 2005; Kumar, Bhattacharya, 2006) Ø Neural networks Ø Support vector machines Ø Case-based reasoning
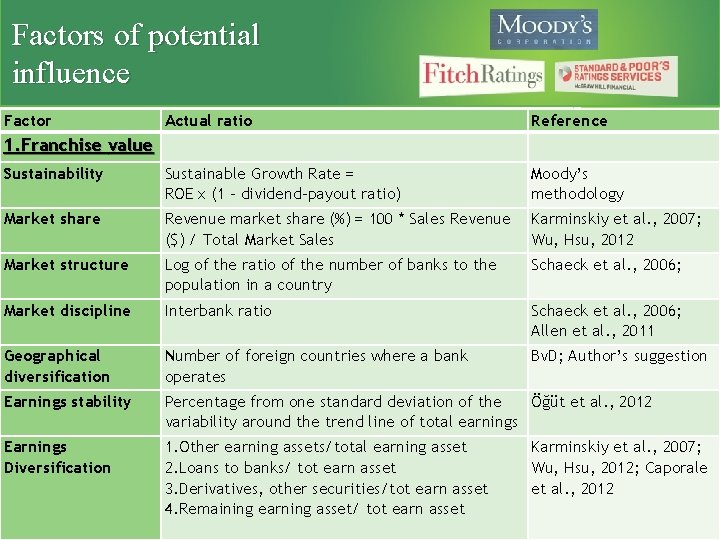
Factors of potential influence Factor Actual ratio 1. Franchise value Reference Sustainability Sustainable Growth Rate = ROE x (1 - dividend-payout ratio) Moody’s methodology Market share Revenue market share (%) = 100 * Sales Revenue ($) / Total Market Sales Karminskiy et al. , 2007; Wu, Hsu, 2012 Market structure Log of the ratio of the number of banks to the population in a country Schaeck et al. , 2006; Market discipline Interbank ratio Schaeck et al. , 2006; Allen et al. , 2011 Geographical diversification Number of foreign countries where a bank operates Bv. D; Author’s suggestion Earnings stability Percentage from one standard deviation of the Öğüt et al. , 2012 variability around the trend line of total earnings Earnings Diversification 1. Other earning assets/total earning asset 2. Loans to banks/ tot earn asset 3. Derivatives, other securities/tot earn asset 4. Remaining earning asset/ tot earn asset Karminskiy et al. , 2007; Wu, Hsu, 2012; Caporale et al. , 2012
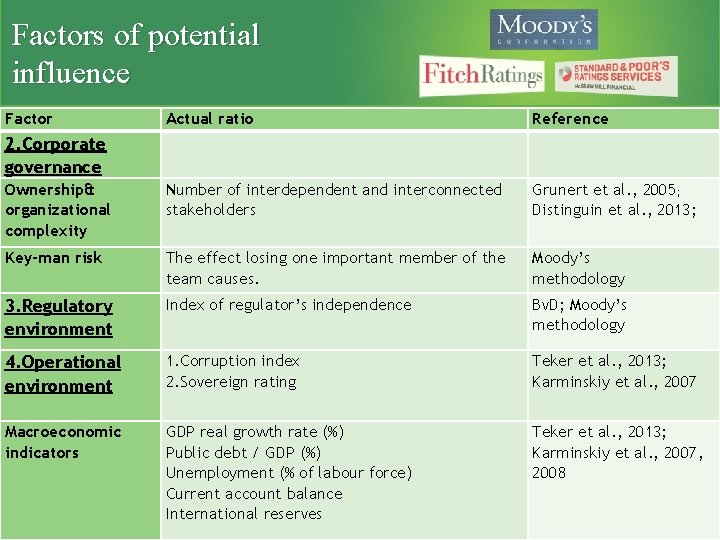
Factors of potential influence Factor Actual ratio Reference 2. Corporate governance Ownership& organizational complexity Number of interdependent and interconnected stakeholders Grunert et al. , 2005; Distinguin et al. , 2013; Key-man risk The effect losing one important member of the team causes. Moody’s methodology 3. Regulatory environment Index of regulator’s independence Bv. D; Moody’s methodology 4. Operational environment 1. Corruption index 2. Sovereign rating Teker et al. , 2013; Karminskiy et al. , 2007 Macroeconomic indicators GDP real growth rate (%) Public debt / GDP (%) Unemployment (% of labour force) Current account balance International reserves Teker et al. , 2013; Karminskiy et al. , 2007, 2008
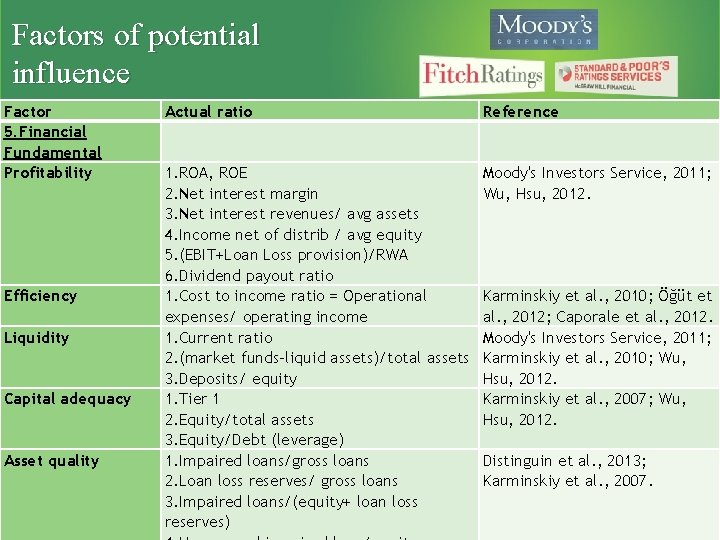
Factors of potential influence Factor 5. Financial Fundamental Profitability Efficiency Liquidity Capital adequacy Asset quality Actual ratio Reference 1. ROA, ROE 2. Net interest margin 3. Net interest revenues/ avg assets 4. Income net of distrib / avg equity 5. (EBIT+Loan Loss provision)/RWA 6. Dividend payout ratio 1. Cost to income ratio = Operational expenses/ operating income 1. Current ratio 2. (market funds-liquid assets)/total assets 3. Deposits/ equity 1. Tier 1 2. Equity/total assets 3. Equity/Debt (leverage) 1. Impaired loans/gross loans 2. Loan loss reserves/ gross loans 3. Impaired loans/(equity+ loan loss reserves) Moody's Investors Service, 2011; Wu, Hsu, 2012. Karminskiy et al. , 2010; Öğüt et al. , 2012; Caporale et al. , 2012. Moody's Investors Service, 2011; Karminskiy et al. , 2010; Wu, Hsu, 2012. Karminskiy et al. , 2007; Wu, Hsu, 2012. Distinguin et al. , 2013; Karminskiy et al. , 2007.
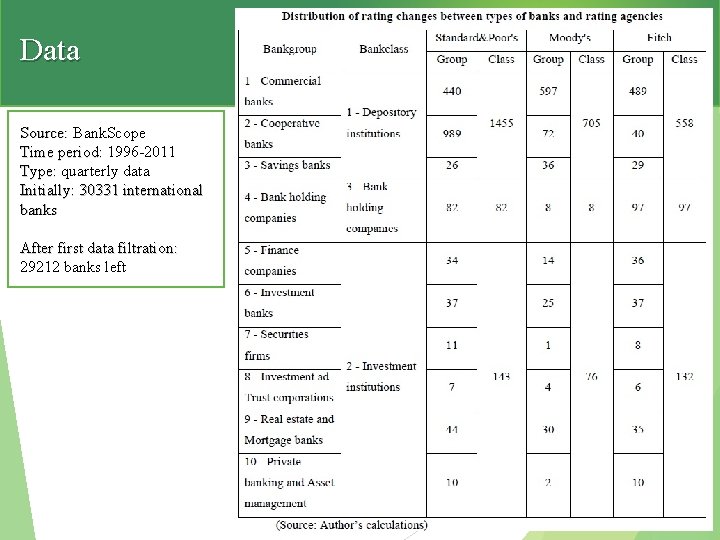
Data Source: Bank. Scope Time period: 1996 -2011 Type: quarterly data Initially: 30331 international banks After first data filtration: 29212 banks left
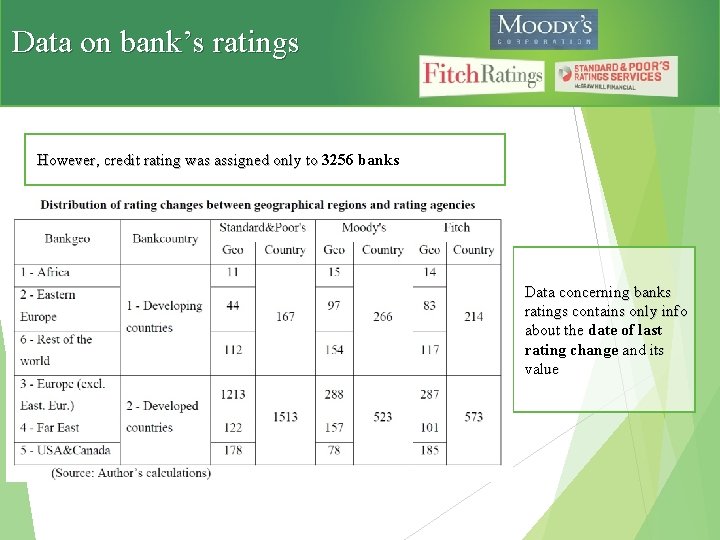
Data on bank’s ratings However, credit rating was assigned only to 3256 banks Data concerning banks ratings contains only info about the date of last rating change and its value
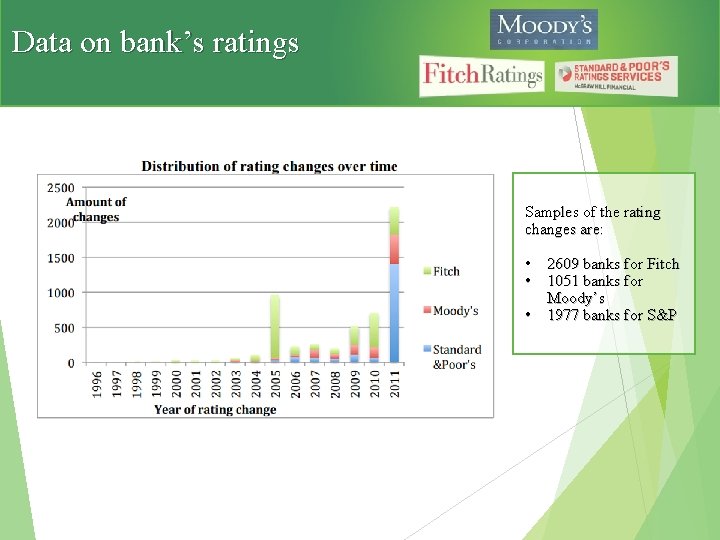
Data on bank’s ratings Samples of the rating changes are: • 2609 banks for Fitch • 1051 banks for Moody’s • 1977 banks for S&P
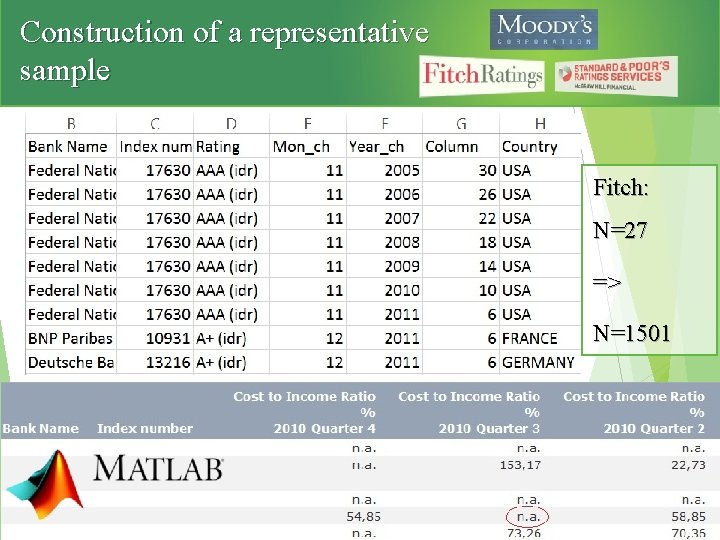
Construction of a representative sample Fitch: N=27 => N=1501
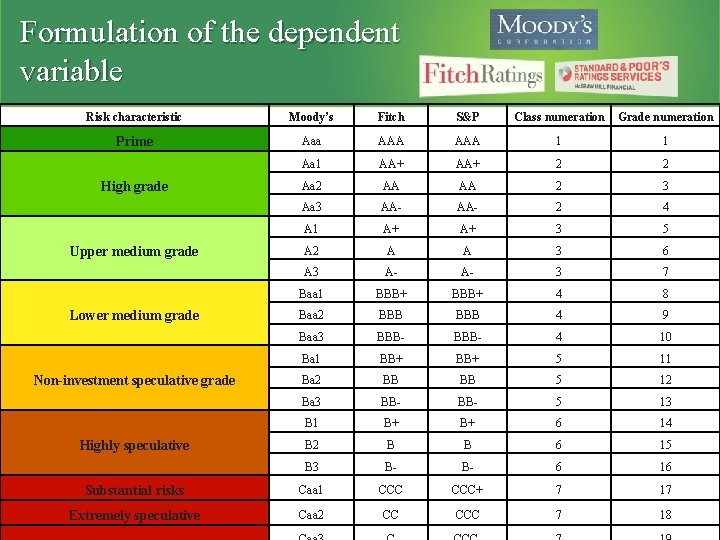
Formulation of the dependent variable Risk characteristic Moody’s Fitch S&P Class numeration Grade numeration Prime Aaa ААА 1 1 Аа 1 AA+ 2 2 Aa 2 AA AA 2 3 Aa 3 AA- 2 4 A 1 A+ A+ 3 5 A 2 A A 3 6 A 3 A- A- 3 7 Baa 1 BBB+ 4 8 Baa 2 BBB 4 9 Baa 3 BBB- 4 10 Ba 1 BB+ 5 11 Ba 2 BB BB 5 12 Ba 3 BB- 5 13 B 1 B+ B+ 6 14 B 2 B B 6 15 B 3 B- B- 6 16 Substantial risks Caa 1 CCC+ 7 17 Extremely speculative Caa 2 CC CCC 7 18 High grade Upper medium grade Lower medium grade Non-investment speculative grade Highly speculative

Empirical methodology Estimating by maximum likelihood method Multinomial ordered probit/logit model
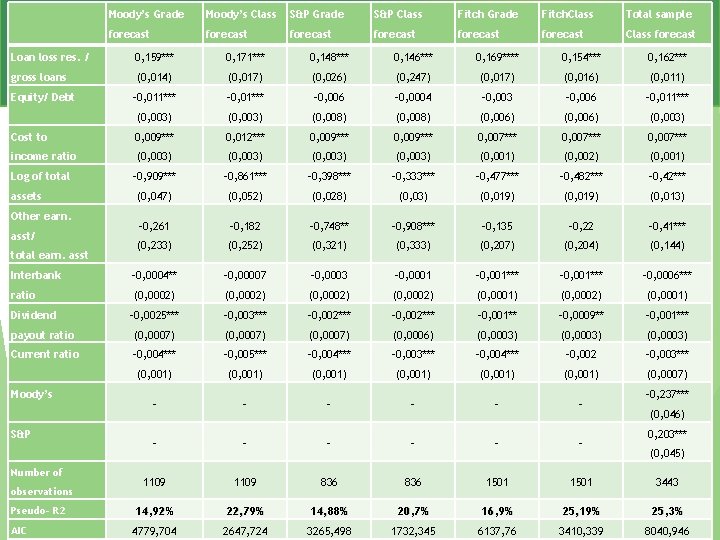
Moody’s Grade Moody’s Class S&P Grade S&P Class Fitch Grade Fitch. Class Total sample forecast forecast Class forecast Base Model Loan loss res. / 0, 159*** 0, 171*** 0, 148*** 0, 146*** 0, 169**** 0, 154*** 0, 162*** gross loans (0, 014) (0, 017) (0, 026) (0, 247) (0, 016) (0, 011) -0, 011*** -0, 006 -0, 0004 -0, 003 -0, 006 -0, 011*** (0, 003) (0, 008) (0, 006) (0, 003) Cost to 0, 009*** 0, 012*** 0, 009*** 0, 007*** income ratio (0, 003) (0, 001) (0, 002) (0, 001) Log of total -0, 909*** -0, 861*** -0, 398*** -0, 333*** -0, 477*** -0, 482*** -0, 42*** (0, 047) (0, 052) (0, 028) (0, 03) (0, 019) (0, 013) -0, 261 -0, 182 -0, 748** -0, 908*** -0, 135 -0, 22 -0, 41*** (0, 233) (0, 252) (0, 321) (0, 333) (0, 207) (0, 204) (0, 144) Interbank -0, 0004** -0, 00007 -0, 0003 -0, 0001 -0, 001*** -0, 0006*** ratio (0, 0002) (0, 0001) (0, 0002) (0, 0001) -0, 0025*** -0, 003*** -0, 002*** -0, 001** -0, 0009** -0, 001*** payout ratio (0, 0007) (0, 0006) (0, 0003) Current ratio -0, 004*** -0, 005*** -0, 004*** -0, 003*** -0, 004*** -0, 002 -0, 003*** (0, 001) (0, 001) (0, 0007) - - - 1109 836 1501 3443 14, 92% 22, 79% 14, 88% 20, 7% 16, 9% 25, 19% 25, 3% 4779, 704 2647, 724 3265, 498 1732, 345 6137, 76 3410, 339 8040, 946 Equity/ Debt assets Other earn. asst/ total earn. asst Dividend Moody’s S&P Number of observations Pseudo- R 2 AIC -0, 237*** (0, 046) 0, 203*** (0, 045)
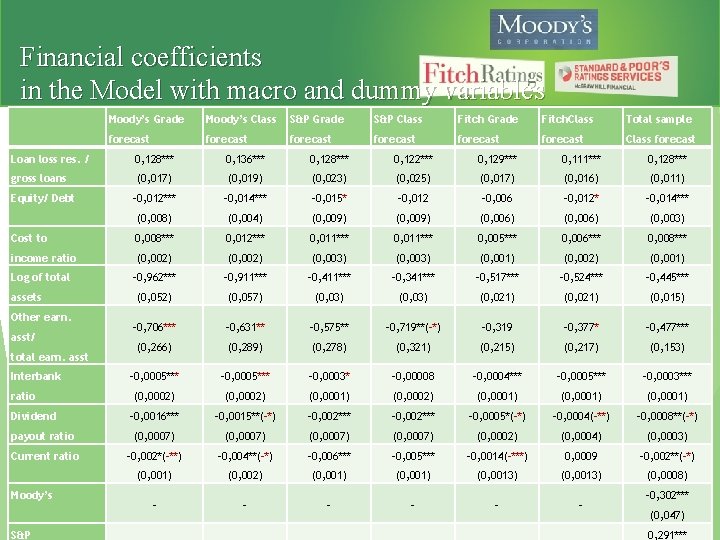
Financial coefficients in the Model with macro and dummy variables Moody’s Grade Moody’s Class S&P Grade S&P Class Fitch Grade Fitch. Class Total sample forecast forecast Class forecast Loan loss res. / 0, 128*** 0, 136*** 0, 128*** 0, 122*** 0, 129*** 0, 111*** 0, 128*** gross loans (0, 017) (0, 019) (0, 023) (0, 025) (0, 017) (0, 016) (0, 011) -0, 012*** -0, 014*** -0, 015* -0, 012 -0, 006 -0, 012* -0, 014*** (0, 008) (0, 004) (0, 009) (0, 006) (0, 003) Cost to 0, 008*** 0, 012*** 0, 011*** 0, 005*** 0, 006*** 0, 008*** income ratio (0, 002) (0, 003) (0, 001) (0, 002) (0, 001) Log of total -0, 962*** -0, 911*** -0, 411*** -0, 341*** -0, 517*** -0, 524*** -0, 445*** (0, 052) (0, 057) (0, 03) (0, 021) (0, 015) -0, 706*** -0, 631** -0, 575** -0, 719**(-*) -0, 319 -0, 377* -0, 477*** (0, 266) (0, 289) (0, 278) (0, 321) (0, 215) (0, 217) (0, 153) -0, 0005*** -0, 0003* -0, 00008 -0, 0004*** -0, 0005*** -0, 0003*** (0, 0002) (0, 0001) (0, 0001) -0, 0016*** -0, 0015**(-*) -0, 002*** -0, 0005*(-*) -0, 0004(-**) -0, 0008**(-*) payout ratio (0, 0007) (0, 0002) (0, 0004) (0, 0003) Current ratio -0, 002*(-**) -0, 004**(-*) -0, 006*** -0, 005*** -0, 0014(-***) 0, 0009 -0, 002**(-*) (0, 001) (0, 002) (0, 001) (0, 0013) (0, 0008) - - - Equity/ Debt assets Other earn. asst/ total earn. asst Interbank ratio Dividend Moody’s S&P -0, 302*** (0, 047) 0, 291***
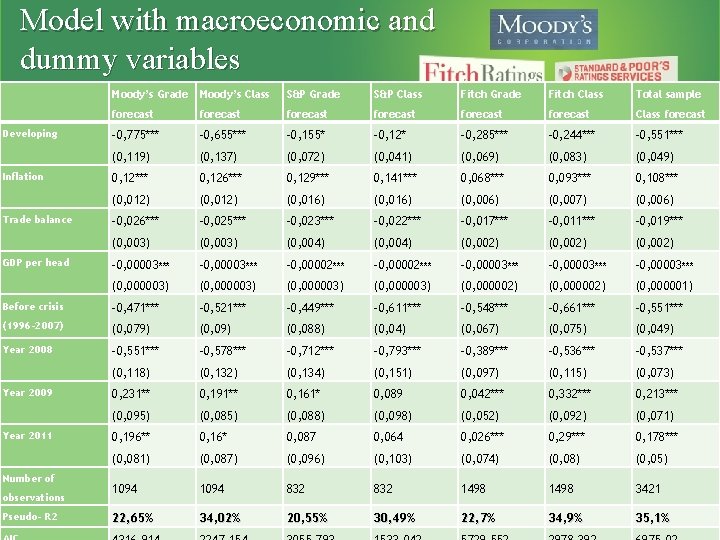
Model with macroeconomic and dummy variables Moody’s Grade Moody’s Class S&P Grade S&P Class Fitch Grade Fitch Class Total sample forecast forecast Class forecast -0, 775*** -0, 655*** -0, 155* -0, 12* -0, 285*** -0, 244*** -0, 551*** (0, 119) (0, 137) (0, 072) (0, 041) (0, 069) (0, 083) (0, 049) 0, 12*** 0, 126*** 0, 129*** 0, 141*** 0, 068*** 0, 093*** 0, 108*** (0, 012) (0, 016) (0, 006) (0, 007) (0, 006) -0, 026*** -0, 025*** -0, 023*** -0, 022*** -0, 017*** -0, 011*** -0, 019*** (0, 003) (0, 004) (0, 002) -0, 00003*** -0, 00002*** -0, 00003*** (0, 000003) (0, 000002) (0, 000001) Before crisis -0, 471*** -0, 521*** -0, 449*** -0, 611*** -0, 548*** -0, 661*** -0, 551*** (1996 -2007) (0, 079) (0, 088) (0, 04) (0, 067) (0, 075) (0, 049) Year 2008 -0, 551*** -0, 578*** -0, 712*** -0, 793*** -0, 389*** -0, 536*** -0, 537*** (0, 118) (0, 132) (0, 134) (0, 151) (0, 097) (0, 115) (0, 073) 0, 231** 0, 191** 0, 161* 0, 089 0, 042*** 0, 332*** 0, 213*** (0, 095) (0, 088) (0, 098) (0, 052) (0, 092) (0, 071) 0, 196** 0, 16* 0, 087 0, 064 0, 026*** 0, 29*** 0, 178*** (0, 081) (0, 087) (0, 096) (0, 103) (0, 074) (0, 08) (0, 05) 1094 832 1498 3421 22, 65% 34, 02% 20, 55% 30, 49% 22, 7% 34, 9% 35, 1% Developing Inflation Trade balance GDP per head Year 2009 Year 2011 Number of observations Pseudo- R 2
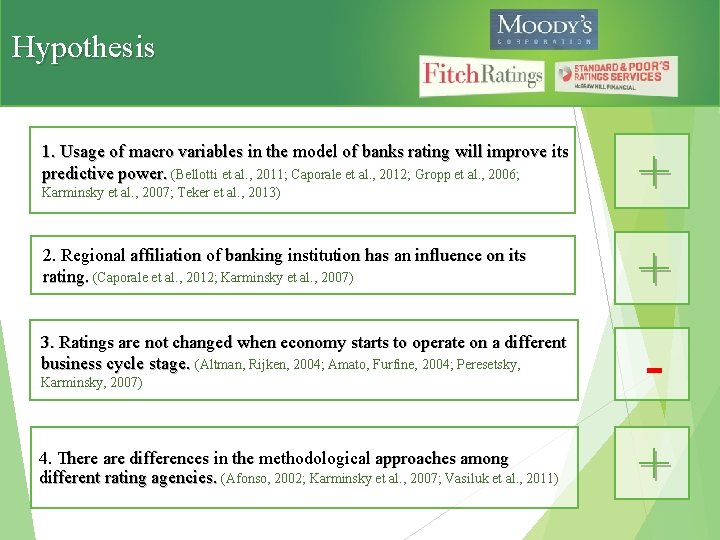
Hypothesis 1. Usage of macro variables in the model of banks rating will improve its predictive power. (Bellotti et al. , 2011; Caporale et al. , 2012; Gropp et al. , 2006; Karminsky et al. , 2007; Teker et al. , 2013) 2. Regional affiliation of banking institution has an influence on its rating. (Caporale et al. , 2012; Karminsky et al. , 2007) 3. Ratings are not changed when economy starts to operate on a different business cycle stage. (Altman, Rijken, 2004; Amato, Furfine, 2004; Peresetsky, Karminsky, 2007) 4. There are differences in the methodological approaches among different rating agencies. (Afonso, 2002; Karminsky et al. , 2007; Vasiluk et al. , 2011) + + +

In-sample fit of the model. Effect of macroeconomic variables ∆=0 |∆|<1 Base, % 50, 0 89, 3 Macro, % 60, 1 96, 3
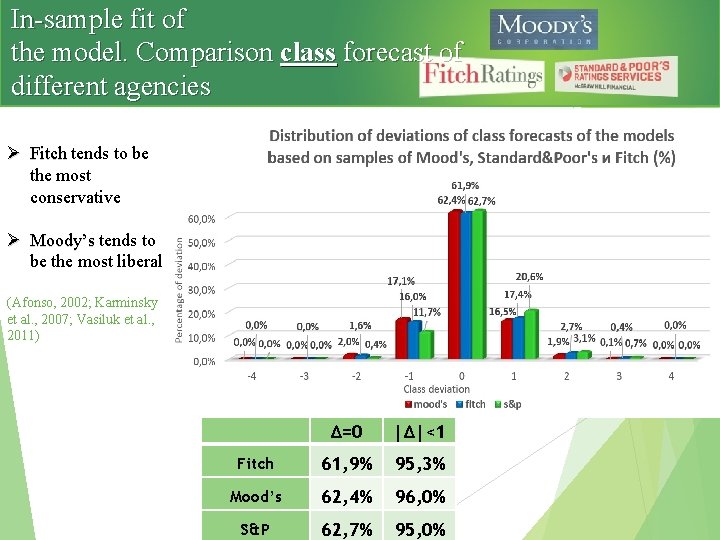
In-sample fit of the model. Comparison class forecast of different agencies Ø Fitch tends to be the most conservative Ø Moody’s tends to be the most liberal (Afonso, 2002; Karminsky et al. , 2007; Vasiluk et al. , 2011) ∆=0 |∆|<1 Fitch 61, 9% 95, 3% Mood’s 62, 4% 96, 0% S&P 62, 7% 95, 0%
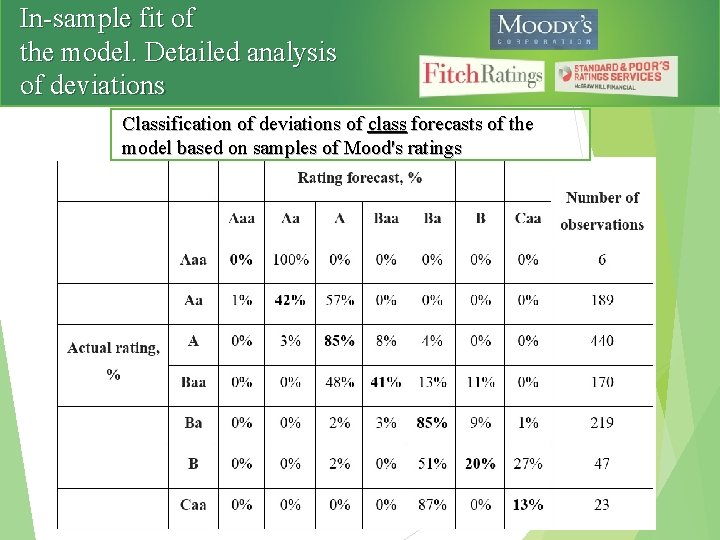
In-sample fit of the model. Detailed analysis of deviations Classification of deviations of class forecasts of the model based on samples of Mood's ratings
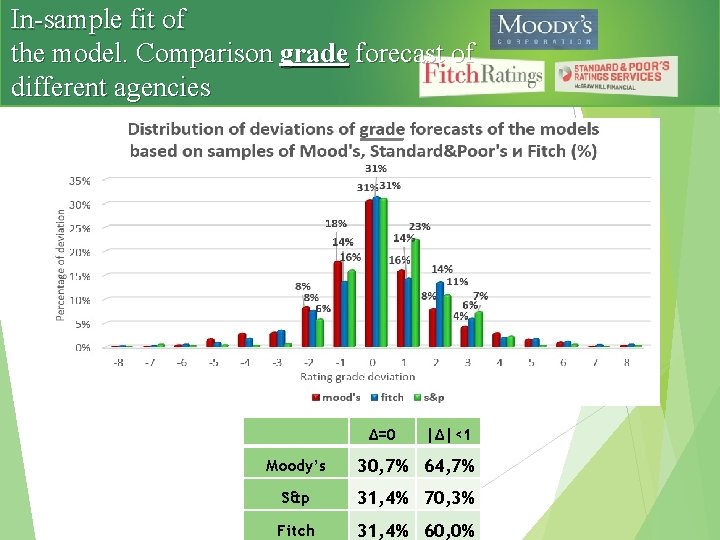
In-sample fit of the model. Comparison grade forecast of different agencies ∆=0 |∆|<1 Moody’s 30, 7% 64, 7% S&p 31, 4% 70, 3% Fitch 31, 4% 60, 0%
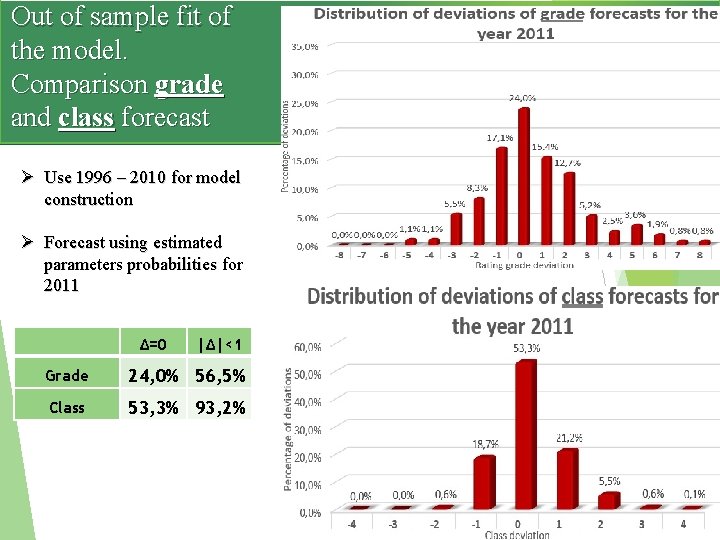
Out of sample fit of the model. Comparison grade and class forecast Ø Use 1996 – 2010 for model construction Ø Forecast using estimated parameters probabilities for 2011 ∆=0 |∆|<1 Grade 24, 0% 56, 5% Class 53, 3% 93, 2%
Results 1. The list of significant and insignificant financial variables was obtained 2. Inclusion of macro variables has improved explanatory power of the model 3. Hypothesis of regional influence on banks ratings was not rejected 4. Rating agencies do change their grade when economy operates on the different business cycle stage 5. A conclusion of conservative nature of Standard&Poor’s ratings and overvalued Moody’s grades compared to the rating agency Fitch was made 6. The obtained model was classified as practically useful as predicting of rating grade gave 31% of precise results and up to 70% forecasts with an error within one rating grade, while predicting of rating class resulted in 62% and 95% respectively.

Uniqueness of the paper and Further research Uniqueness of the paper Ø The model is based on a new comprehensive data base Ø New methods of increasing number of observations were provided Ø A set of unique indicators that influence credit ratings were obtained Further research Ø Adding more qualitative indicators of institutional variables Ø Separate modelling of upgrades and downgrades of rating changes (Distinguin et al. , 2013) Ø Use other statistical or artificial intelligence methodologies

Thank you for your attention!
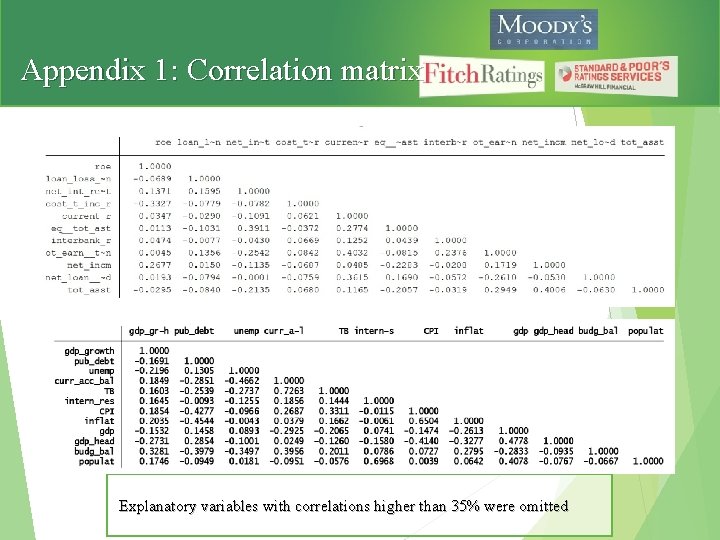
Appendix 1: Correlation matrix Explanatory variables with correlations higher than 35% were omitted
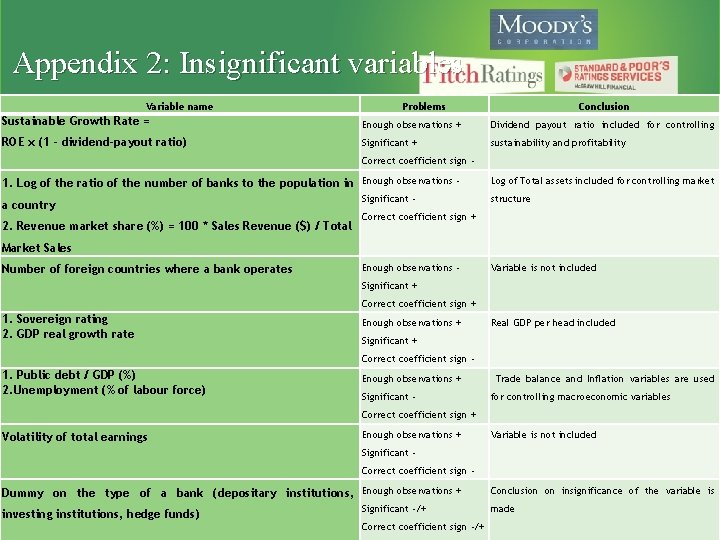
Appendix 2: Insignificant variables Variable name Problems Conclusion Sustainable Growth Rate = Enough observations + Dividend payout ratio included for controlling ROE x (1 - dividend-payout ratio) Significant + sustainability and profitability Correct coefficient sign - 1. Log of the ratio of the number of banks to the population in Enough observations a country 2. Revenue market share (%) = 100 * Sales Revenue ($) / Total Significant - Log of Total assets included for controlling market structure Correct coefficient sign + Market Sales Number of foreign countries where a bank operates Enough observations - Variable is not included Significant + Correct coefficient sign + 1. Sovereign rating 2. GDP real growth rate 1. Public debt / GDP (%) 2. Unemployment (% of labour force) Enough observations + Real GDP per head included Significant + Correct coefficient sign Enough observations + Significant - Correct coefficient sign + Volatility of total earnings Enough observations + Trade balance and Inflation variables are used for controlling macroeconomic variables Variable is not included Significant Correct coefficient sign - Dummy on the type of a bank (depositary institutions, Enough observations + investing institutions, hedge funds) Significant -/+ Correct coefficient sign -/+ Conclusion on insignificance of the variable is made
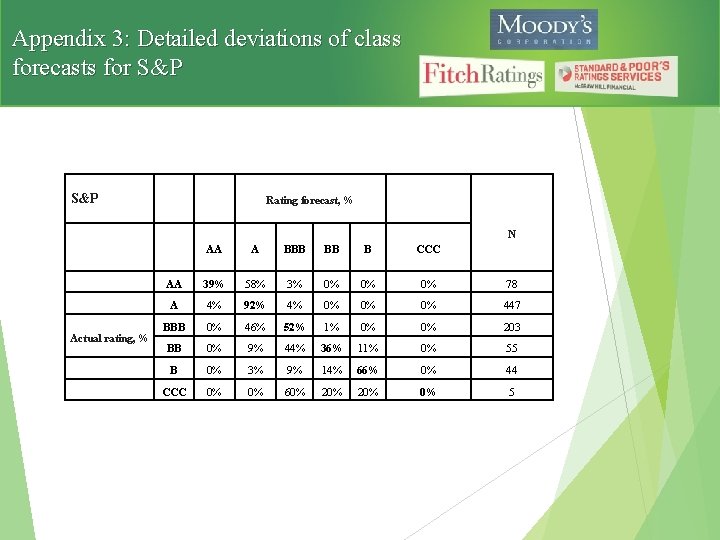
Appendix 3: Detailed deviations of class forecasts for S&P Rating forecast, % N Actual rating, % AA A BBB BB B CCC AA 39% 58% 3% 0% 0% 0% 78 A 4% 92% 4% 0% 0% 0% 447 BBB 0% 46% 52% 1% 0% 0% 203 BB 0% 9% 44% 36% 11% 0% 55 B 0% 3% 9% 14% 66% 0% 44 CCC 0% 0% 60% 20% 0% 5
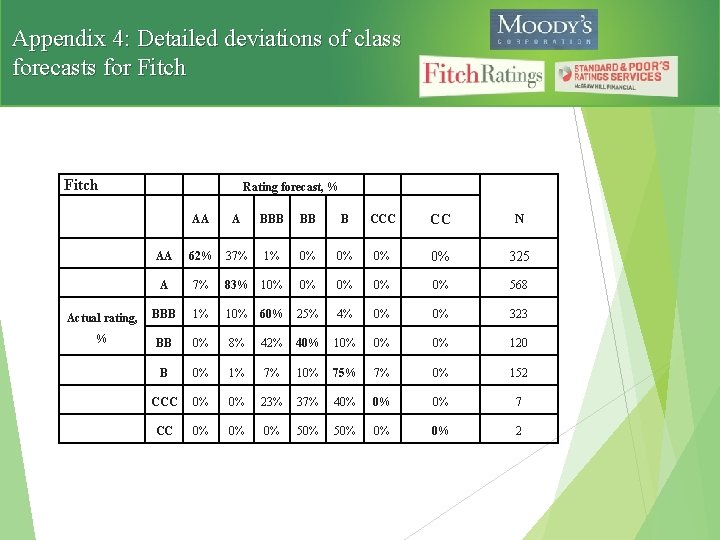
Appendix 4: Detailed deviations of class forecasts for Fitch Rating forecast, % AA A BBB BB B CCC CC N AA 62% 37% 1% 0% 0% 325 A 7% 83% 10% 0% 0% 568 1% 10% 60% 25% 4% 0% 0% 323 BB 0% 8% 42% 40% 10% 0% 0% 120 B 0% 1% 7% 10% 75% 7% 0% 152 CCC 0% 0% 23% 37% 40% 0% 0% 7 CC 0% 0% 0% 50% 0% 0% 2 Actual rating, BBB %
- Slides: 29