Modeling the Benefits of LID Stormwater Techniques for

Modeling the Benefits of LID Stormwater Techniques for Developable Parcels in the Nashoba Brook Subwatershed Bob Hartzel, CLM, CPESC Senior Water Resources Scientist

Project Overview / Goals § Project funded through: Organization for the Assabet River § Provide planning to aid 5 subwatershed towns in promoting LID as part of master planning, project permitting and development of bylaws.

Project Overview / Goals § Develop model to evaluate the suitability and priority of developable parcels in the Nashoba Brook subwatershed for LID stormwater techniques. Vine Brook § Estimate the benefits and costs of LID stormwater management compared to “conventional” stormwater management. Nashoba Brook
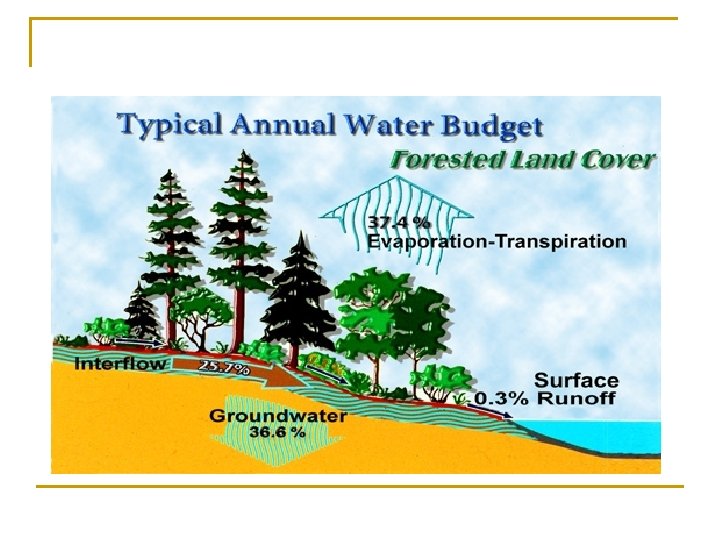
 An ecosystem-based approach to land development and stormwater management. Goal:")
Low Impact Development (LID) An ecosystem-based approach to land development and stormwater management. Goal: Mimic pre-development site hydrology


Conventional Development Centralized Pipe and Pond Control

LID Development Multiple Systems Conservation Minimization Soil Amendments Open Drainage Infiltration BMPs Vegetative BMPs Rain Barrels Pollution Prevention Disconnected Decentralized Distributed

Residential LID Site

LID Stormwater Controls Rain Garden Treatment Train Approach Raingarden Cell ath P Flow ale w S ss Gra Raingarden Cell Storm Drain System Grass Filter Strip

Bioretention Raingardens/barrels Low Impact Development Stormwater Controls Porous surfaces Bioretention

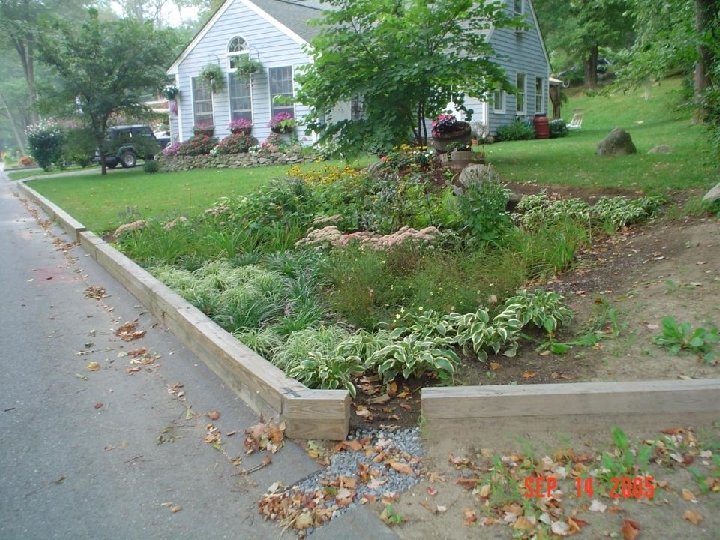
Raingardens A bowl-shaped garden designed to capture and absorb stormwater.

Bioretention Cell Similar to raingarden, more highly engineered: • underdrain/riser pipe • gravel bed • engineered soils
 Functional Landscape Reduced Impervious Area 98% Stormwater volume reduction for")
Street Edge Alternatives (SEA) Functional Landscape Reduced Impervious Area 98% Stormwater volume reduction for 2 -year storm

“SEA” Street: Maximized space for filtration, recharge and landscape elements
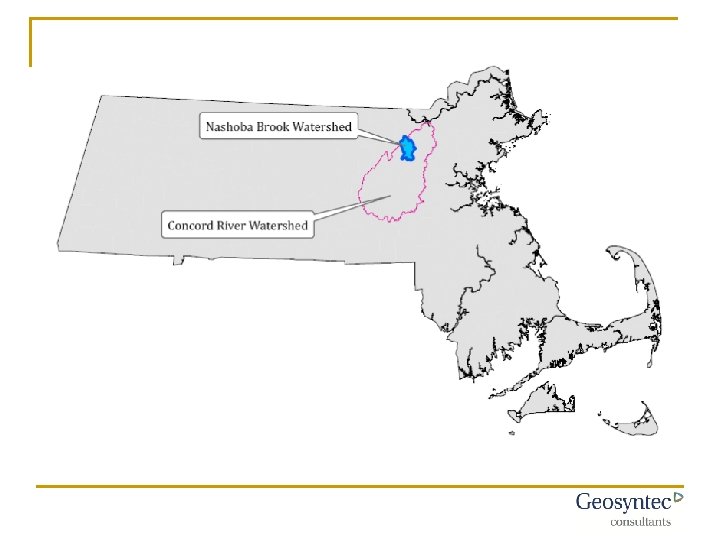

Watershed Communities Town % of watershed Acton 43% Westford 35% Littleton 14% Carlisle 5% Concord 3%

Subwatershed Delineation

Task 1: Evaluate Parcels Most Suitable for LID A. “Developable Parcel” Inventory / Map (Not Retrofits) n Unimproved lots > minimum lot size requirement n Municipally owned property that is for sale. n Parcels protected though open space preservation, deed restrictions, etc. = Not Developable n Any portion of a parcel within wetlands = Not Developable Inventory developed with 5 town planning departments

Developable Parcels Map § 198 Parcels § 11% of land in watershed § Summary Statistics: • Size Range: 0. 3 – 150 acres • 50% of land comprised by largest 8% of parcels • 178 residential parcels • 12 commercial parcels • 8 industrial parcels

Task 1: Evaluate Parcels Most Suitable for LID B. Develop Model to Rank Site Suitability / Priority S = Soils D = Distance to Receiving Water B = Shallow Bedrock Imp = Impervious Cover Analysis PWS = Lands Critical to Public Water Supply Quality and Quantity LID Priority Ranking = 2 (S) + 1 (D) + 1 (Imp) - 1 (PWS) – 1 (B)

“…with proper design and maintenance, LID stormwater techniques can be used successfully at many sites with less than ideal initial conditions. ” § Soil Amendments § Underdrains § Steep Slope Designs (Terraces, etc. ) § “Not Enough Space”
.")
A newly planted bioretention cell installed in the Dudley Pond watershed (Wayland, MA).

Lake Shirley Bioretention Cell

Lake Shirley Bioretention Cell Lesson: Small is beautiful!
 Lesson: Sloped areas can be put to work!")
Terraced bio-infiltration system (Plymouth, MA) Lesson: Sloped areas can be put to work!

Soils Hydrologic Soil Groups A: Sand, loamy sand or sandy loam soils. High infiltration rates! B: Silt loam or loam. Moderate infiltration when fully wetted. C: Sandy clay loam. Poor infiltration when thoroughly wetted. D: Clay loam, silty clay loam, sandy clay, silty clay or clay. Highest runoff potential, very low infiltration when fully wetted.

Shallow Bedrock

Impervious Cover Assessment Total Subwatershed Imperviousness = 12. 1%

Impervious Cover Assessment Total Subwatershed Imperviousness = 12. 1%

Impervious Cover Assessment Range = 5. 9% - 20. 2%

Public Water Supply Protection § Public Water Supply Wells § Interim Wellhead Protection Areas § Zone 2 Wellhead Protection Areas Water quantity Drinking water quality concerns

Parcel Ranking

Parcel Ranking

Parcel Ranking…Wetlands

Next Steps: Evaluate the Relative Benefits of LID Techniques A. Create “Standardized” Development Scenarios § LID § Conventional Development § Cluster / Open Space Development (Residential parcels only) B. Compare LID vs. Traditional Stormwater Mgt. § Water Quality / Quantity Benefits § Cost
 Values: § Size: 0.")
Parcel Statistics: Choosing a “Representative” Parcel Median (50 th Percentile) Values: § Size: 0. 9 Acres § % IMP: 8. 4%

Examples: “Representative” Residential Parcels Size: ~0. 9 acres Imperviousness: ~8%

Examples: “Representative” Commercial/Industrial Parcels Size: ~1. 3 acres Imperviousness: ~30%

Quantifying LID Benefits: Infiltration and Load Reduction PRECIPITATION EVAPORATION RUNOFF STORAGE LOAD = RUNOFF VOLUME X EMC INFILTRATION SWMM (VOLUME) EVENT MEAN CONCENTRATION (QUALITY)

Modeling Hydrologic Budget: EPA’s SWMM INPUTS n Precipitation: 57 years of Boston rainfall data n Evaporation: data obtained from Mass. GIS n Subwatersheds based on surface types: roofs, pavement, lawn, wooded, etc. n Infiltration BMPs: drywells, bioinfiltration OUTPUTS n Runoff totals from subwatersheds n Precipitation/Runoff statistics

Single Family Lot vs. Residential Subdivision Parcels with 1 -4 buildable lots = “Single Family Lots” (138 parcels, 285 ac. ) Parcels with 5+ buildable lots = “Residential Subdivisions” (40 parcels, 920 ac. )

Conceptual Single Family Lot: Conventional Development n n Runoff: 8. 9 in/yr Infiltration: 28. 1 in/yr TSS: 213 lb/ac/yr TP: 0. 72 lb/ac/yr

Conceptual Single Family Lot: Low Impact Development n n Runoff: 1. 9 in/yr Infiltration: 35. 2 in/yr TSS: 68 lb/ac/yr TP: 0. 27 lb/ac/yr Runoff: -7. 0 in/yr Infiltration: +7. 1 in/yr TSS: -145 lb/ac/yr (-68%) TP: -0. 44 lb/ac/yr (-63%)

Conceptual Residential Subdivision: Conventional Development n n Runoff: 11. 8 in/yr Infiltration: 25. 2 in/yr TSS: 330 lb/ac/yr TP: 0. 92 lb/ac/yr

Conceptual Residential Subdivision: Low Impact Development n n Runoff: 0. 7 in/yr Infiltration: 36. 5 in/yr TSS: 38. 4 lb/ac/yr TP: 0. 06 lb/ac/yr Runoff: -11. 1 in/yr Infiltration: +11. 3 in/yr TSS: -292 lb/ac/yr (-88%) TP: -0. 86 lb/ac/yr (-93%)

Conceptual Commercial/Industrial: Conventional Development n n Runoff: 16. 3 in/yr Infiltration: 20. 8 in/yr TSS: 415 lb/ac/yr TP: 1. 73 lb/ac/yr

Conceptual Residential Subdivision: Low Impact Development n n Runoff: 1. 1 in/yr Infiltration: 36. 5 in/yr TSS: 24 lb/ac/yr TP: 0. 07 lb/ac/yr Runoff: -15. 2 in/yr Infiltration: +15. 7 in/yr TSS: -391 lb/ac/yr (-94%) TP: -1. 66 lb/ac/yr (-96%)

LID Benefits: Infiltration The added infiltration from LID being applied to developable parcels may be as high as: 22 gal/person/day … for the population of Acton, Littleton, and Westford (~51, 500 people)

LID Benefits: Infiltration 22 gal/person/day = approximately… 2 extra toilet flushes (1. 6 gal each) person per day… 1 5 -minute shower (10 gal) person per day… 1 dishwasher load (8 gal) person per day… … for the population of Acton, Littleton, and Westford (~51, 500 people)

LID Benefits: TSS The reduction in weight of TSS from LID being applied to developable parcels may be as high as: 190 tons/year … entering Nashoba Brook

LID Benefits: TSS 190 tons = approximately… 140 cubic yards of sand/sediment… entering Nashoba Brook each year

LID Benefits: TP The reduction in weight of TP from LID being applied to developable parcels may be as high as: 1190 lbs/year … entering Nashoba Brook

1190 lbs/year of TP = approximately… 14, 760 cu. ft. of algae …. growing per year in Nashoba Brook (and tributary ponds) *assuming 1 lb P : 1026 lb wet Phytoplankton, density Phytoplankton ~ density H 20
 COST: LID vs. Conventional")
Cost per Acre Associated with Stormwater Management (x $1, 000) COST: LID vs. Conventional Stormwater 90 Conventional 80 LID 70 60 50 40 30 20 10 0 Single Family Res. Subidivision Comm. /Ind.

Thank you for your time!

Single Family Home LANDSCAPING Item: Units Tree Removal 1 ac $9, 150 0. 8 $7, 320 0. 3 $2, 745 Clearing/Grubbing 1 ac $7, 500 0. 9 $6, 750 0. 38 $2, 850 Grass Seed/Sod 1 sy $6 3900 $23, 400 1328 $7, 968 Native Trees/Shrubs 1, 2 ea $30 0 $0 5 $150 Soil Amendment 2 cy $51 0 $0 12 $627 Raingarden/Bioretention 2, 3 INFRASTRUCTURE/CONVEYANCE/STORAGE Item: sf $11 0 $0 770 $8, 470 Standard Asphalt Driveway 2 sy $10 94 $940 0 $0 Porous Pavement Driveway 2, 3 sy $108 0 $0 94 $10, 152 Drywell - (including inst. ) 2 TOTAL Notes: Construction/Material costs only. Does not include maintenance or property values. 1. From PA DOT construction cost spreadsheet (ftp: //ftp. dot. state. pa. us/public/Bureaus/design/Pub 2 87/Pub%20287. pdf) 2. Geosyntec cost estimate data, past projects 3. "Evaluation of LID Best Management Practices (BMPs) Opportunities, " Charles River Watershed Association ea $1, 500 0 $0 $38, 410 1 $1, 500 $34, 462 -10. 3% Unit Cost Conventional Design Qty. Total Low Impact Design Qty. Total

Residential Subdivision LANDSCAPING Item: Conventional Design Qty. Total Low Impact Design Qty. Total Tree Removal 1 ac Clearing/Grubbing 1 $9, 150 0. 8 $7, 320 3. 6 $32, 940 ac $7, 500 0. 9 $6, 750 4. 6 $34, 500 Grass Seed/Sod 1 sy $6 46800 $280, 800 15936 $95, 616 Native Trees/Shrubs (for bioretention areas) 1, 2 ea Soil Amendment 2 $30 0 $0 200 $6, 000 Raingarden/Bioretention 2, 3 cy $51 0 $0 148 $7, 525 INFRASTRUCTURE/CONVEYANCE/STORAGE Item: sf $11 0 $0 19100 $210, 100 Standard Asphalt Driveway 2 sy $10 1130 $11, 300 0 $0 Standard Asphalt Roadway 2 sy $20 4670 $93, 400 3090 $61, 800 Porous Pavement Driveway 2, 3 sy $108 0 $0 1130 $122, 040 Drywell - (including inst. ) 2 ea $1, 500 0 $0 12 $18, 000 Catch Basins 1, 2 ea $3, 000 7 $21, 000 0 $0 CPP Storm Drain Pipe 1 lf $75 1710 $128, 250 180 $13, 500 Vegetated Swale 2 sf $2 0 $0 1840 $3, 680 Detention Pond 2, 4 cy $15 2450 $36, 750 0 $0 Outlet Structure 2 ea $1, 500 1 $1, 500 $587, 070 $0 $605, 701 3. 2% TOTAL Units Unit Cost

Commercial / Industrial LANDSCAPING Item: Units Tree Removal 1 Clearing/Grubbing 1 Grass Seed/Sod 1 ac ac sy 1, 2 ea $30 Soil Amendment 2 Raingarden/Bioretention 2, 3 INFRASTRUCTURE/CONVEYANCE/STORAGE Item: Standard Asphalt Parking 2 Porous Pavement Parking 2, 3 cy sf sy sy Drywell - (including inst. ) 2 Catch Basins 1, 2 CPP Storm Drain Pipe 1 Vegetated Swale 2 Detention Pond 2, 4 Outlet Structure 2 TOTAL ea ea lf sf cy ea Native Trees/Shrubs (for bioretention areas) Unit Cost Conventional Design Low Impact Design Qty. Total Qty. 1. 1 3390 $10, 065 $8, 250 $20, 340 0. 8 1940 0 $0 24 $720 $51 $11 $108 0 0 1475 0 $0 $0 $14, 750 $0 18 1800 1100 370 $916 $19, 800 $11, 000 $39, 960 $1, 500 $3, 000 $75 $2 $15 $1, 500 0 3 325 0 340 1 $0 $9, 000 $24, 375 $0 $5, 100 $1, 500 $93, 380 1 0 0 470 0 0 $1, 500 $0 $0 $940 $0 $0 $99, 796 6. 9% $9, 150 $7, 500 $6 Total $7, 320 $6, 000 $11, 640

Costs: Literature Review Comparison $100, 000 $90, 000 Cost per Acre associated with Stormwater Management $80, 000 $70, 000 $60, 000 $50, 000 $40, 000 $30, 000 $20, 000 $10, 000 EPA Report: Conventional EPA Report: LID Geosyntec: Conventional Geosyntec: LID $0
- Slides: 61