
Modeling of Gene expression Central Dogma of Molecular








- Slides: 43
. Modeling of Gene expression : Central Dogma of Molecular Biology Cell processes Transcription factors Proteins m. RNA Gene Edda Klipp, Humboldt-Universität zu Berlin
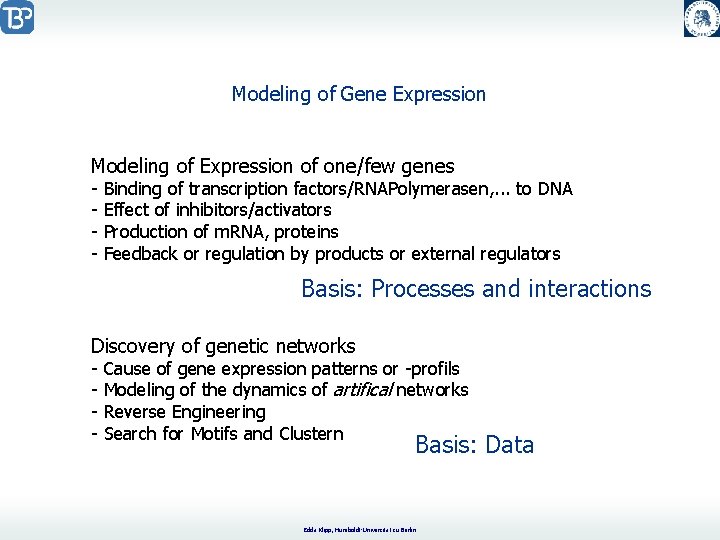
Modeling of Gene Expression Modeling of Expression of one/few genes - Binding of transcription factors/RNAPolymerasen, . . . to DNA Effect of inhibitors/activators Production of m. RNA, proteins Feedback or regulation by products or external regulators Basis: Processes and interactions Discovery of genetic networks - Cause of gene expression patterns or -profils Modeling of the dynamics of artifical networks Reverse Engineering Search for Motifs and Clustern Basis: Data Edda Klipp, Humboldt-Universität zu Berlin
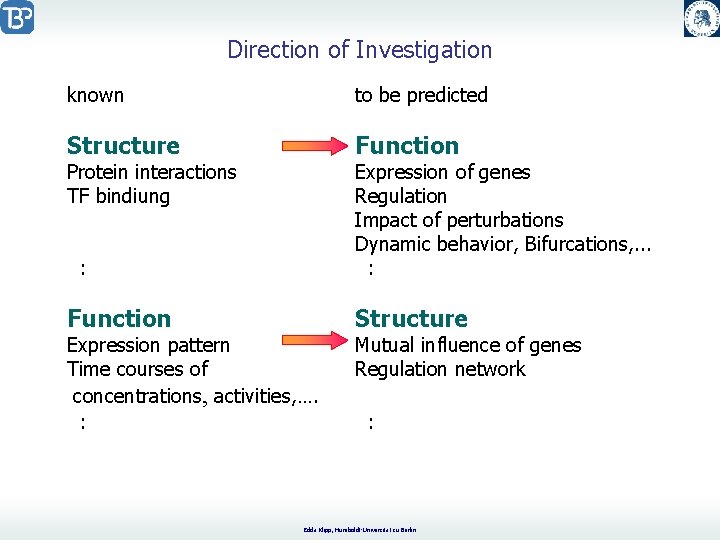
Direction of Investigation known to be predicted Structure Function Protein interactions TF bindiung Expression of genes Regulation Impact of perturbations Dynamic behavior, Bifurcations, . . . : : Function Expression pattern Time courses of concentrations, activities, …. : Structure Mutual influence of genes Regulation network : Edda Klipp, Humboldt-Universität zu Berlin
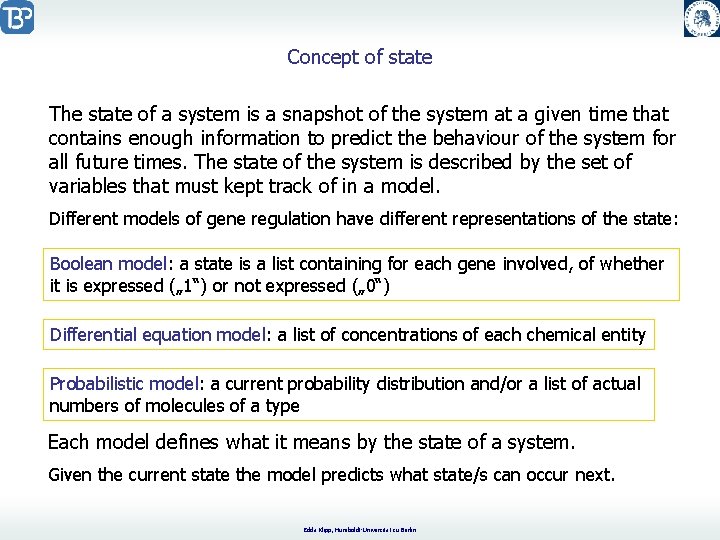
Concept of state The state of a system is a snapshot of the system at a given time that contains enough information to predict the behaviour of the system for all future times. The state of the system is described by the set of variables that must kept track of in a model. Different models of gene regulation have different representations of the state: Boolean model: a state is a list containing for each gene involved, of whether it is expressed („ 1“) or not expressed („ 0“) Differential equation model: a list of concentrations of each chemical entity Probabilistic model: a current probability distribution and/or a list of actual numbers of molecules of a type Each model defines what it means by the state of a system. Given the current state the model predicts what state/s can occur next. Edda Klipp, Humboldt-Universität zu Berlin
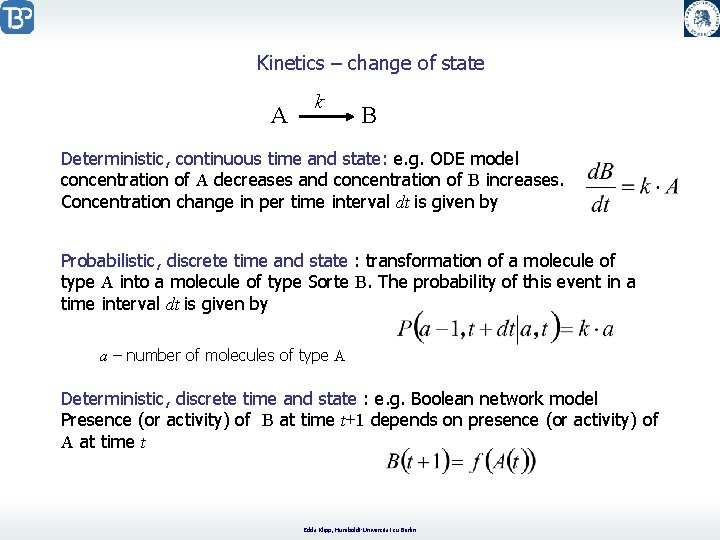
Kinetics – change of state A k B Deterministic, continuous time and state: e. g. ODE model concentration of A decreases and concentration of B increases. Concentration change in per time interval dt is given by Probabilistic, discrete time and state : transformation of a molecule of type A into a molecule of type Sorte B. The probability of this event in a time interval dt is given by a – number of molecules of type A Deterministic, discrete time and state : e. g. Boolean network model Presence (or activity) of B at time t+1 depends on presence (or activity) of A at time t Edda Klipp, Humboldt-Universität zu Berlin
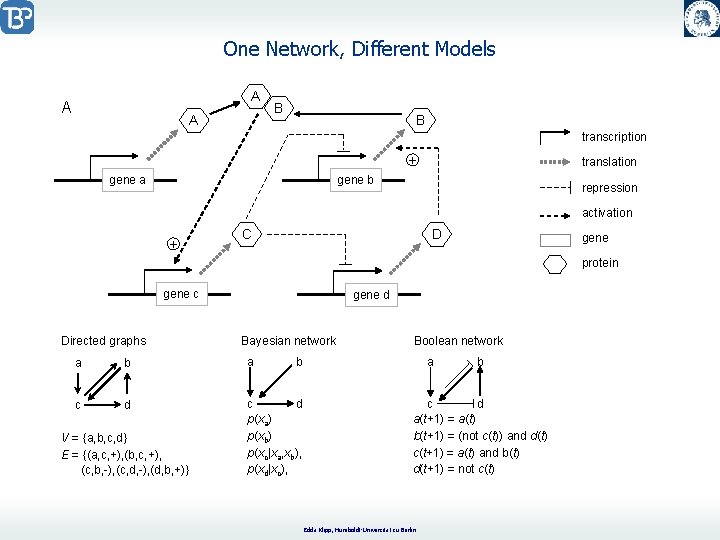
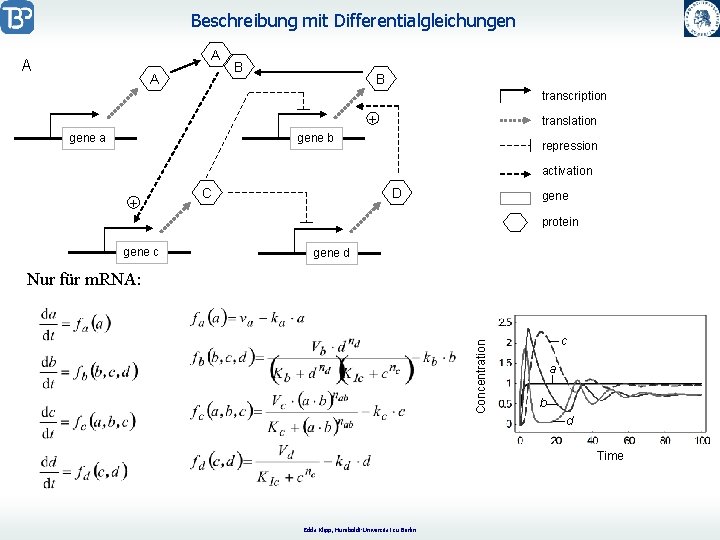
One Network, Different Models A A A B B transcription + gene a translation gene b repression activation + C D gene protein gene c Directed graphs gene d Bayesian network a b a c d p(xa) p(xb) p(xc|xa, xb), p(xd|xc), V = {a, b, c, d} E = {(a, c, +), (b, c, +), (c, b, -), (c, d, -), (d, b, +)} Boolean network b a b c d a(t+1) = a(t) b(t+1) = (not c(t)) and d(t) c(t+1) = a(t) and b(t) d(t+1) = not c(t) Edda Klipp, Humboldt-Universität zu Berlin
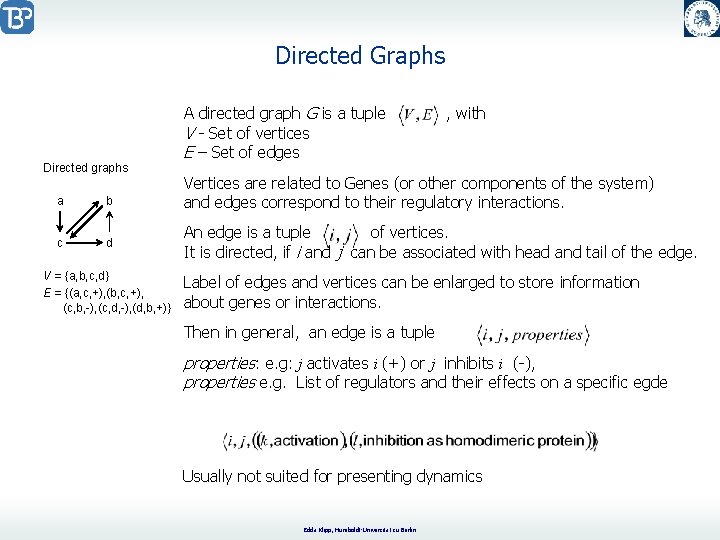
Directed Graphs A directed graph G is a tuple V - Set of vertices E – Set of edges Directed graphs a b c d V = {a, b, c, d} E = {(a, c, +), (b, c, +), (c, b, -), (c, d, -), (d, b, +)} , with Vertices are related to Genes (or other components of the system) and edges correspond to their regulatory interactions. An edge is a tuple of vertices. It is directed, if i and j can be associated with head and tail of the edge. Label of edges and vertices can be enlarged to store information about genes or interactions. Then in general, an edge is a tuple properties: e. g: j activates i (+) or j inhibits i (-), properties e. g. List of regulators and their effects on a specific egde Usually not suited for presenting dynamics Edda Klipp, Humboldt-Universität zu Berlin
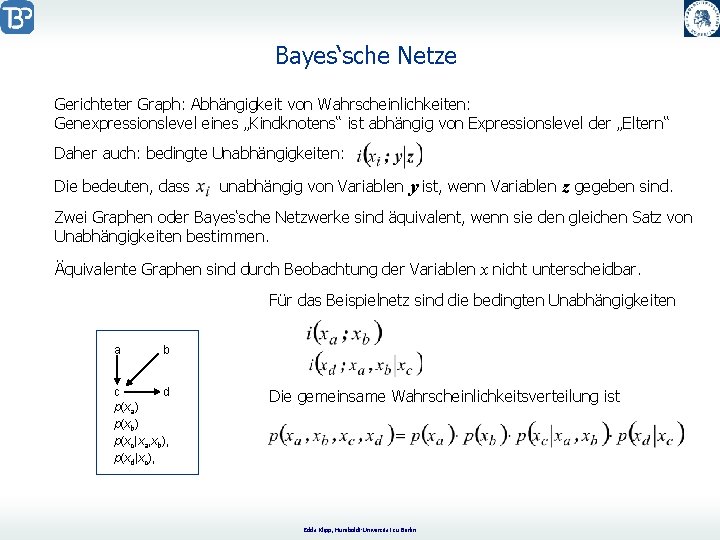
Bayesian Network Representation of network as directed acyclic graph Nodes Bayesian network a b c d p(xa) p(xb) p(xc|xa, xb), p(xd|xc), -- Genes Edges E -- regulatory interactions. Variables , belonging to nodes i = for regulation relevant properties, e. g. Gene expression leves or amount of active protein. A conditional probability distribution is defined for every with parent variables belonging to direct regulators of i. , Directed Graph G and conditional probability distribution together Yield the joint probability distribution, which defines the Bayesian network. The joint probability distribution can be decomposed to Edda Klipp, Humboldt-Universität zu Berlin
Bayes‘sche Netze Gerichteter Graph: Abhängigkeit von Wahrscheinlichkeiten: Genexpressionslevel eines „Kindknotens“ ist abhängig von Expressionslevel der „Eltern“ Daher auch: bedingte Unabhängigkeiten: Die bedeuten, dass unabhängig von Variablen y ist, wenn Variablen z gegeben sind. Zwei Graphen oder Bayes‘sche Netzwerke sind äquivalent, wenn sie den gleichen Satz von Unabhängigkeiten bestimmen. Äquivalente Graphen sind durch Beobachtung der Variablen x nicht unterscheidbar. Für das Beispielnetz sind die bedingten Unabhängigkeiten a b c d p(xa) p(xb) p(xc|xa, xb), p(xd|xc), Die gemeinsame Wahrscheinlichkeitsverteilung ist Edda Klipp, Humboldt-Universität zu Berlin
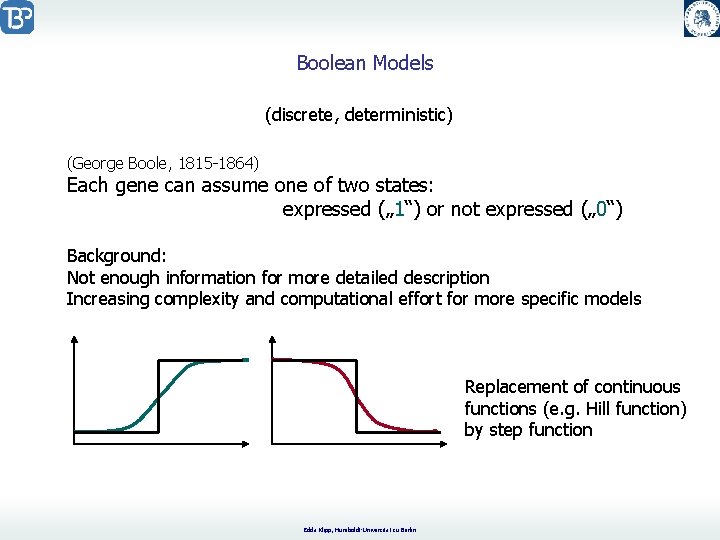
Boolean Models (discrete, deterministic) (George Boole, 1815 -1864) Each gene can assume one of two states: expressed („ 1“) or not expressed („ 0“) Background: Not enough information for more detailed description Increasing complexity and computational effort for more specific models Replacement of continuous functions (e. g. Hill function) by step function Edda Klipp, Humboldt-Universität zu Berlin
Boolean Models Boolean network is characterized by - the number of nodes („genes“): N - the number of inputs per node (regulatory interactions): k The dynamics are described by rules: „if input value/s at time t is/are. . , then output value at t+1 is. . “ Boolean network have always a finite number of possible states and, therefore, a finite number of state transitions. A A B C B D Linear chain A A Ring C D B Edda Klipp, Humboldt-Universität zu Berlin B C
Boolean Models A A Boolean network B B + gene a gene b C + D gene c gene protein c d 0000 0001 0010 0011 0100 0101 0110 0111 b(t+1) = (not c(t)) and d(t) c(t+1) = a(t) and b(t) repression activation b a(t+1) = a(t) transcription translation a 0001 0101 0000 Steady state: 0101 gene d 1000 1001 1010 1011 1100 1101 1110 1111 d(t+1) = not c(t) 1001 1101 1000 1011 1111 1010 Cycle: 1000 1001 1111 1010 1000 Edda Klipp, Humboldt-Universität zu Berlin
Beschreibung mit Differentialgleichungen A A A B B transcription + gene a translation gene b repression activation + C D gene protein gene c gene d Concentration Nur für m. RNA: c a b d Time Edda Klipp, Humboldt-Universität zu Berlin
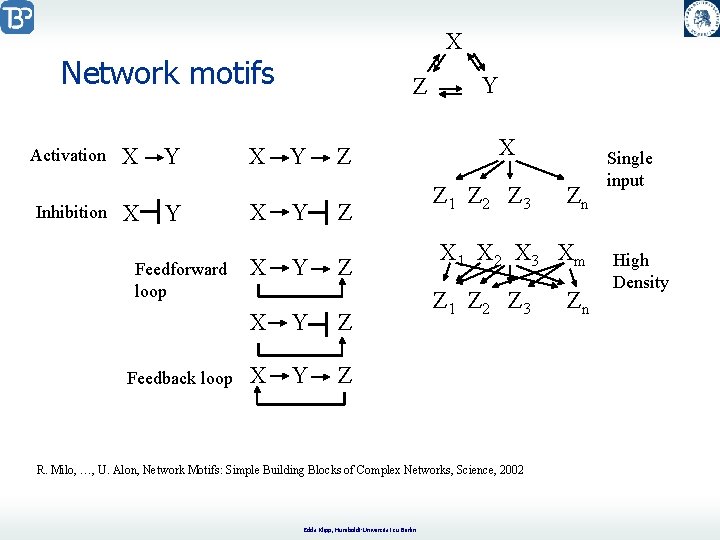
Network motifs Schematic view of network motif detection. Network motifs are patterns that recur much more frequently (A) in the real network than (B) in an ensemble of randomized networks. Each node in the randomized networks has the same number of incoming and outgoing edges as does the corresponding node in the real network. Red dashed lines indicate edges that participate in the feedforward loop motif, which occurs five times in the real network. R. Milo, …, U. Alon, Network Motifs: Simple Building Blocks of Complex Networks, Science, 2002 Edda Klipp, Humboldt-Universität zu Berlin
X Network motifs Activation Inhibition X X Y Y Feedforward loop Feedback loop X X X Z Y Y Y Z Z Z X Y Z Y X Z 1 Z 2 Z 3 X 1 X 2 X 3 Xm Z 1 Z 2 Z 3 R. Milo, …, U. Alon, Network Motifs: Simple Building Blocks of Complex Networks, Science, 2002 Edda Klipp, Humboldt-Universität zu Berlin Zn Zn Single input High Density
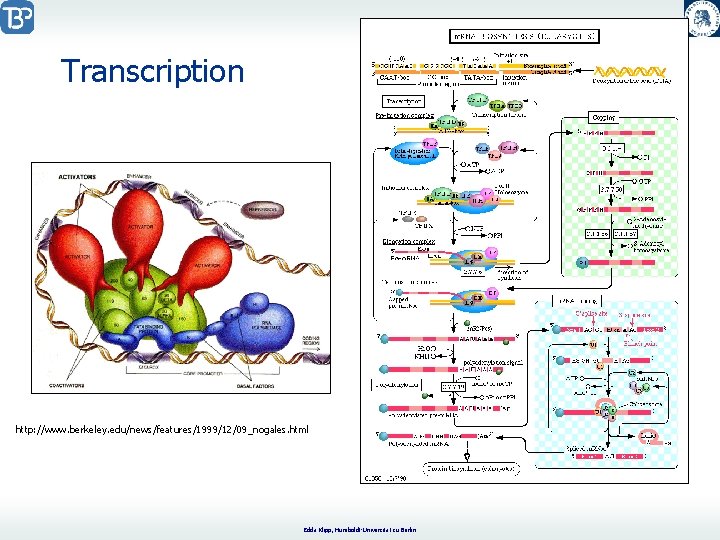
Transcription http: //www. berkeley. edu/news/features/1999/12/09_nogales. html Edda Klipp, Humboldt-Universität zu Berlin
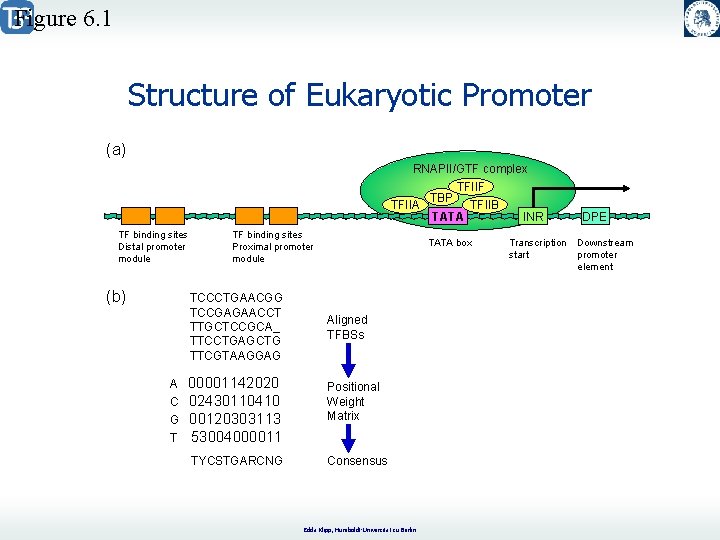
Figure 6. 1 Structure of Eukaryotic Promoter (a) RNAPII/GTF complex TFIIA TF binding sites Distal promoter module (b) TF binding sites Proximal promoter module TCCCTGAACGG TCCGAGAACCT TTGCTCCGCA_ TTCCTGAGCTG TTCGTAAGGAG A C G T 00001142020 02430110410 00120303113 53004000011 TYCSTGARCNG TBP TFIIF TATA TFIIB TATA box Aligned TFBSs Positional Weight Matrix Consensus Edda Klipp, Humboldt-Universität zu Berlin INR Transcription start DPE Downstream promoter element
Transcription . . . Edda Klipp, Humboldt-Universität zu Berlin
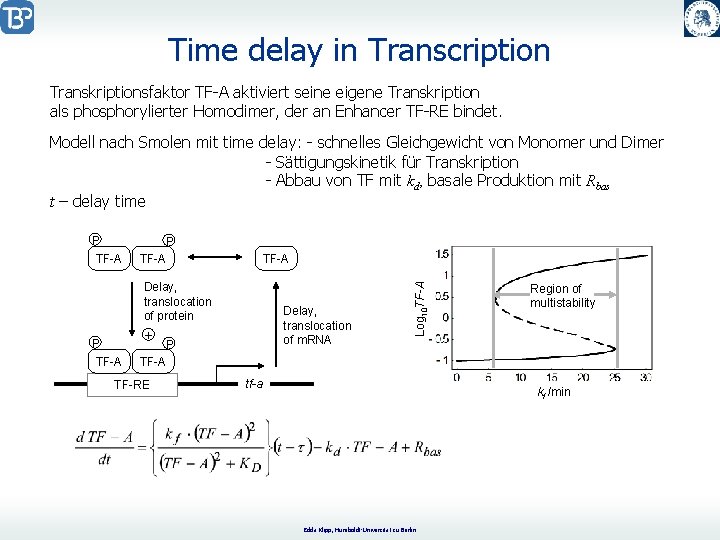
Time delay in Transcription Transkriptionsfaktor TF-A aktiviert seine eigene Transkription als phosphorylierter Homodimer, der an Enhancer TF-RE bindet. Modell nach Smolen mit time delay: - schnelles Gleichgewicht von Monomer und Dimer - Sättigungskinetik für Transkription - Abbau von TF mit kd, basale Produktion mit Rbas t – delay time P TF-A Delay, translocation of protein P TF-A Delay, translocation of m. RNA + P TF-A TF-RE Log 10 TF-A P TF-A tf-a Region of multistability kf /min Edda Klipp, Humboldt-Universität zu Berlin
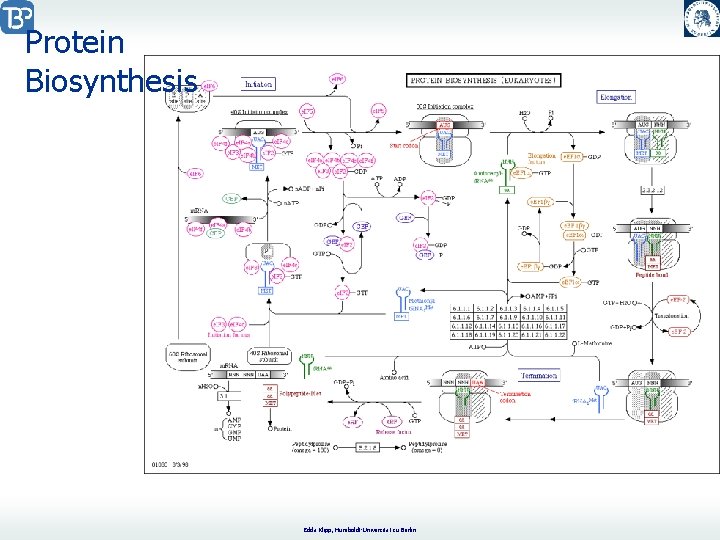
Protein Biosynthesis Edda Klipp, Humboldt-Universität zu Berlin
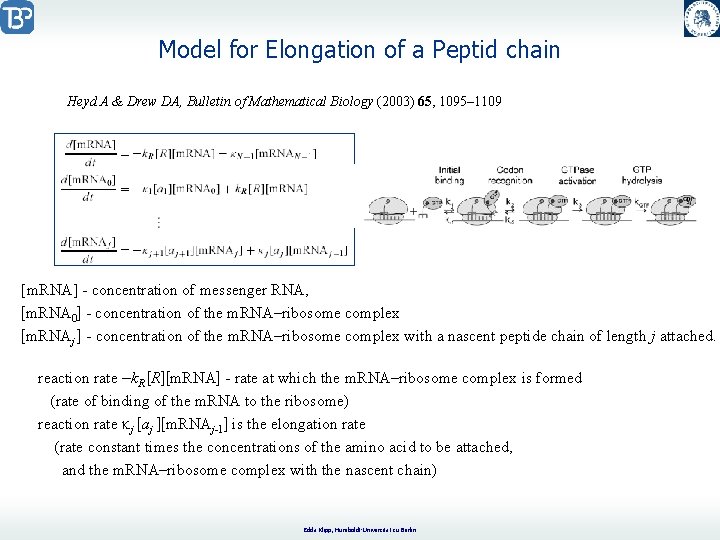
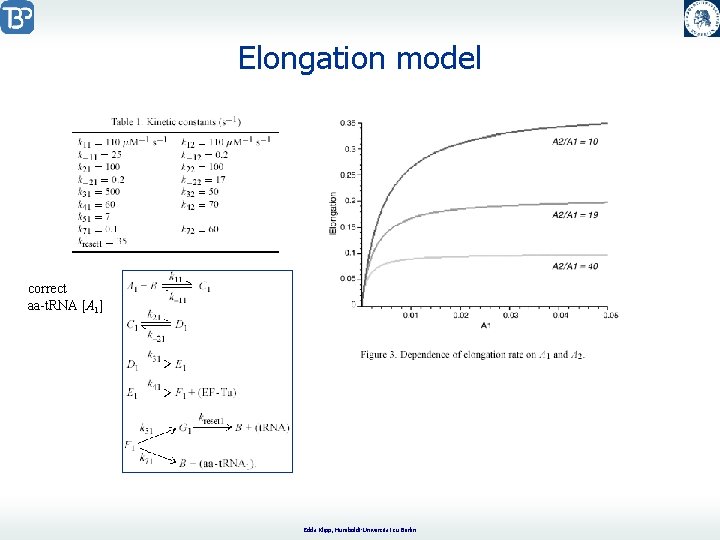
Model for Elongation of a Peptid chain Heyd A & Drew DA, Bulletin of Mathematical Biology (2003) 65, 1095– 1109 [m. RNA] - concentration of messenger RNA, [m. RNA 0] - concentration of the m. RNA–ribosome complex [m. RNAj ] - concentration of the m. RNA–ribosome complex with a nascent peptide chain of length j attached. reaction rate –k. R [R][m. RNA] - rate at which the m. RNA–ribosome complex is formed (rate of binding of the m. RNA to the ribosome) reaction rate kj [aj ][m. RNAj-1] is the elongation rate (rate constant times the concentrations of the amino acid to be attached, and the m. RNA–ribosome complex with the nascent chain) Edda Klipp, Humboldt-Universität zu Berlin
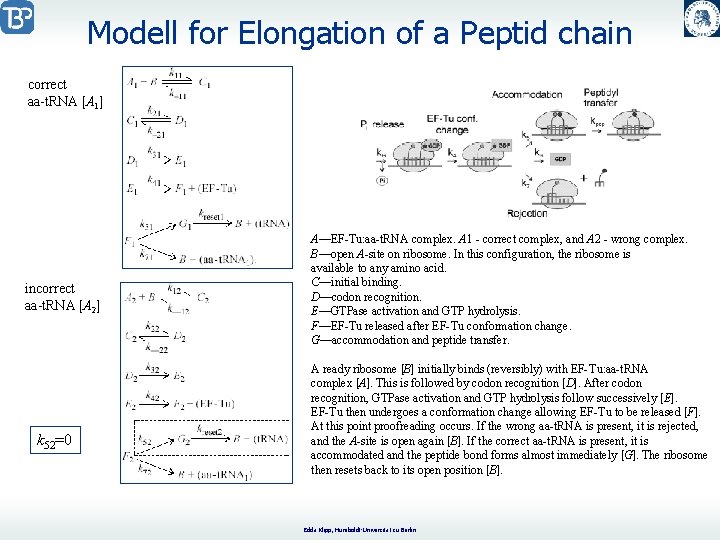
Modell for Elongation of a Peptid chain correct aa-t. RNA [A 1] incorrect aa-t. RNA [A 2] k 52=0 A—EF-Tu: aa-t. RNA complex. A 1 - correct complex, and A 2 - wrong complex. B—open A-site on ribosome. In this configuration, the ribosome is available to any amino acid. C—initial binding. D—codon recognition. E—GTPase activation and GTP hydrolysis. F—EF-Tu released after EF-Tu conformation change. G—accommodation and peptide transfer. A ready ribosome [B] initially binds (reversibly) with EF-Tu: aa-t. RNA complex [A]. This is followed by codon recognition [D]. After codon recognition, GTPase activation and GTP hydrolysis follow successively [E]. EF-Tu then undergoes a conformation change allowing EF-Tu to be released [F]. At this point proofreading occurs. If the wrong aa-t. RNA is present, it is rejected, and the A-site is open again [B]. If the correct aa-t. RNA is present, it is accommodated and the peptide bond forms almost immediately [G]. The ribosome then resets back to its open position [B]. Edda Klipp, Humboldt-Universität zu Berlin
Elongation model correct aa-t. RNA [A 1] Edda Klipp, Humboldt-Universität zu Berlin
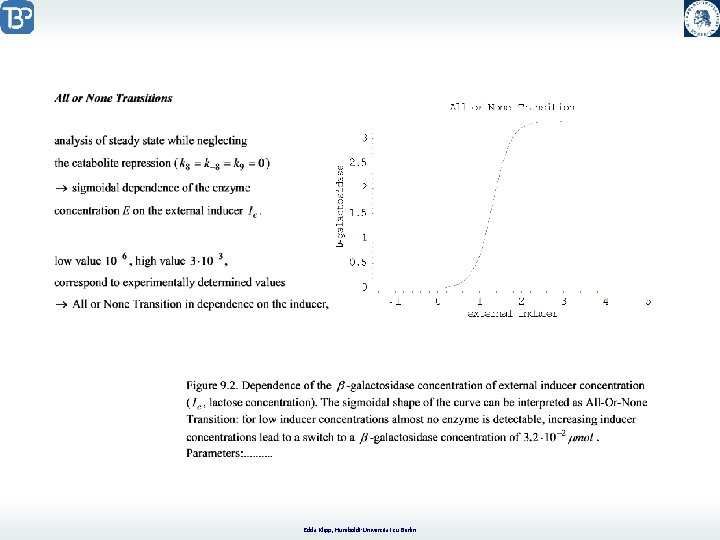
Regulation der Genexpression am Beispiel des Lac-Operons Jacob-Monod-Modell Jacob, F. & Monod, J. (1961) On the Regulation of Gene Activity, Cold Spring Harb. Symp. Quant. Biol. , 26, 193 -211. Modell of Griffith, J. S. (1971) Mathematical Neurobiology, Academic Press, London. Keener, J. & Sneyd, J. (1998) Mathematical Physiology, Springer-Verlag, New York. Nicolis-Prigogine-Modell Nicolis, G. & Prigogine, I. (1977) Self-Organization in Non-Equilibrium Systems, John Wiley & Sons, New York. Edda Klipp, Humboldt-Universität zu Berlin
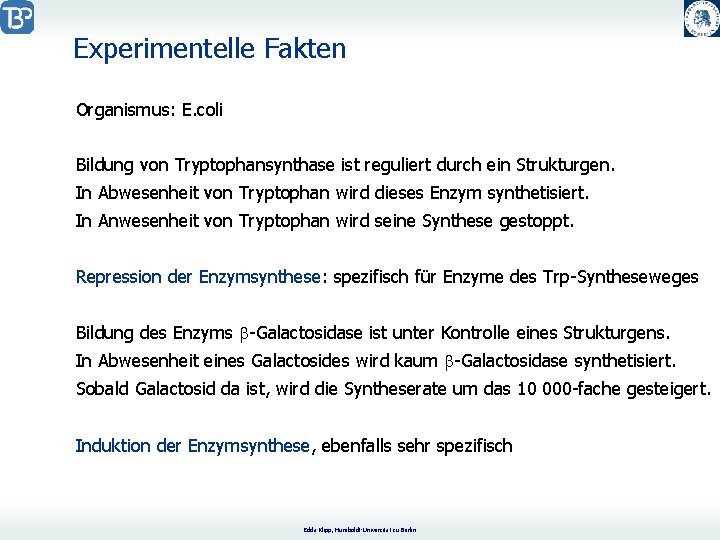
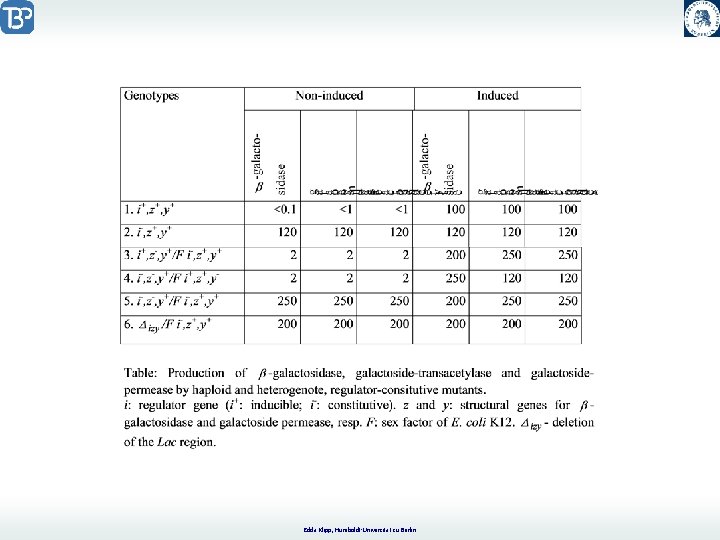
Experimentelle Fakten Organismus: E. coli Bildung von Tryptophansynthase ist reguliert durch ein Strukturgen. In Abwesenheit von Tryptophan wird dieses Enzym synthetisiert. In Anwesenheit von Tryptophan wird seine Synthese gestoppt. Repression der Enzymsynthese: spezifisch für Enzyme des Trp-Syntheseweges Bildung des Enzyms b-Galactosidase ist unter Kontrolle eines Strukturgens. In Abwesenheit eines Galactosides wird kaum b-Galactosidase synthetisiert. Sobald Galactosid da ist, wird die Syntheserate um das 10 000 -fache gesteigert. Induktion der Enzymsynthese, ebenfalls sehr spezifisch Edda Klipp, Humboldt-Universität zu Berlin
Edda Klipp, Humboldt-Universität zu Berlin
Jacob-Monod-Model Edda Klipp, Humboldt-Universität zu Berlin
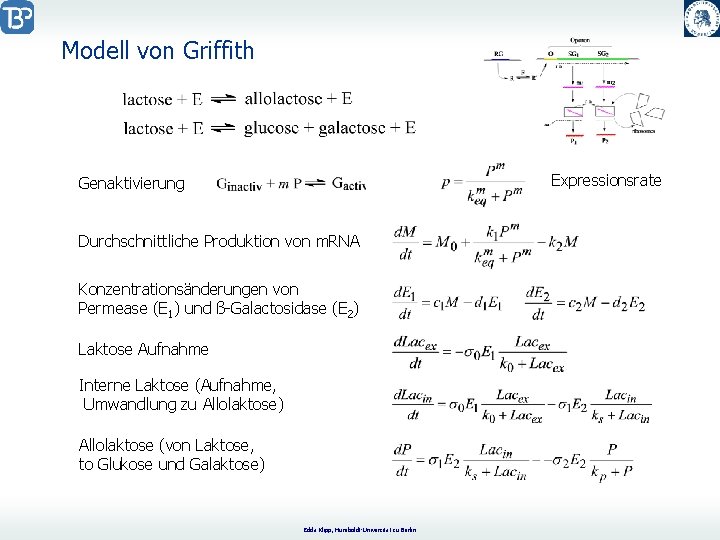
Modell von Griffith Expressionsrate Genaktivierung Durchschnittliche Produktion von m. RNA Konzentrationsänderungen von Permease (E 1) und ß-Galactosidase (E 2) Laktose Aufnahme Interne Laktose (Aufnahme, Umwandlung zu Allolaktose) Allolaktose (von Laktose, to Glukose und Galaktose) Edda Klipp, Humboldt-Universität zu Berlin
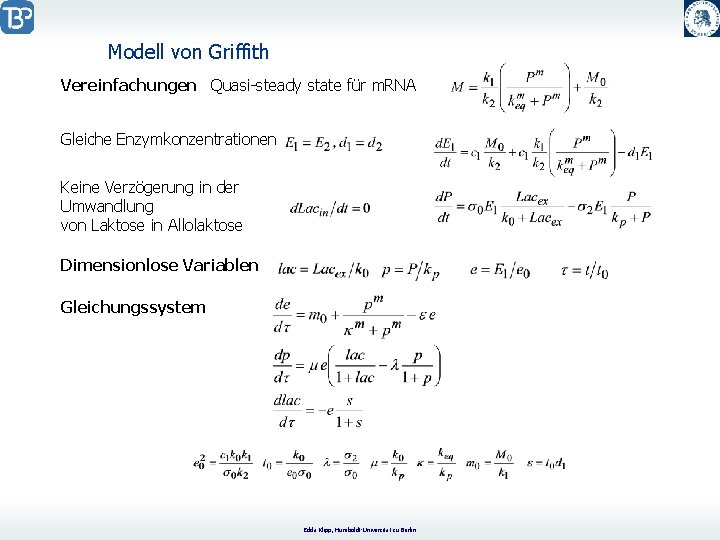
Modell von Griffith Vereinfachungen Quasi-steady state für m. RNA Gleiche Enzymkonzentrationen Keine Verzögerung in der Umwandlung von Laktose in Allolaktose Dimensionlose Variablen Gleichungssystem Edda Klipp, Humboldt-Universität zu Berlin
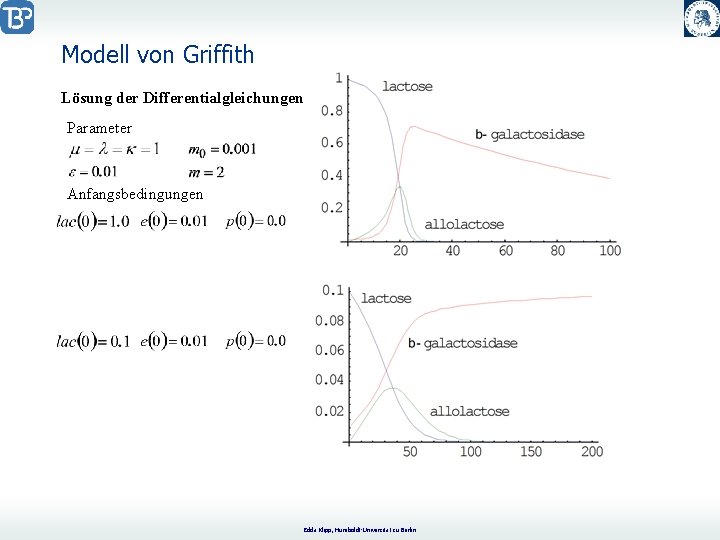
Modell von Griffith Lösung der Differentialgleichungen Parameter Anfangsbedingungen Edda Klipp, Humboldt-Universität zu Berlin
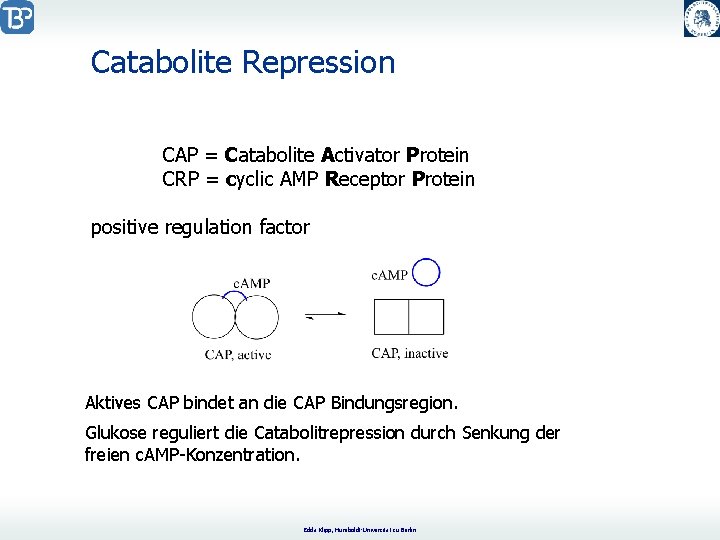
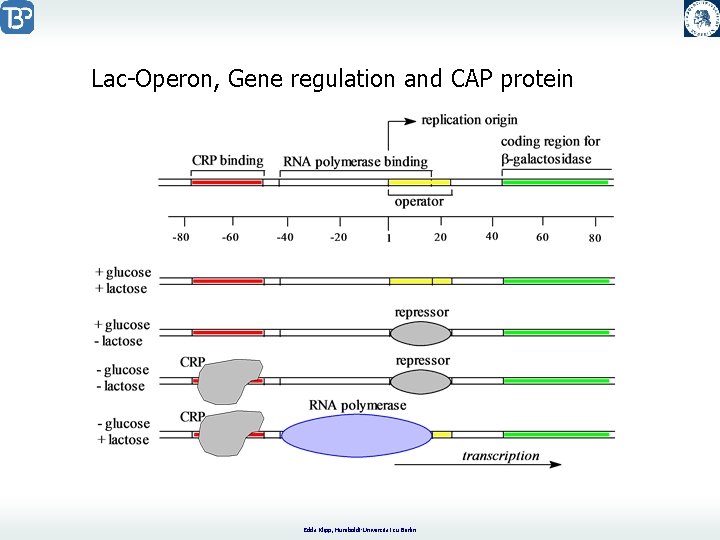
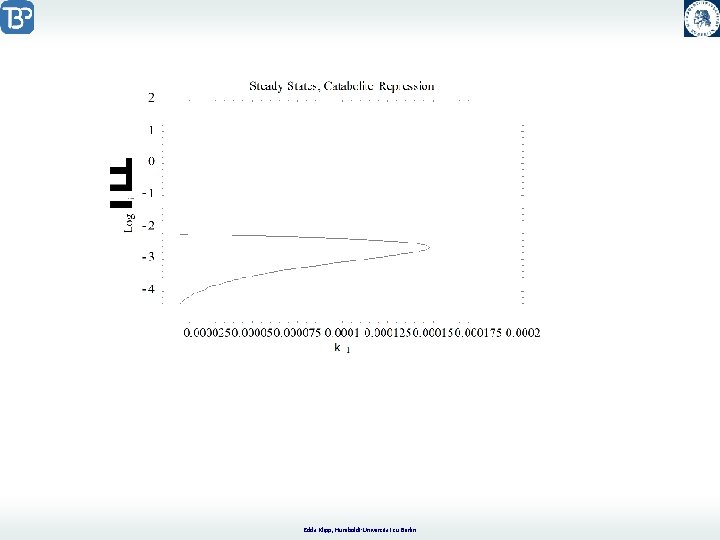
Catabolite Repression CAP = Catabolite Activator Protein CRP = cyclic AMP Receptor Protein positive regulation factor Aktives CAP bindet an die CAP Bindungsregion. Glukose reguliert die Catabolitrepression durch Senkung der freien c. AMP-Konzentration. Edda Klipp, Humboldt-Universität zu Berlin
Lac-Operon, Gene regulation and CAP protein Edda Klipp, Humboldt-Universität zu Berlin
Edda Klipp, Humboldt-Universität zu Berlin
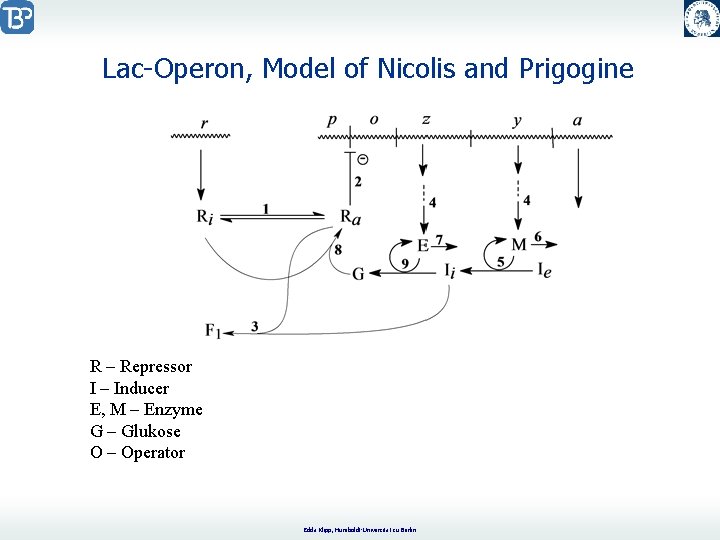
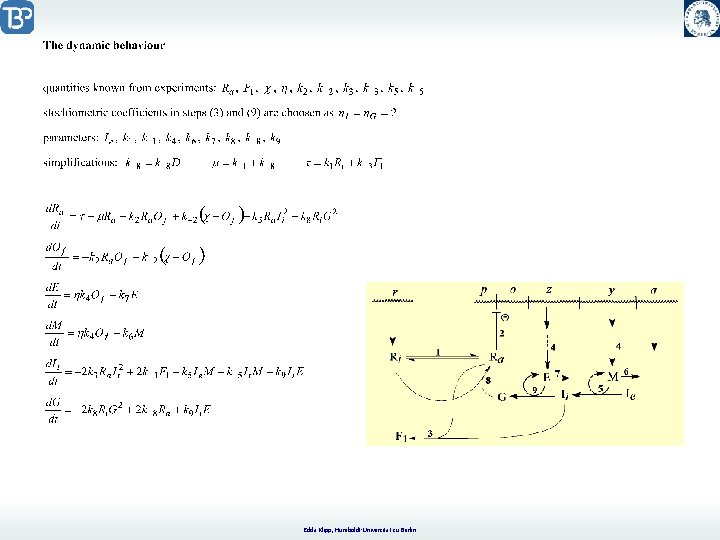
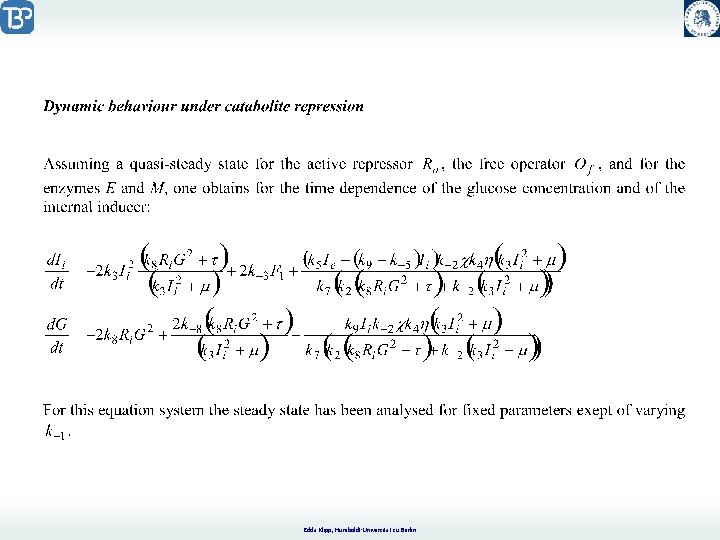
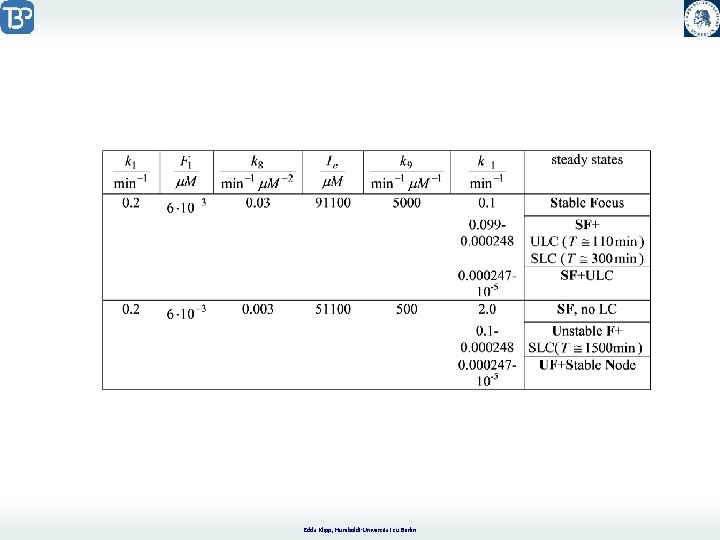
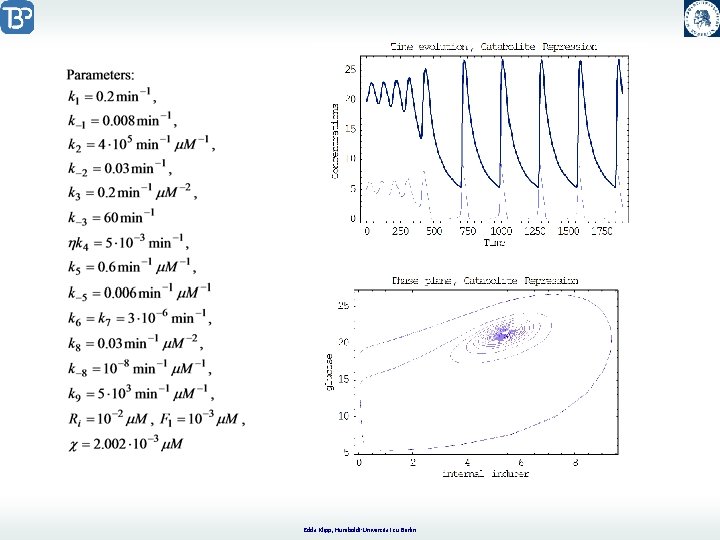
Lac-Operon, Model of Nicolis and Prigogine R – Repressor I – Inducer E, M – Enzyme G – Glukose O – Operator Edda Klipp, Humboldt-Universität zu Berlin
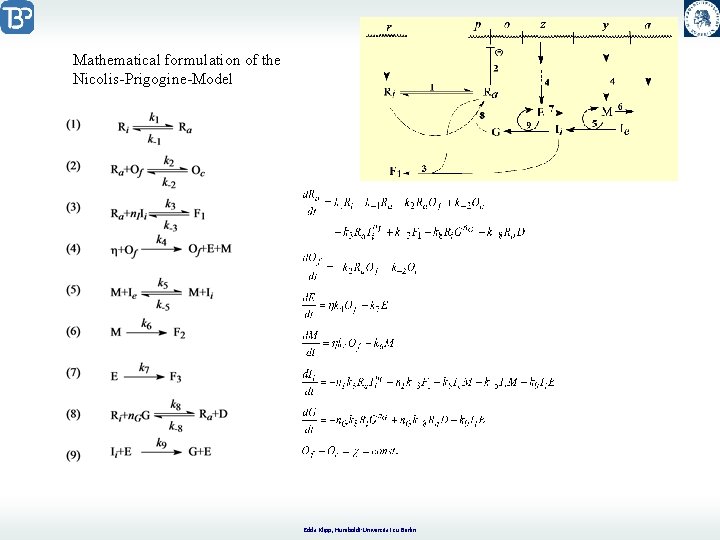
Mathematical formulation of the Nicolis-Prigogine-Model Edda Klipp, Humboldt-Universität zu Berlin
Edda Klipp, Humboldt-Universität zu Berlin
Edda Klipp, Humboldt-Universität zu Berlin
Edda Klipp, Humboldt-Universität zu Berlin
Edda Klipp, Humboldt-Universität zu Berlin
Edda Klipp, Humboldt-Universität zu Berlin
Edda Klipp, Humboldt-Universität zu Berlin
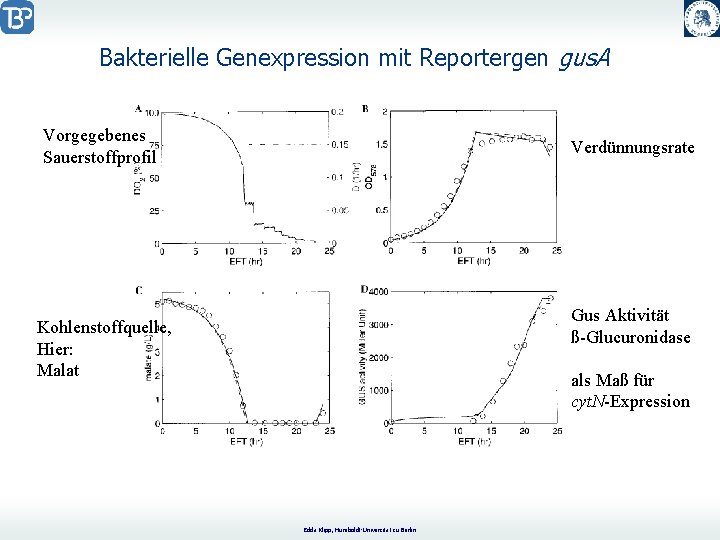
Bakterielle Genexpression mit Reportergen gus. A Quantifizierung der Regulation der Genexpression durch ein externes Signal, O 2 Operon cyt. NOQP von A. brasilense codiert eine Cytochrome cbb 3 Oxidase, die bei Wachstum und Atmung eine Rolle spielt. Die Expression ist abhängig vom Sauerstoffgehalt. Die Expression von cyt. N wurde mittels der Fusion von cyt. N-gus. A gemessen. Modell X – Biomasse-Konzentration S – Konzentration der Kohlenhydratquelle Sin – Konz. der zugefütterten Kohlenhydrate P – Konzentration des Fusionsproteins D – Verdünnungsrate µ - spezifische Wachstumsrate s – spezifische Kohlenstoffverbrauchsrate p – spezifische Expressionsrate des Fusionsproteins k – Abbaurate des Fusionsproteins Edda Klipp, Humboldt-Universität zu Berlin
Bakterielle Genexpression mit Reportergen gus. A Vorgegebenes Sauerstoffprofil Verdünnungsrate Gus Aktivität ß-Glucuronidase Kohlenstoffquelle, Hier: Malat als Maß für cyt. N-Expression Edda Klipp, Humboldt-Universität zu Berlin