ModelBased Monitoring for Papyrus RT Supervised By Dr
Model-Based Monitoring for Papyrus. RT Supervised By: Dr. Juergen Dingel Suchita Ganesan, Laith “Leo” Juwaidah, Nondini Das Nicolas Hili, Reza Ahmadi 5/5/2016 1
Outline • • Monitoring time constraints Research project goals Implementation details Demo Challenges and solutions Vision (Nicolas) Model based animation and interaction (Nicolas) Model based debugging (Reza) 5/5/2016 2
UML-RT and Papyrus. RT 5/5/2016 3
Why UML-RT? • Real time systems are huge and complex • Convenient for communicating design concepts • UML-RT is a profile of UML for real-time embedded systems • Supports encapsulation and reuse 5/5/2016 4
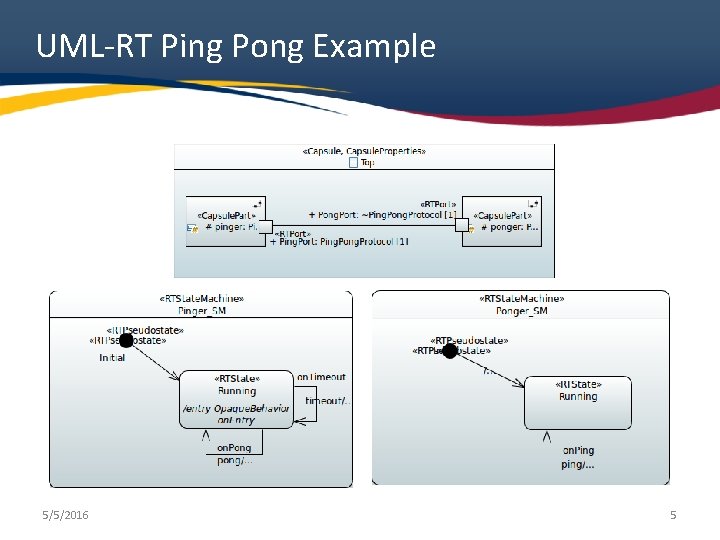
UML-RT Ping Pong Example 5/5/2016 5
Papyrus. RT • Real-time variation of Papyrus • Open source Eclipse plugin • UML-RT 5/5/2016 6

Research Project Goals 5/5/2016 7
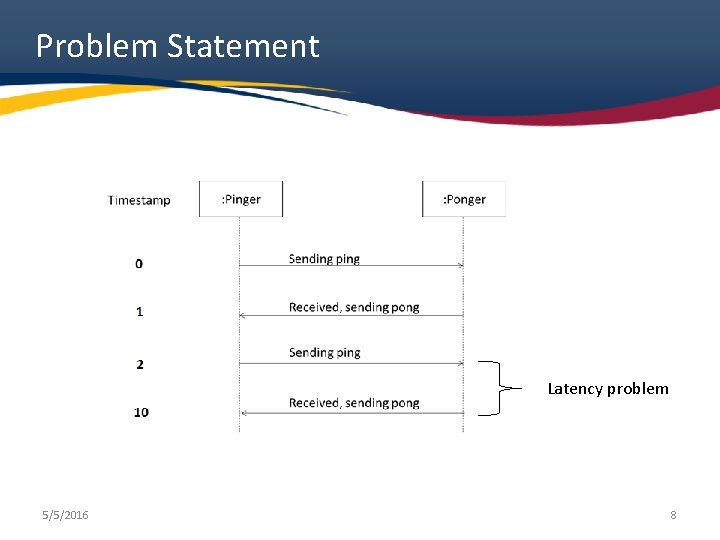
Problem Statement Latency problem 5/5/2016 8
Solution • Monitoring the generated code can be used for: Ø Model debugging Ø Model refinement Ø Runtime verification Ø Monitoring performance 5/5/2016 9
Implementation Overview Monitoring UI Code Generation Trace Collection & Display 5/5/2016 10
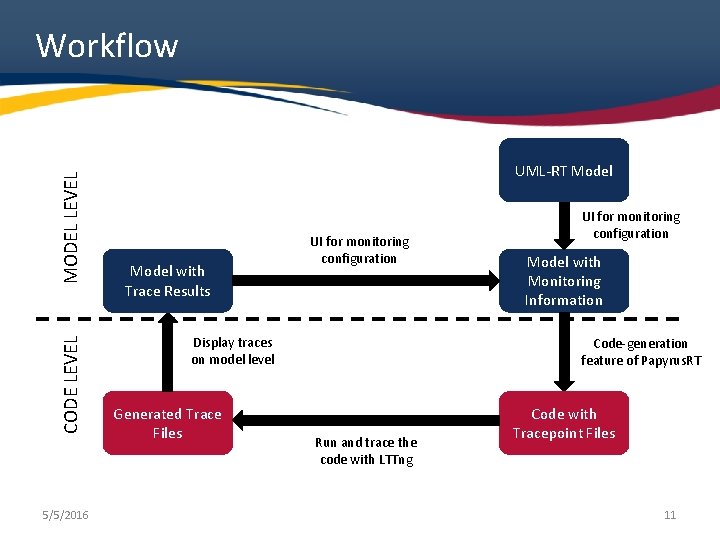
CODE LEVEL MODEL LEVEL Workflow 5/5/2016 UML-RT Model with Trace Results UI for monitoring configuration Display traces on model level Generated Trace Files UI for monitoring configuration Model with Monitoring Information Code-generation feature of Papyrus. RT Run and trace the code with LTTng Code with Tracepoint Files 11
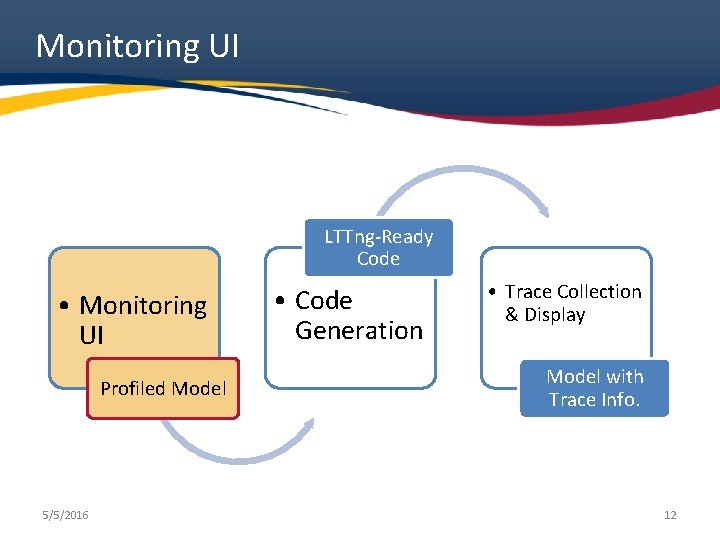
Monitoring UI LTTng-Ready Code • Monitoring UI Profiled Model 5/5/2016 • Code Generation • Trace Collection & Display Model with Trace Info. 12
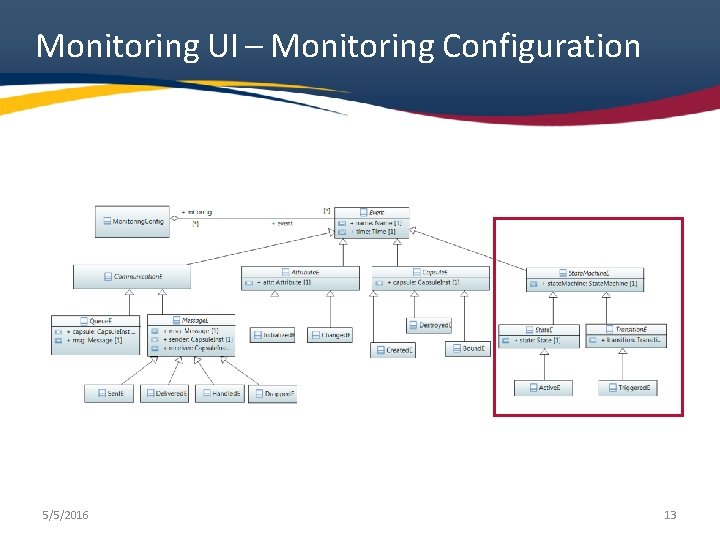
Monitoring UI – Monitoring Configuration 5/5/2016 13
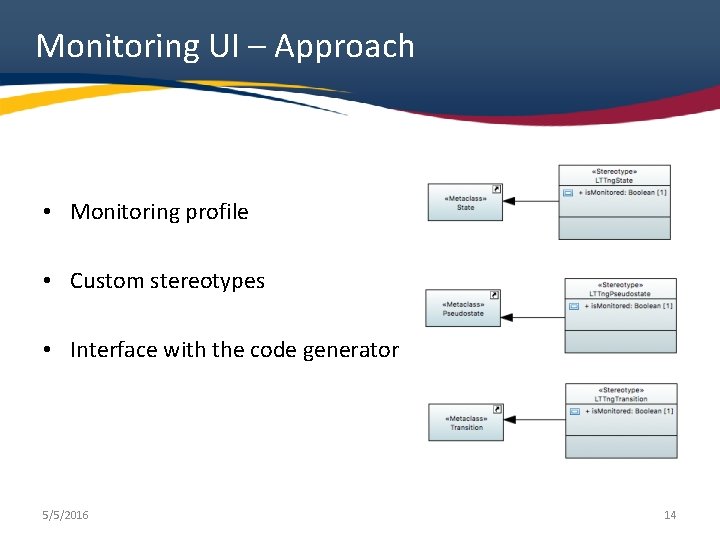
Monitoring UI – Approach • Monitoring profile • Custom stereotypes • Interface with the code generator 5/5/2016 14
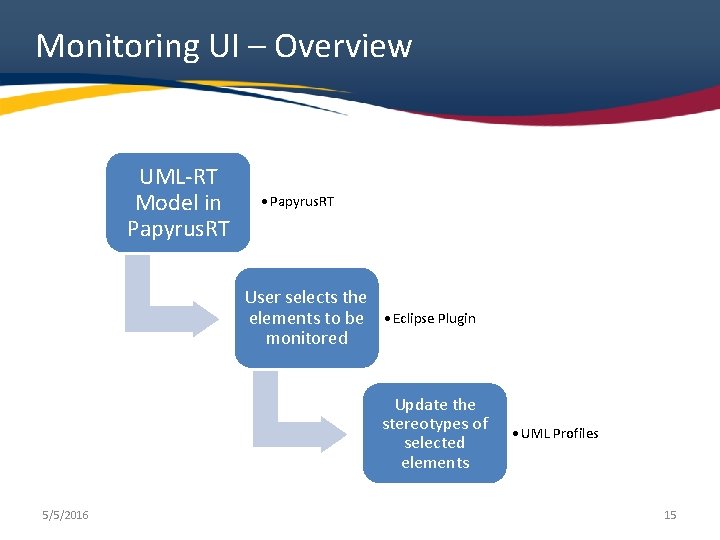
Monitoring UI – Overview UML-RT Model in Papyrus. RT • Papyrus. RT User selects the elements to be • Eclipse Plugin monitored Update the stereotypes of selected elements 5/5/2016 • UML Profiles 15
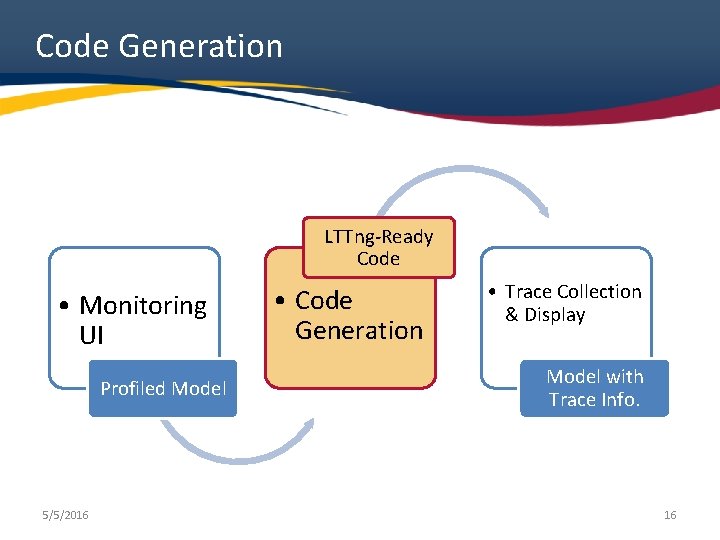
Code Generation LTTng-Ready Code • Monitoring UI Profiled Model 5/5/2016 • Code Generation • Trace Collection & Display Model with Trace Info. 16
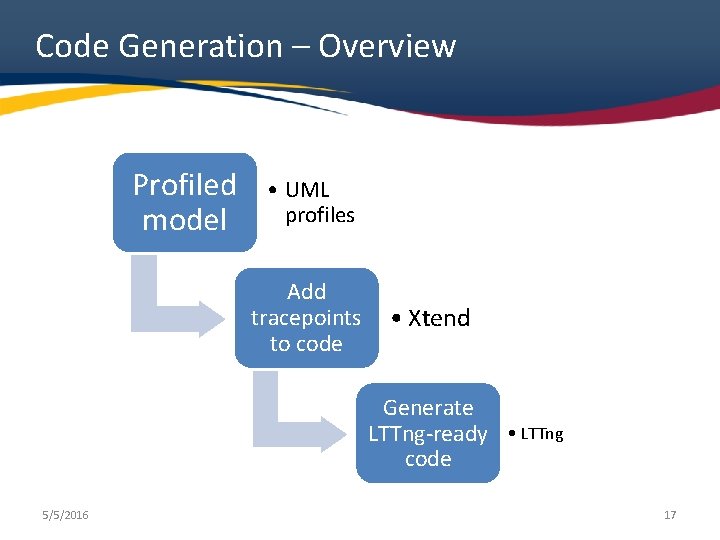
Code Generation – Overview Profiled model • UML profiles Add tracepoints to code • Xtend Generate LTTng-ready code 5/5/2016 • LTTng 17
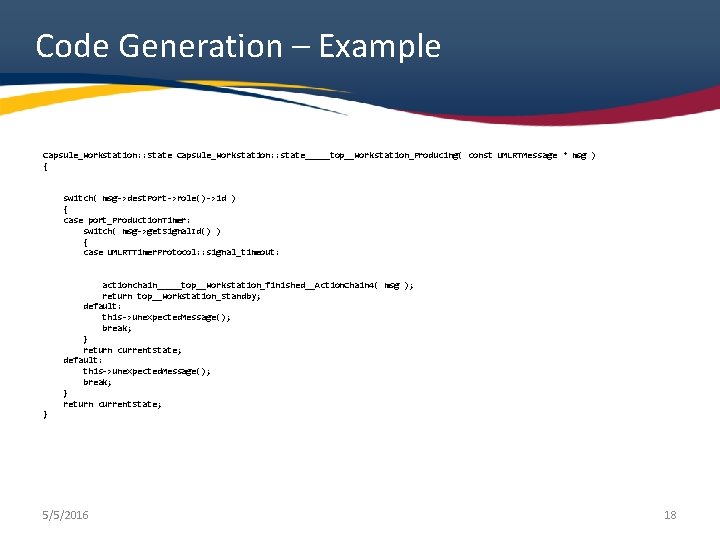
Code Generation – Example Capsule_Workstation: : State Capsule_Workstation: : state_____top__Workstation_Producing( const UMLRTMessage * msg ) { tracepoint( Active. State__Workstation_Producing_provider, Active. State__Workstation_Producing_tracepoint, "Active. State__Workstation_Producing" ); switch( msg->dest. Port->role()->id ) { case port_Production. Timer: switch( msg->get. Signal. Id() ) { case UMLRTTimer. Protocol: : signal_timeout: tracepoint( Message. Received__Workstation__ Workstation_finished_provider, Message. Received__Workstation_finished_tracepoint, "Message. Received__Workstation_finished" ); actionchain_____top__Workstation_finished__Action. Chain 4( msg ); return top__Workstation_Standby; default: this->unexpected. Message(); break; } return current. State; } 5/5/2016 18
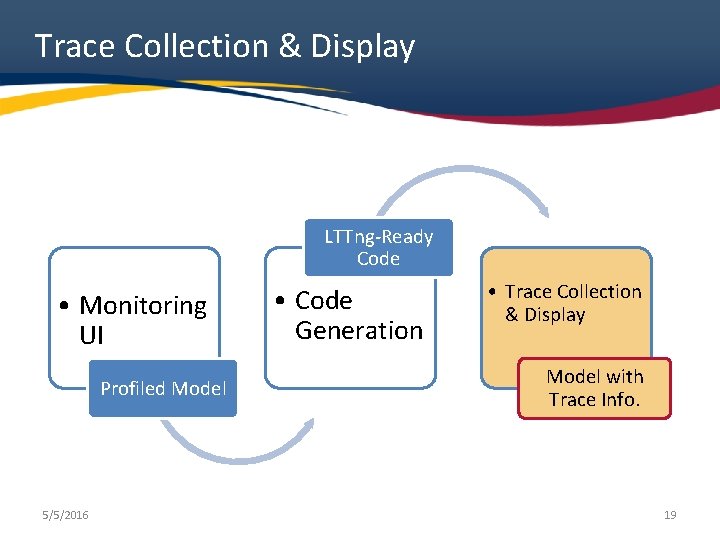
Trace Collection & Display LTTng-Ready Code • Monitoring UI Profiled Model 5/5/2016 • Code Generation • Trace Collection & Display Model with Trace Info. 19
Trace Collection & Display - Goals • Monitor generated code • Collect the monitoring information • Display the traces on the model 5/5/2016 20
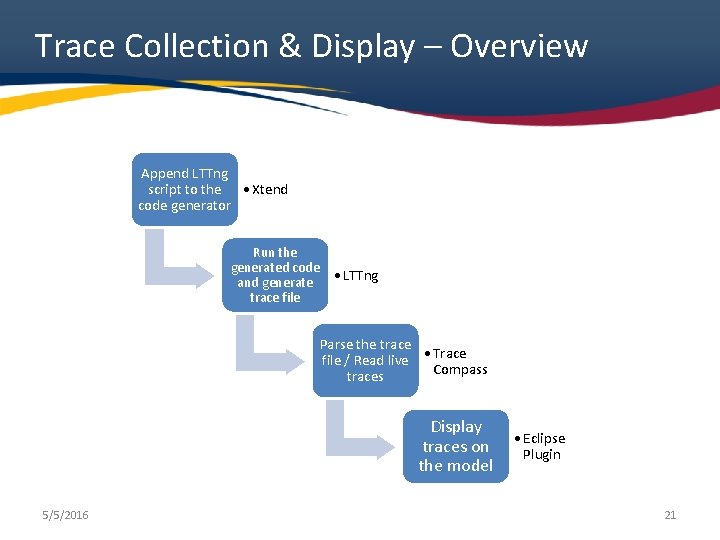
Trace Collection & Display – Overview Append LTTng script to the • Xtend code generator Run the generated code and generate • LTTng trace file Parse the trace • Trace file / Read live Compass traces Display traces on the model 5/5/2016 • Eclipse Plugin 21
Demo 5/5/2016 22
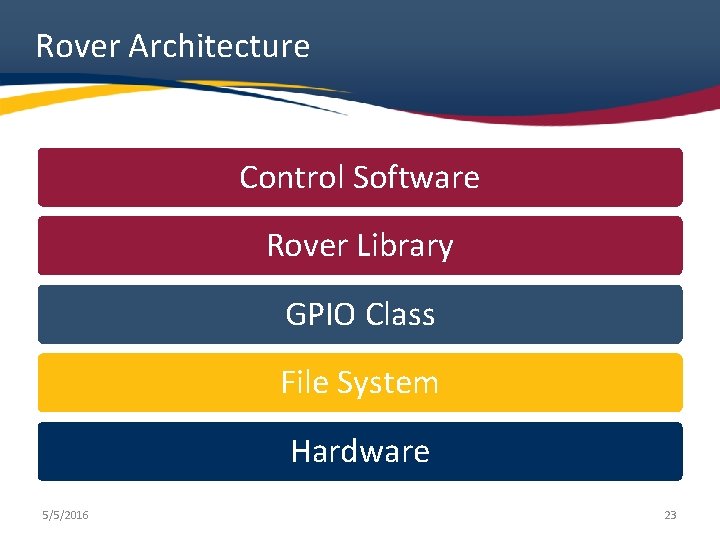
Rover Architecture Control Software Rover Library GPIO Class File System Hardware 5/5/2016 23
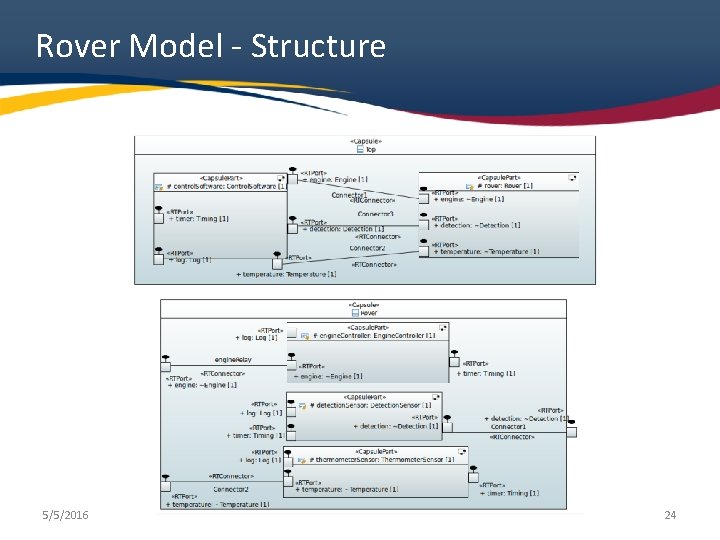
Rover Model - Structure 5/5/2016 24
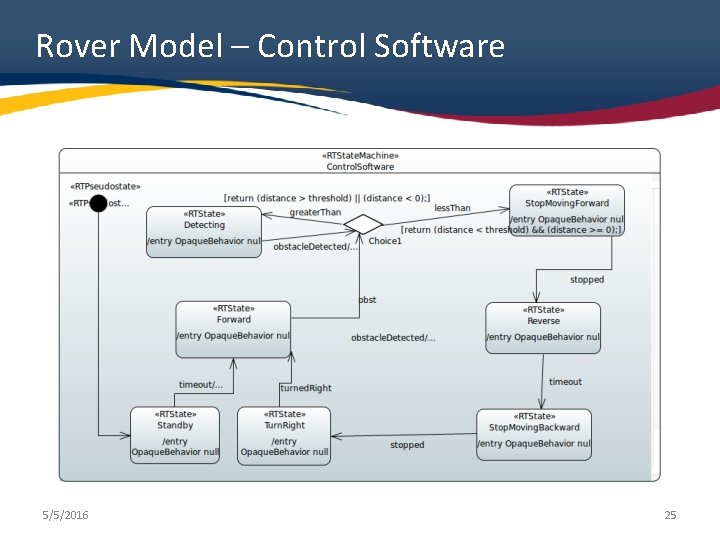
Rover Model – Control Software 5/5/2016 25
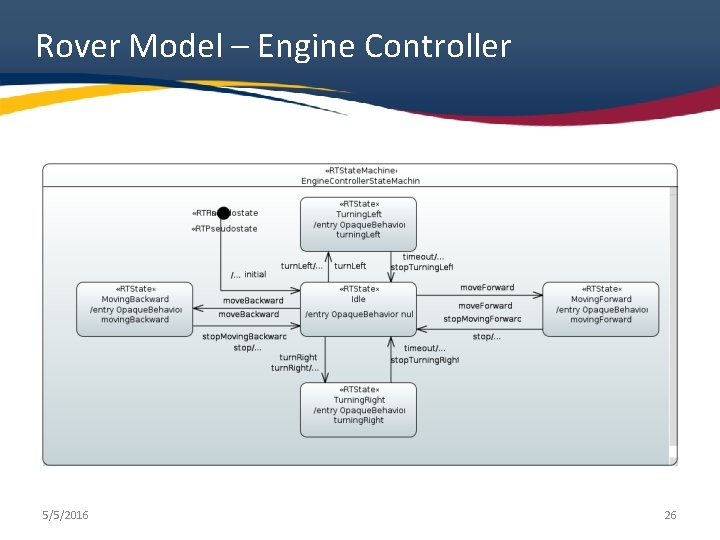
Rover Model – Engine Controller 5/5/2016 26
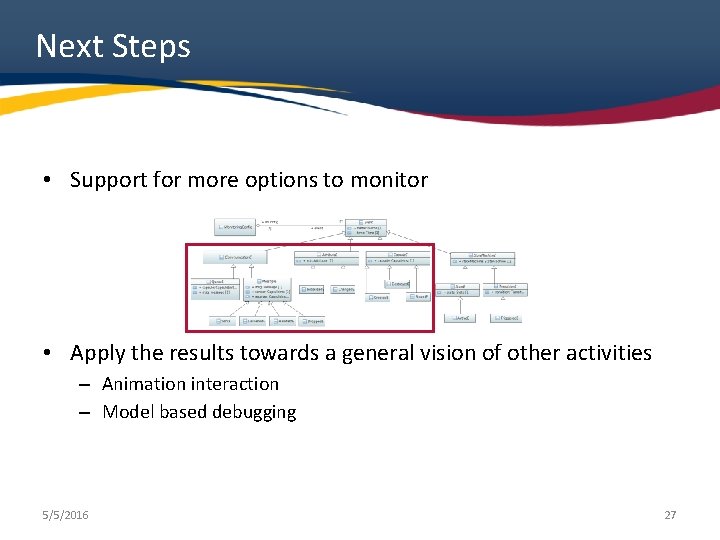
Next Steps • Support for more options to monitor • Apply the results towards a general vision of other activities – Animation interaction – Model based debugging 5/5/2016 27

5/5/2016 28
- Slides: 28