MODEL SELECTION 36103 Statistical Thinking for Data Science


 houses<-read. csv(\"Houses. csv\") summary(houses) head(houses) ## Price Floor Block")


 can be used")
, direction=\"forward\")")
 #")
,")


- Slides: 21
MODEL SELECTION 36103 Statistical Thinking for Data Science By Mahrita Harahap
How many response variables? What type of response variable? How many predictor variables? What type of predictor? Continuous Simple Linear Regression Categorical One Way ANOVA Any Multiple Regression Continuous Logistic Regression Categorical Pearson Chi Square or Likelihood Ratio Categorical Loglinear Analysis Continuous or Both Categorical and Continuous Multinomial Regression Any type Poisson Model One Continuous Two or more One Categorical Two or more Counts of events Any amount Assuming data meets assumptions for parametric tests
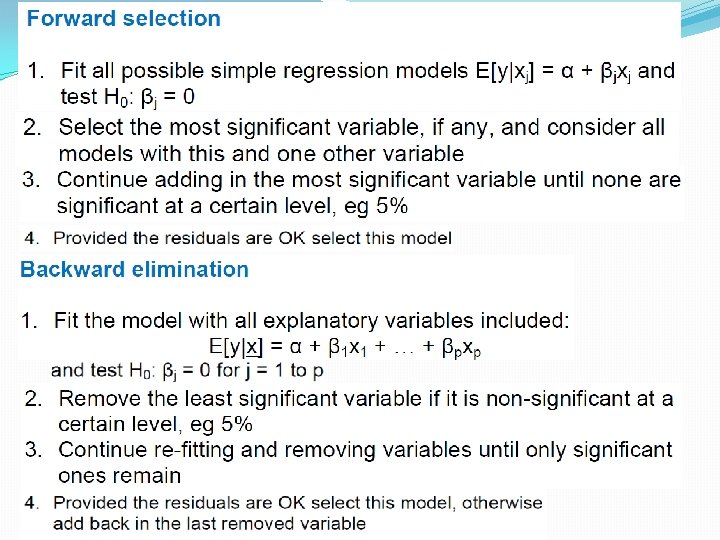
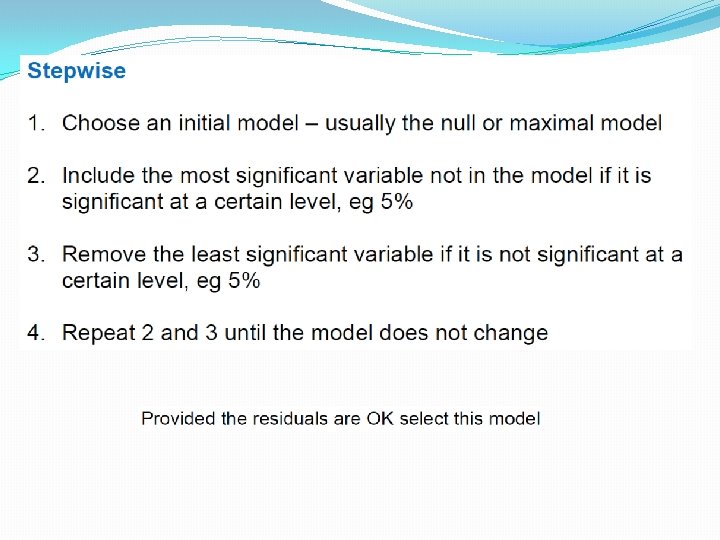
Model Selection �Given the data set with many potential explanatory variables we need to decide which ones to include in out model and which ones to leave out. �Possible procedures include: �All possible models (best subsets) �Forward Selection �Backward Elimination �Stepwise Selection
Multicollinearity � With multiple regression, we are often adding variables that are themselves partially related to each other. This becomes a problem when a combination of variables become close to collinear: if some of the predictor variables are (highly) correlated we say that multicollinearity exists WHY IS MULTICOLLINEARITY A PROBLEM: � If two (or more) variables are collinear we cannot interpret the parameter as the relationship between one x variable and y holding ALL the other x¡’s constant: � Can get negative relationships when they should be positive. � Adding highly collinear variables inflates the standard error on the parameter estimates. This can lead to make individual variables look non-significant. � Variance Inflation Factor: The VIF measures how much the variance of an estimated regression coefficient is inflated because of collinearity. Typically concerned if any of the Variance Inflation Factor’s are above 10.
Exploratory Data Analysis setwd(…. ) houses<-read. csv("Houses. csv") summary(houses) head(houses) ## Price Floor Block Rooms Age Central. Heating ## 1 52. 00 111 830 5 6. 2 no ## 2 54. 75 128 710 5 7. 5 no install. packages("corrplot") library(corrplot) Correlation<-round(cor(houses[, c(1, 2, 3, 4, 5)]), 2) corrplot(Correlation, method="ellipse") corrplot(Correlation, method="number") library(car) scatterplot. Matrix(~Price+Floor+Block+Rooms+Age+Central. Heating, da ta=houses)
Correlation Plot
Matrix Plot
All possible regressions – Best Subsets � To consider all possible models is time consuming unless there are only a small number of models because there are 2 p possible linear regression models and we require procedures for choosing one (or a small number) of them. � Still difficult to choose “best” model as lots of test results will be available giving conflicting information. � Can select the best models based on Adjusted R 2, Mallows Cp, AIC or BIC. � Adjusted R 2 is used instead of R 2 because penalises for the number of parameters and sample size. � Usually too many to manually consider all models so need an automatic system for deciding which models to consider and in which order. Better to use a logical procedure like forward selection, backward elimination or stepwise, where each test is acted upon sequentially and do not ignore any ‘substantive theory’.
All possible regressions – Best Subsets � You can perform best subsets (all possible regressions) using the leaps() function from the leaps package. In the following code nbest indicates the number of subsets of each size to report. Here, the ten best models will be reported for each subset size (1 predictor, 2 predictors, etc. ). � Other options for plot( ) are BIC, Cp, and Adj R 2. Other options for plotting with subset( ) are BIC, Cp, Adj R 2, and RSS. This video https: //www. youtube. com/watch? v=Lkif. E 44 my. Lc goes through those the measures in depth. install. packages("leaps") library(leaps) leaps<-regsubsets(Price~Floor+Block+Rooms+Age+Central. Heating, data=houses, nbest=10) leaps plot(leaps, scale="adjr 2") plot(leaps, scale="bic") Plot(leaps, scale=“Cp”)
All possible regressions – Best Subsets Here black indicates that a variable is included in the model, while white indicates that they are not. Looking at the values on the y-axis of the plot indicates that the top four models have roughly the same adjusted Rsquare. Automatic methods are useful when the number of explanatory variables is large and it is not feasible to fit all possible models. In this case, it is more efficient to use a search algorithm (e. g. , Forward selection, Backward elimination and Stepwise regression) to find the best model.
Automatic Methods – forward, backward, stepwise � The R function step() can be used to perform variable selection. To perform forward selection we need to begin by specifying a starting model and the range of models which we want to examine in the search. attach(houses) # null model null<-lm(Price~1, data=houses) Null Call: lm(formula = Price ~ 1, data = houses) Coefficients: (Intercept) 71. 56 # full model full<-lm(Price~. , data=houses) Full Call: lm(formula = Price ~. , data = houses) Coefficients: (Intercept) 18. 251533 Age -1. 884105 detach(houses) Floor 0. 166485 Central. Heatingyes 6. 399189 Block -0. 002324 Rooms 6. 176126
Variable Selection – Forward Selection # Forward Selection Method > step(null, scope=list(lower=null, upper=full), direction="forward") # Final Model selected Step: AIC=58. 75 Price ~ Floor + Age + Rooms + Central. Heating Df Sum of Sq RSS AIC <none> 228. 88 58. 749 + Block 1 0. 81331 228. 06 60. 678 Call: lm(formula = Price ~ Floor + Age + Rooms + Central. Heating, data = houses) Coefficients: (Intercept) Floor Age Rooms 15. 9814 0. 1622 -1. 8479 6. 3253 Central. Heatingyes 6. 3502
Variable Selection – Backward Selection # Backward Elimination Method > step(full, data=houses, direction="backward") # Final Model selected Step: AIC=58. 75 Price ~ Floor + Rooms + Age + Central. Heating Df Sum of Sq <none> - Floor - Central. Heating - Rooms - Age 1 1 85. 47 115. 80 155. 11 324. 12 RSS 228. 88 314. 35 344. 68 383. 99 553. 00 AIC 58. 749 63. 095 64. 938 67. 098 74. 393 Call: lm(formula = Price ~ Floor + Rooms + Age + Central. Heating, data = houses) Coefficients: (Intercept) 15. 9814 Central. Heatingyes 6. 3502 Floor 0. 1622 Rooms 6. 3253 Age -1. 8479
Variable Selection – Stepwise Selection # Stepwise Selection Method > step(null, scope = list(upper=full), data=houses, direction="both") # Final model selected Step: AIC=58. 75 Price ~ Floor + Age + Rooms + Central. Heating Df Sum of Sq <none> + Block - Floor - Central. Heating - Rooms - Age 1 1 1 0. 81 85. 47 115. 80 155. 11 324. 12 RSS 228. 88 228. 07 314. 35 344. 68 383. 99 553. 00 AIC 58. 749 60. 678 63. 095 64. 938 67. 098 74. 393 Call: lm(formula = Price ~ Floor + Age + Rooms + Central. Heating, data = houses) Coefficients: (Intercept) 15. 9814 Central. Heatingyes 6. 3502 Floor 0. 1622 Age -1. 8479 Rooms 6. 3253
Based on these outputs, which model would you select? (remember to look at the residual analysis on the final selected model to see the validity of the model)
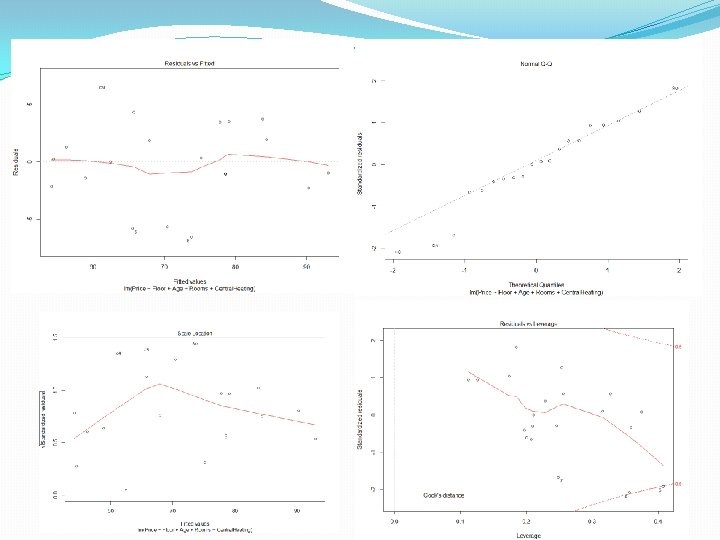
Looks like all 4 procedures selected this model: Price ~ Floor + Age + Rooms + Central. Heating So we will fit this model in R and analyse it’s residual plots to see the validity of the model. > fit<-lm(Price~Floor+Age+Rooms+Central. Heating, data=houses) > summary(fit) Call: lm(formula = Price ~ Floor + Age + Rooms + Central. Heating, data = houses) Residuals: Min 1 Q Median 3 Q Max -6. 5211 -1. 6048 0. 1236 2. 2921 6. 4283 Coefficients: Estimate Std. Error t value Pr(>|t|) (Intercept) 15. 98136 7. 67135 2. 083 0. 054751. Floor 0. 16221 0. 06854 2. 367 0. 031827 * Age -1. 84790 0. 40094 -4. 609 0. 000341 *** Rooms 6. 32527 1. 98387 3. 188 0. 006108 ** Central. Heatingyes 6. 35019 2. 30507 2. 755 0. 014741 * --Signif. codes: 0 ‘***’ 0. 001 ‘**’ 0. 01 ‘*’ 0. 05 ‘. ’ 0. 1 ‘ ’ 1 Residual standard error: 3. 906 on 15 degrees of freedom Multiple R-squared: 0. 919, Adjusted R-squared: 0. 8974 F-statistic: 42. 57 on 4 and 15 DF, p-value: 5. 123 e-08 > plot(fit)
References: www. stat. columbia. edu/~martin/W 2024/R 10. pdf http: //www. statmethods. net/stats/regression. html https: //stat. ethz. ch/R-manual/Rdevel/library/stats/html/step. html Linear Model Selection and Best Subset Selection (13: 44) � Forward Stepwise Selection (12: 26) � Backward Stepwise Selection (5: 26) � Estimating Test Error Using Mallow's Cp, AIC, BIC, Adjusted Rsquared (14: 06) � Estimating Test Error Using Cross-Validation (8: 43)