
Model Quality Concepts Statistics Swanand Gore Gerard Kleywegt

- Slides: 55
Model Quality: Concepts & Statistics Swanand Gore & Gerard Kleywegt PDBe – EBI May 6 th 2010, 10: 30 -11: 30 am Macromolecular Crystallography Course
Outline • Science, experiments, errors, validation • Features of a refined crystallographic model useful for quality checking • Model quality checks – Only data – Model coordinates – Model + data
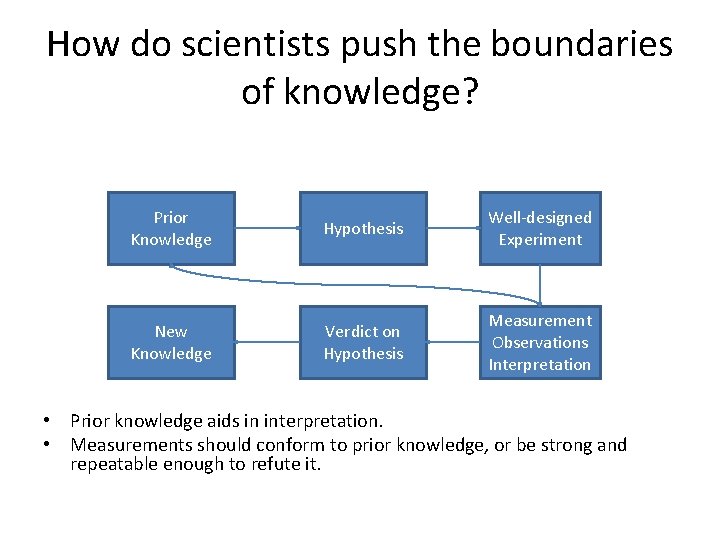
How do scientists push the boundaries of knowledge? Prior Knowledge Hypothesis Well-designed Experiment New Knowledge Verdict on Hypothesis Measurement Observations Interpretation • Prior knowledge aids in interpretation. • Measurements should conform to prior knowledge, or be strong and repeatable enough to refute it.
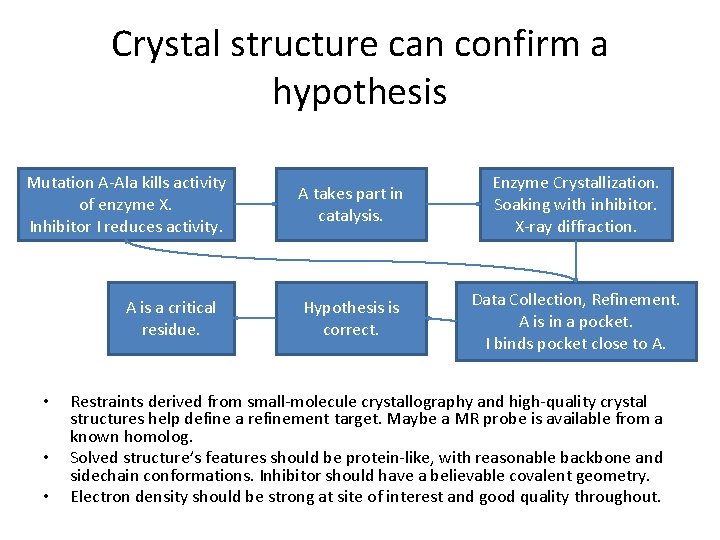
Crystal structure can confirm a hypothesis Mutation A-Ala kills activity of enzyme X. Inhibitor I reduces activity. A is a critical residue. • • • A takes part in catalysis. Enzyme Crystallization. Soaking with inhibitor. X-ray diffraction. Hypothesis is correct. Data Collection, Refinement. A is in a pocket. I binds pocket close to A. Restraints derived from small-molecule crystallography and high-quality crystal structures help define a refinement target. Maybe a MR probe is available from a known homolog. Solved structure’s features should be protein-like, with reasonable backbone and sidechain conformations. Inhibitor should have a believable covalent geometry. Electron density should be strong at site of interest and good quality throughout.
Model quality checking • = Validation = establishing the truth or accuracy of – – Theory Hypothesis Model Claim • Integral to scientific activity! • “Science is a way of trying not to fool yourself. The first principle is that you must not fool yourself, and you are the easiest person to fool. ” (Richard Feynman)
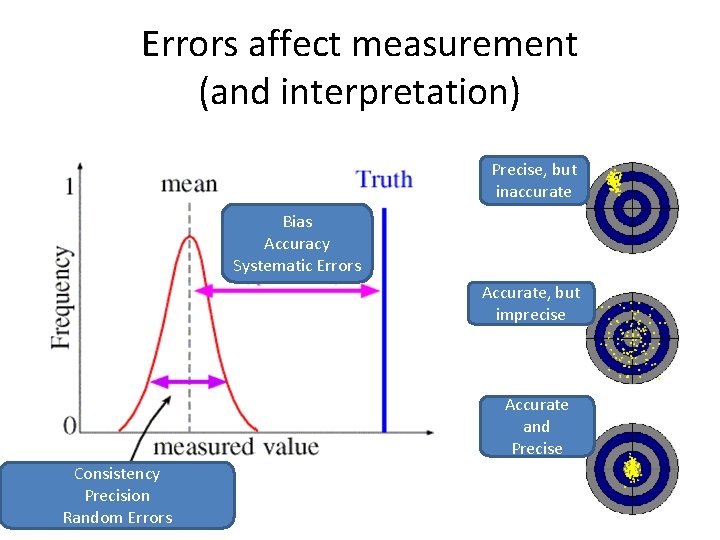
Errors affect measurement (and interpretation) Precise, but inaccurate Bias Accuracy Systematic Errors Accurate, but imprecise Accurate and Precise Consistency Precision Random Errors
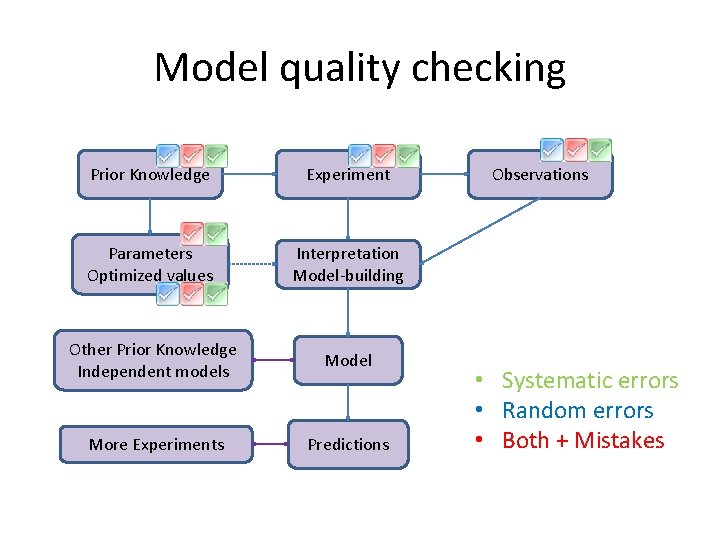
Model quality checking Prior Knowledge Experiment Parameters Optimized values Interpretation Model-building Other Prior Knowledge Independent models Model More Experiments Predictions Observations • Systematic errors • Random errors • Both + Mistakes
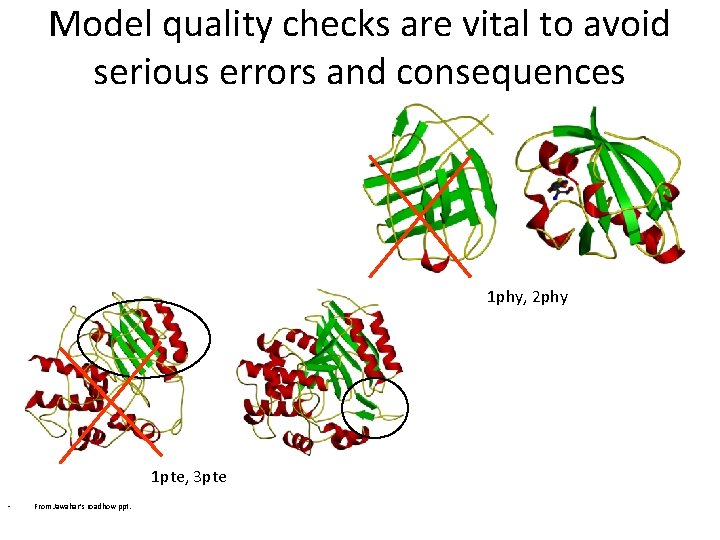
Model quality checks are vital to avoid serious errors and consequences 1 phy, 2 phy 1 pte, 3 pte • From Jawahar’s roadhow ppt.
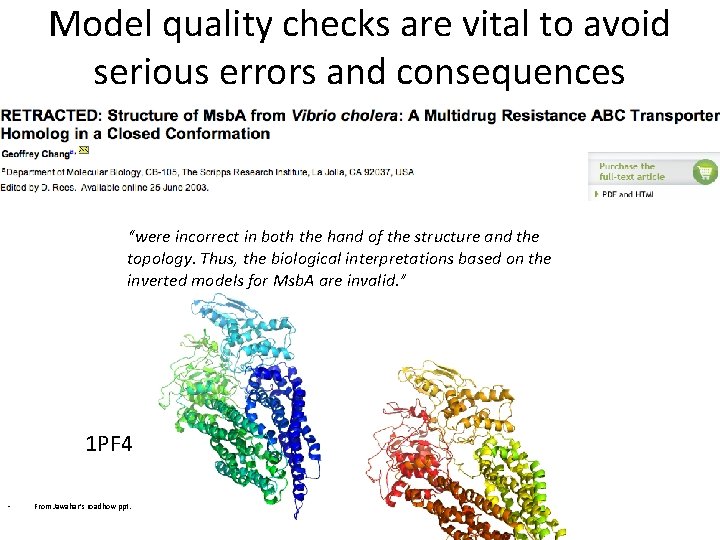
Model quality checks are vital to avoid serious errors and consequences “were incorrect in both the hand of the structure and the topology. Thus, the biological interpretations based on the inverted models for Msb. A are invalid. ” 1 PF 4 • From Jawahar’s roadhow ppt.
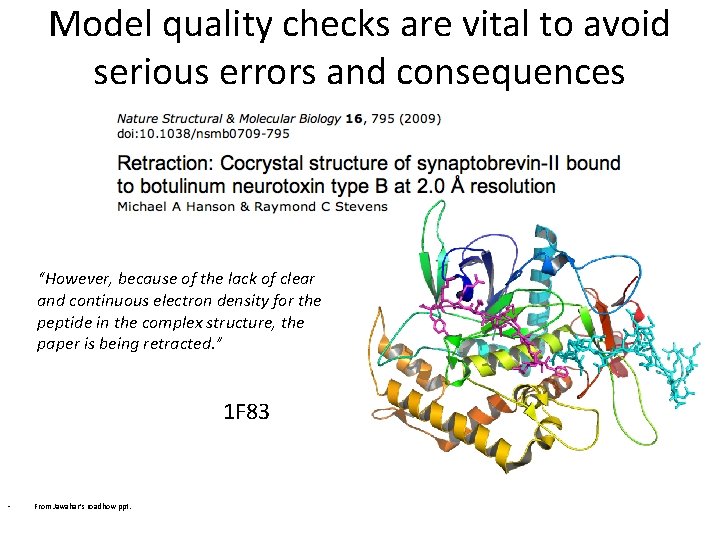
Model quality checks are vital to avoid serious errors and consequences “However, because of the lack of clear and continuous electron density for the peptide in the complex structure, the paper is being retracted. ” 1 F 83 • From Jawahar’s roadhow ppt.
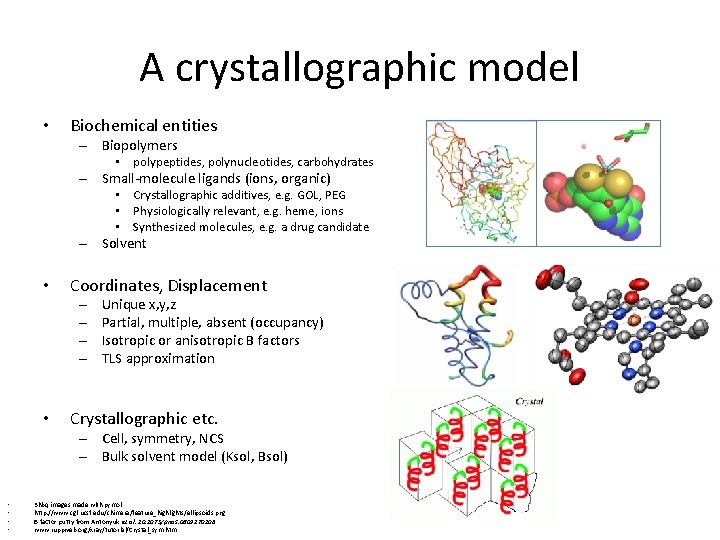
A crystallographic model • Biochemical entities – Biopolymers • polypeptides, polynucleotides, carbohydrates – Small-molecule ligands (ions, organic) • Crystallographic additives, e. g. GOL, PEG • Physiologically relevant, e. g. heme, ions • Synthesized molecules, e. g. a drug candidate – Solvent • Coordinates, Displacement – – • Unique x, y, z Partial, multiple, absent (occupancy) Isotropic or anisotropic B factors TLS approximation Crystallographic etc. – Cell, symmetry, NCS – Bulk solvent model (Ksol, Bsol) • • 3 hbq images made with pymol. http: //www. cgl. ucsf. edu/chimera/feature_highlights/ellipsoids. png B factor putty from Antonyuk et al. 1073/pnas. 0809170106 www. ruppweb. org/xray/tutorial/Crystal_sym. htm
A high-quality MX model makes sense in all respects • Chemical – Bond lengths, angles, planarity, chirality • Physical – Good packing, sensible interactions, reasonable thermal displacements • Crystallographic – Low crystallographic residueal, residues fit density, flat difference map • Protein Structure – Ramachandran, peptide, rotamers, disulpihdes, salt bridges, pi-interactions, hydrophobic core • Statistical – Best possible hypothesis to fit data, no over-fitting, no under-modelling • Biological – Explains observations (activity, mutants, inhibitors) – Is predictive
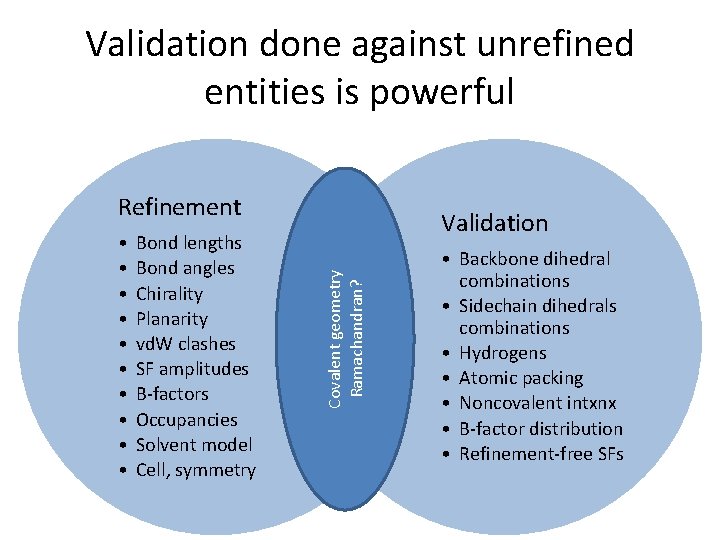
Validation done against unrefined entities is powerful Refinement Bond lengths Bond angles Chirality Planarity vd. W clashes SF amplitudes B-factors Occupancies Solvent model Cell, symmetry Covalent geometry Ramachandran? • • • Validation • Backbone dihedral combinations • Sidechain dihedrals combinations • Hydrogens • Atomic packing • Noncovalent intxnx • B-factor distribution • Refinement-free SFs
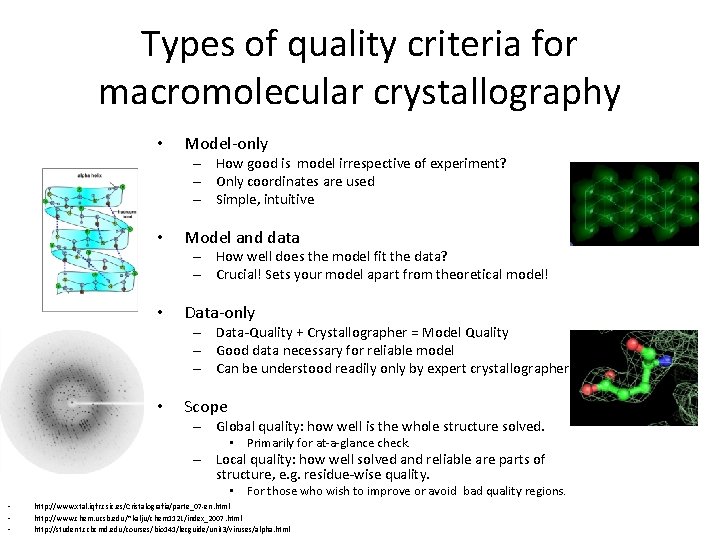
Types of quality criteria for macromolecular crystallography • Model-only – How good is model irrespective of experiment? – Only coordinates are used – Simple, intuitive • Model and data – How well does the model fit the data? – Crucial! Sets your model apart from theoretical model! • Data-only – Data-Quality + Crystallographer = Model Quality – Good data necessary for reliable model – Can be understood readily only by expert crystallographer • Scope – Global quality: how well is the whole structure solved. • Primarily for at-a-glance check. – Local quality: how well solved and reliable are parts of structure, e. g. residue-wise quality. • For those who wish to improve or avoid bad quality regions. • • • http: //www. xtal. iqfr. csic. es/Cristalografia/parte_07 -en. html http: //www. chem. ucsb. edu/~kalju/chem 112 L/index_2007. html http: //student. ccbcmd. edu/courses/bio 141/lecguide/unit 3/viruses/alpha. html
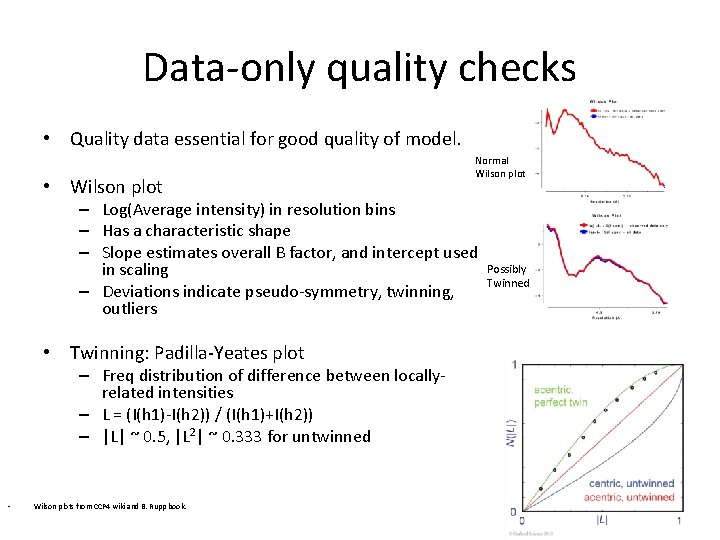
Data-only quality checks • Quality data essential for good quality of model. • Wilson plot Normal Wilson plot – Log(Average intensity) in resolution bins – Has a characteristic shape – Slope estimates overall B factor, and intercept used in scaling – Deviations indicate pseudo-symmetry, twinning, outliers • Twinning: Padilla-Yeates plot – Freq distribution of difference between locallyrelated intensities – L = (I(h 1)-I(h 2)) / (I(h 1)+I(h 2)) – |L| ~ 0. 5, |L 2| ~ 0. 333 for untwinned • Wilson plots from CCP 4 wiki and B. Rupp book. Possibly Twinned
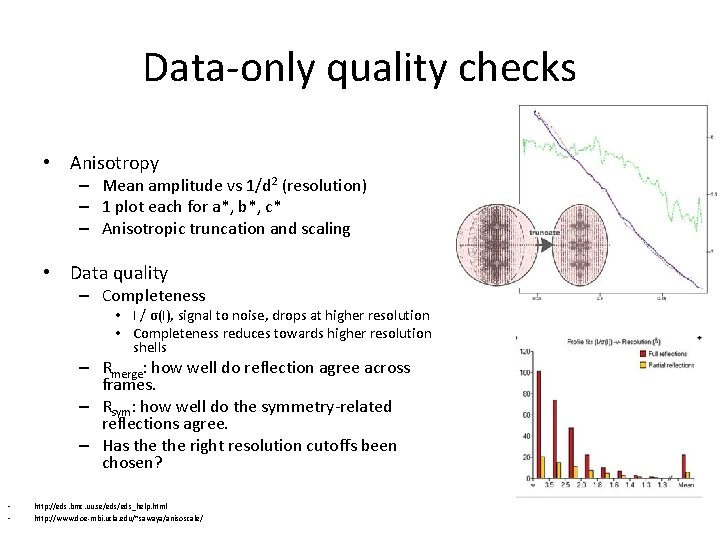
Data-only quality checks • Anisotropy – Mean amplitude vs 1/d 2 (resolution) – 1 plot each for a*, b*, c* – Anisotropic truncation and scaling • Data quality – Completeness • I / σ(I), signal to noise, drops at higher resolution • Completeness reduces towards higher resolution shells – Rmerge: how well do reflection agree across frames. – Rsym: how well do the symmetry-related reflections agree. – Has the right resolution cutoffs been chosen? • • http: //eds. bmc. uu. se/eds_help. html http: //www. doe-mbi. ucla. edu/~sawaya/anisoscale/
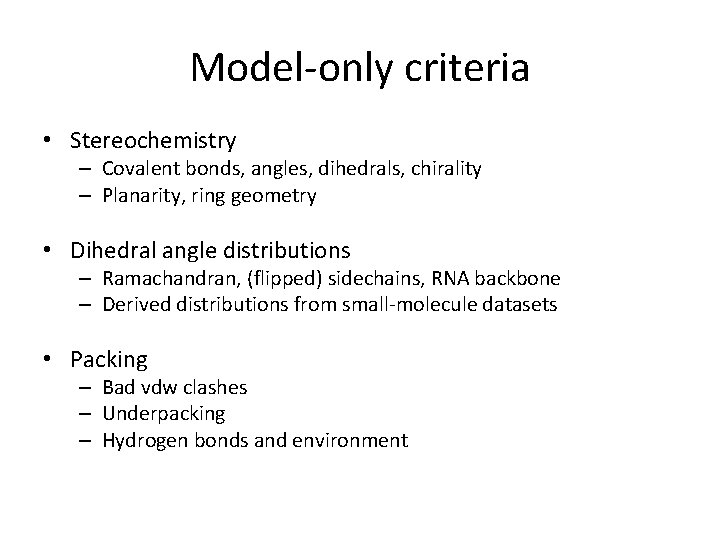
Model-only criteria • Stereochemistry – Covalent bonds, angles, dihedrals, chirality – Planarity, ring geometry • Dihedral angle distributions – Ramachandran, (flipped) sidechains, RNA backbone – Derived distributions from small-molecule datasets • Packing – Bad vdw clashes – Underpacking – Hydrogen bonds and environment
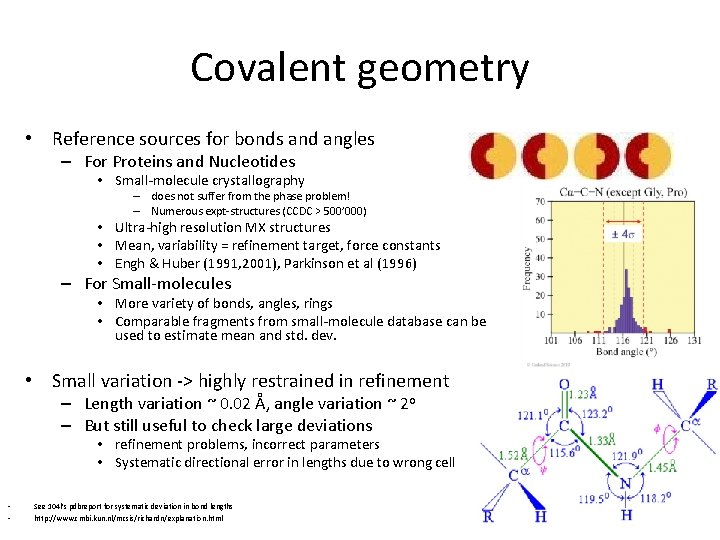
Covalent geometry • Reference sources for bonds and angles – For Proteins and Nucleotides • Small-molecule crystallography – does not suffer from the phase problem! – Numerous expt-structures (CCDC > 500’ 000) • Ultra-high resolution MX structures • Mean, variability = refinement target, force constants • Engh & Huber (1991, 2001), Parkinson et al (1996) – For Small-molecules • More variety of bonds, angles, rings • Comparable fragments from small-molecule database can be used to estimate mean and std. dev. • Small variation -> highly restrained in refinement – Length variation ~ 0. 02 Å, angle variation ~ 2 o – But still useful to check large deviations • refinement problems, incorrect parameters • Systematic directional error in lengths due to wrong cell • • See 104 l’s pdbreport for systematic deviation in bond lengths http: //www. cmbi. kun. nl/mcsis/richardn/explanation. html
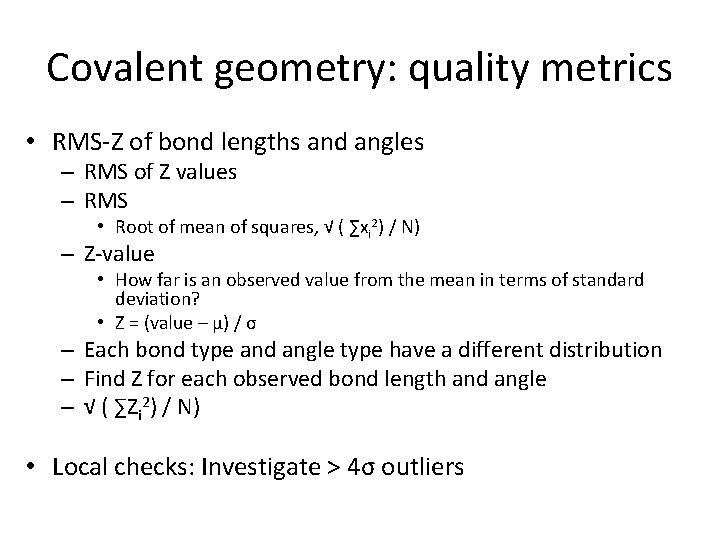
Covalent geometry: quality metrics • RMS-Z of bond lengths and angles – RMS of Z values – RMS • Root of mean of squares, √ ( ∑xi 2) / N) – Z-value • How far is an observed value from the mean in terms of standard deviation? • Z = (value – μ) / σ – Each bond type and angle type have a different distribution – Find Z for each observed bond length and angle – √ ( ∑Zi 2) / N) • Local checks: Investigate > 4σ outliers
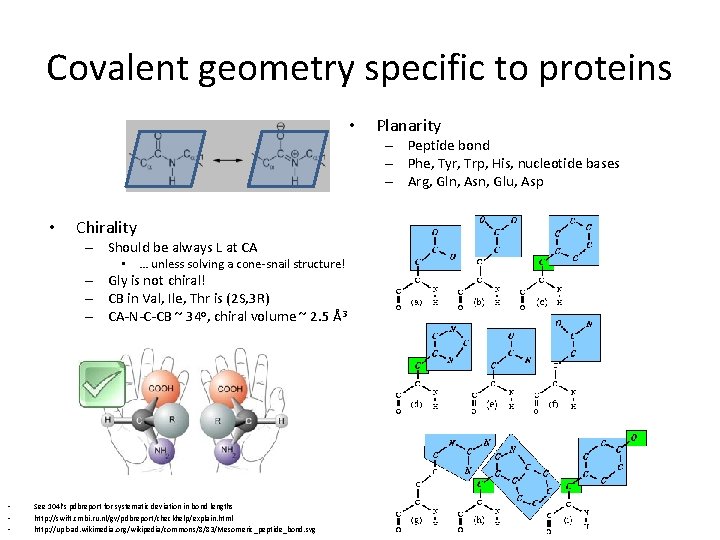
Covalent geometry specific to proteins • Planarity – Peptide bond – Phe, Tyr, Trp, His, nucleotide bases – Arg, Gln, Asn, Glu, Asp • Chirality – Should be always L at CA • … unless solving a cone-snail structure! – Gly is not chiral! – CB in Val, Ile, Thr is (2 S, 3 R) – CA-N-C-CB ~ 34 o, chiral volume ~ 2. 5 Å3 • • • See 104 l’s pdbreport for systematic deviation in bond lengths http: //swift. cmbi. ru. nl/gv/pdbreport/checkhelp/explain. html http: //upload. wikimedia. org/wikipedia/commons/8/83/Mesomeric_peptide_bond. svg
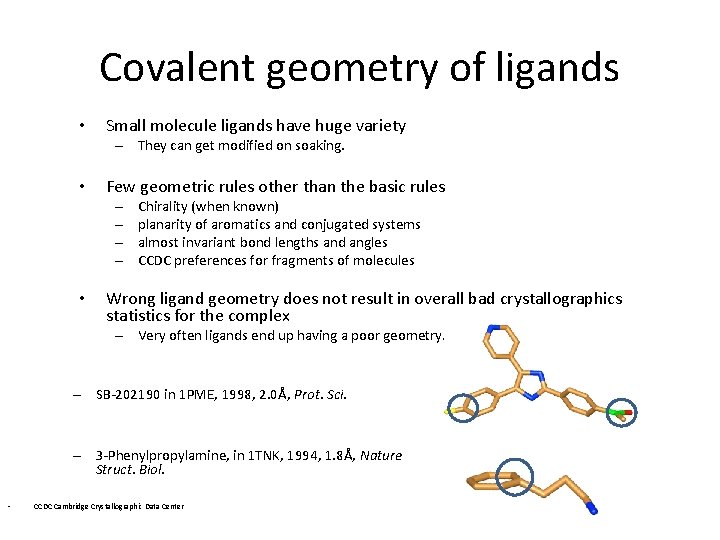
Covalent geometry of ligands • Small molecule ligands have huge variety – They can get modified on soaking. • Few geometric rules other than the basic rules – – • Chirality (when known) planarity of aromatics and conjugated systems almost invariant bond lengths and angles CCDC preferences for fragments of molecules Wrong ligand geometry does not result in overall bad crystallographics statistics for the complex – Very often ligands end up having a poor geometry. – SB-202190 in 1 PME, 1998, 2. 0Å, Prot. Sci. – 3 -Phenylpropylamine, in 1 TNK, 1994, 1. 8Å, Nature Struct. Biol. • CCDC Cambridge Crystallographic Data Center
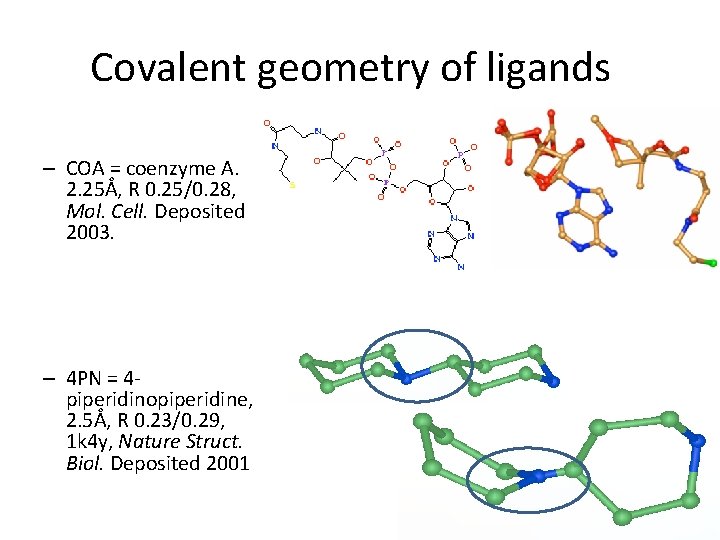
Covalent geometry of ligands – COA = coenzyme A. 2. 25Å, R 0. 25/0. 28, Mol. Cell. Deposited 2003. – 4 PN = 4 piperidinopiperidine, 2. 5Å, R 0. 23/0. 29, 1 k 4 y, Nature Struct. Biol. Deposited 2001
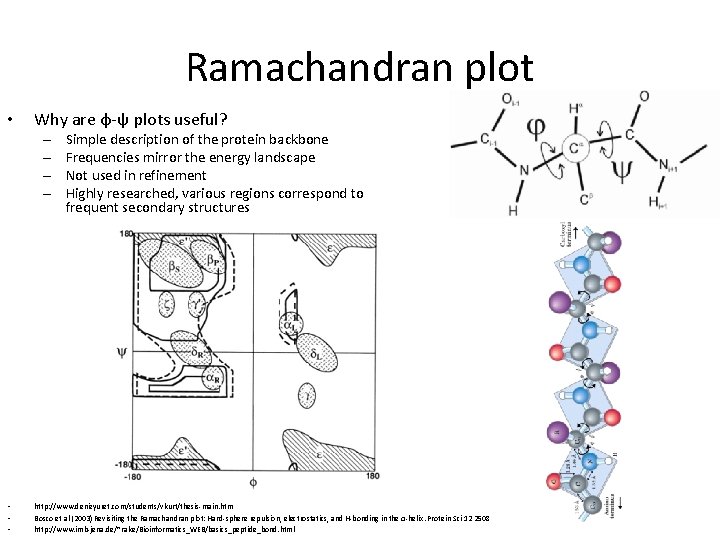
Ramachandran plot • Why are φ-ψ plots useful? – – • • • Simple description of the protein backbone Frequencies mirror the energy landscape Not used in refinement Highly researched, various regions correspond to frequent secondary structures http: //www. denizyuret. com/students/vkurt/thesis-main. htm Bosco et al (2003) Revisiting the Ramachandran plot: Hard-sphere repulsion, electrostatics, and H-bonding in the α-helix. Protein Sci 12 2508 http: //www. imb-jena. de/~rake/Bioinformatics_WEB/basics_peptide_bond. html
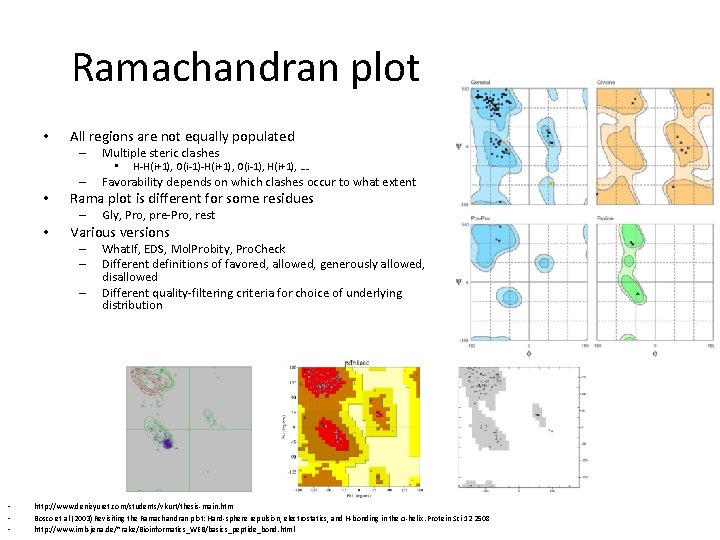
Ramachandran plot • All regions are not equally populated – Multiple steric clashes • – • Gly, Pro, pre-Pro, rest Various versions – – – • • • Favorability depends on which clashes occur to what extent Rama plot is different for some residues – • H-H(i+1), O(i-1), H(i+1), …. What. If, EDS, Mol. Probity, Pro. Check Different definitions of favored, allowed, generously allowed, disallowed Different quality-filtering criteria for choice of underlying distribution http: //www. denizyuret. com/students/vkurt/thesis-main. htm Bosco et al (2003) Revisiting the Ramachandran plot: Hard-sphere repulsion, electrostatics, and H-bonding in the α-helix. Protein Sci 12 2508 http: //www. imb-jena. de/~rake/Bioinformatics_WEB/basics_peptide_bond. html
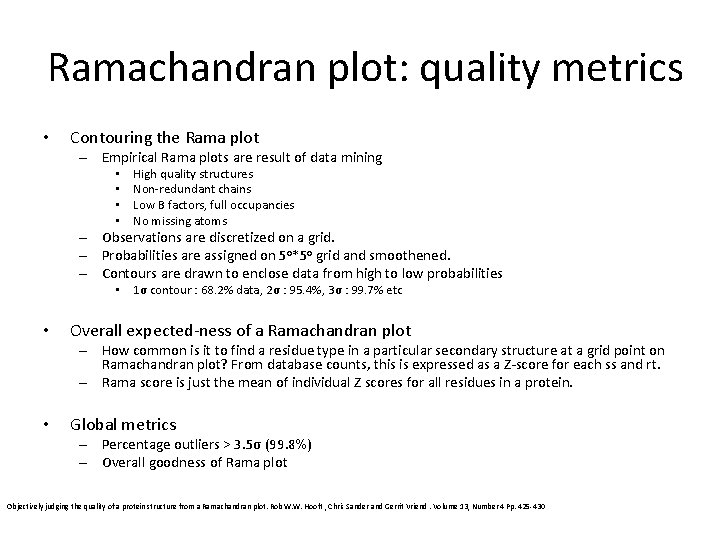
Ramachandran plot: quality metrics • Contouring the Rama plot – Empirical Rama plots are result of data mining • • High quality structures Non-redundant chains Low B factors, full occupancies No missing atoms – Observations are discretized on a grid. – Probabilities are assigned on 5 o*5 o grid and smoothened. – Contours are drawn to enclose data from high to low probabilities • 1σ contour : 68. 2% data, 2σ : 95. 4%, 3σ : 99. 7% etc • Overall expected-ness of a Ramachandran plot – How common is it to find a residue type in a particular secondary structure at a grid point on Ramachandran plot? From database counts, this is expressed as a Z-score for each ss and rt. – Rama score is just the mean of individual Z scores for all residues in a protein. • Global metrics – Percentage outliers > 3. 5σ (99. 8%) – Overall goodness of Rama plot Objectively judging the quality of a protein structure from a Ramachandran plot. Rob W. W. Hooft , Chris Sander and Gerrit Vriend. Volume 13, Number 4 Pp. 425 -430
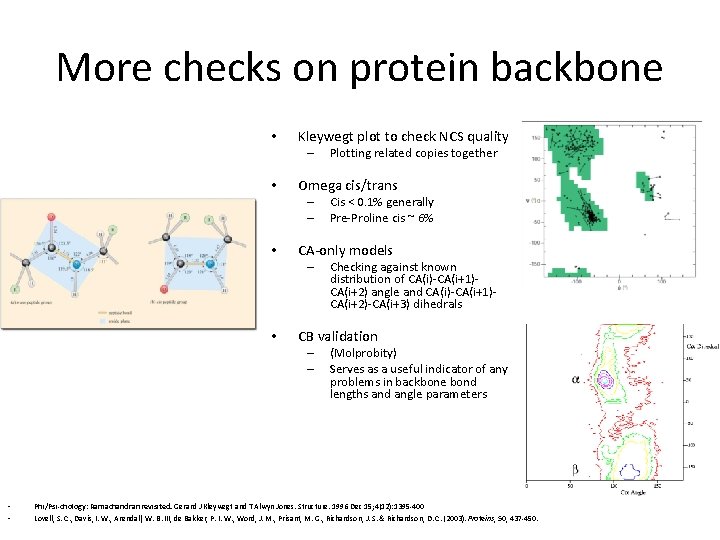
More checks on protein backbone • Kleywegt plot to check NCS quality – • Omega cis/trans – – • Checking against known distribution of CA(i)-CA(i+1)CA(i+2) angle and CA(i)-CA(i+1)CA(i+2)-CA(i+3) dihedrals CB validation – – • • Cis < 0. 1% generally Pre-Proline cis ~ 6% CA-only models – • Plotting related copies together (Molprobity) Serves as a useful indicator of any problems in backbone bond lengths and angle parameters Phi/Psi-chology: Ramachandran revisited. Gerard J Kleywegt and T Alwyn Jones. Structure. 1996 Dec 15; 4(12): 1395 -400 Lovell, S. C. , Davis, I. W. , Arendall, W. B. III, de Bakker, P. I. W. , Word, J. M. , Prisant, M. G. , Richardson, J. S. & Richardson, D. C. (2003). Proteins, 50, 437 -450.
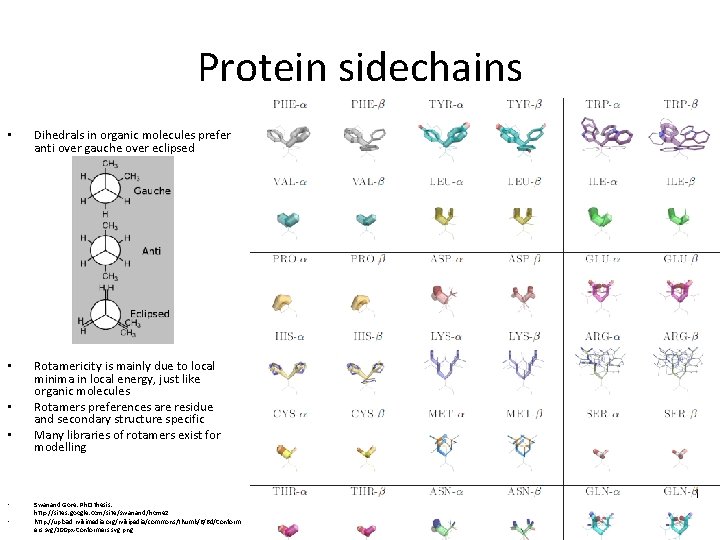
Protein sidechains • Dihedrals in organic molecules prefer anti over gauche over eclipsed • Rotamericity is mainly due to local minima in local energy, just like organic molecules Rotamers preferences are residue and secondary structure specific Many libraries of rotamers exist for modelling • • Swanand Gore. Ph. D thesis. http: //sites. google. com/site/swanand/home 2 http: //upload. wikimedia. org/wikipedia/commons/thumb/6/6 d/Conform ers. svg/200 px-Conformers. svg. png
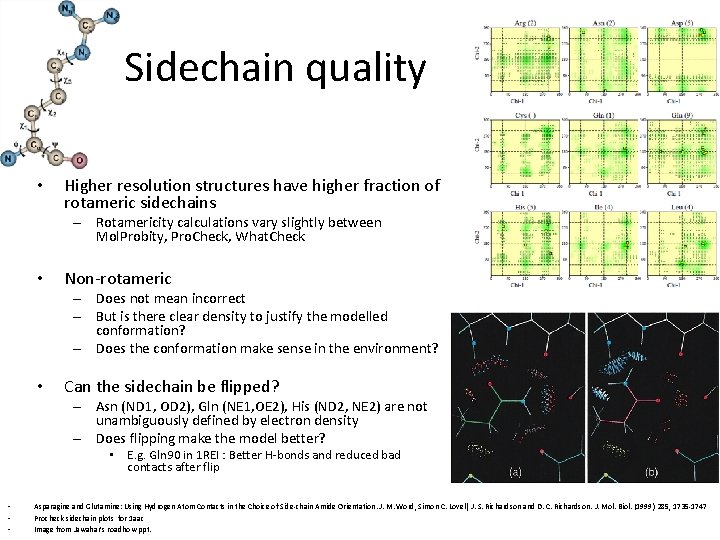
Sidechain quality • Higher resolution structures have higher fraction of rotameric sidechains – Rotamericity calculations vary slightly between Mol. Probity, Pro. Check, What. Check • Non-rotameric – Does not mean incorrect – But is there clear density to justify the modelled conformation? – Does the conformation make sense in the environment? • Can the sidechain be flipped? – Asn (ND 1, OD 2), Gln (NE 1, OE 2), His (ND 2, NE 2) are not unambiguously defined by electron density – Does flipping make the model better? • E. g. Gln 90 in 1 REI : Better H-bonds and reduced bad contacts after flip • • • Asparagine and Glutamine: Using Hydrogen Atom Contacts in the Choice of Side-chain Amide Orientation. J. M. Word, Simon C. Lovell, J. S. Richardson and D. C. Richardson. J. Mol. Biol. (1999) 285, 1735 -1747 Procheck sidechain plots for 1 aac Image from Jawahar’s roadhow ppt.
Sidechain quality metrics • Percentage of improbable rotamers – Similar to Ramachandran, high-quality data for sidechains is collected – Densities are determined and smoothed – Χ dihedral space of sidechains is countoured in as many dimensions necessary – Probability of occurrence of a sidechain is determined according to its location w. r. t. contours • Percentage of flippable NQH sidechains
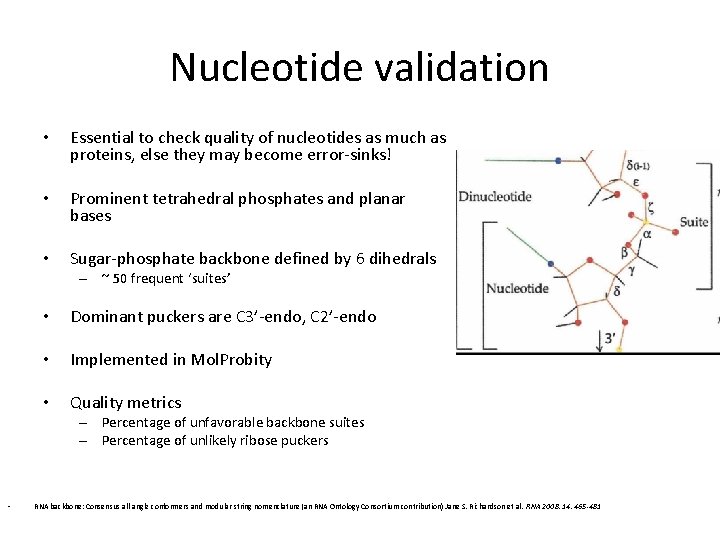
Nucleotide validation • Essential to check quality of nucleotides as much as proteins, else they may become error-sinks! • Prominent tetrahedral phosphates and planar bases • Sugar-phosphate backbone defined by 6 dihedrals – ~ 50 frequent ‘suites’ • Dominant puckers are C 3’-endo, C 2’-endo • Implemented in Mol. Probity • Quality metrics – Percentage of unfavorable backbone suites – Percentage of unlikely ribose puckers • RNA backbone: Consensus all-angle conformers and modular string nomenclature (an RNA Ontology Consortium contribution) Jane S. Richardson et al. RNA 2008. 14: 465 -481
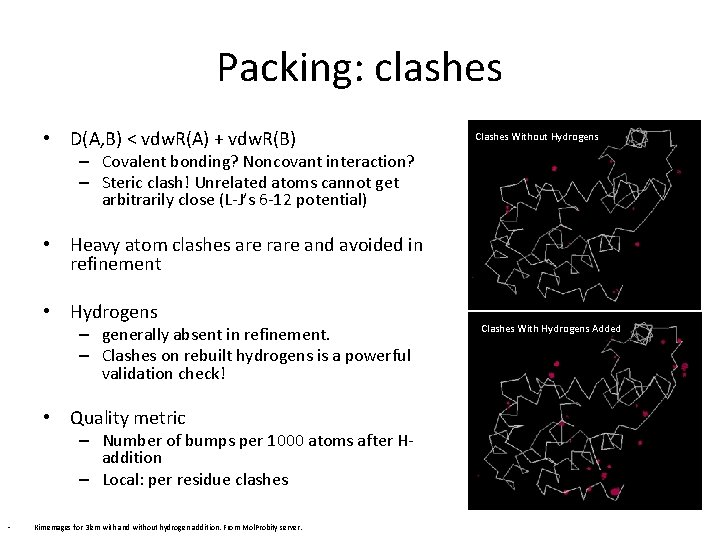
Packing: clashes • D(A, B) < vdw. R(A) + vdw. R(B) Clashes Without Hydrogens – Covalent bonding? Noncovant interaction? – Steric clash! Unrelated atoms cannot get arbitrarily close (L-J’s 6 -12 potential) • Heavy atom clashes are rare and avoided in refinement • Hydrogens – generally absent in refinement. – Clashes on rebuilt hydrogens is a powerful validation check! • Quality metric – Number of bumps per 1000 atoms after Haddition – Local: per residue clashes • Kimemages for 3 lzm with and without hydrogen addition. From Mol. Probity server. Clashes With Hydrogens Added
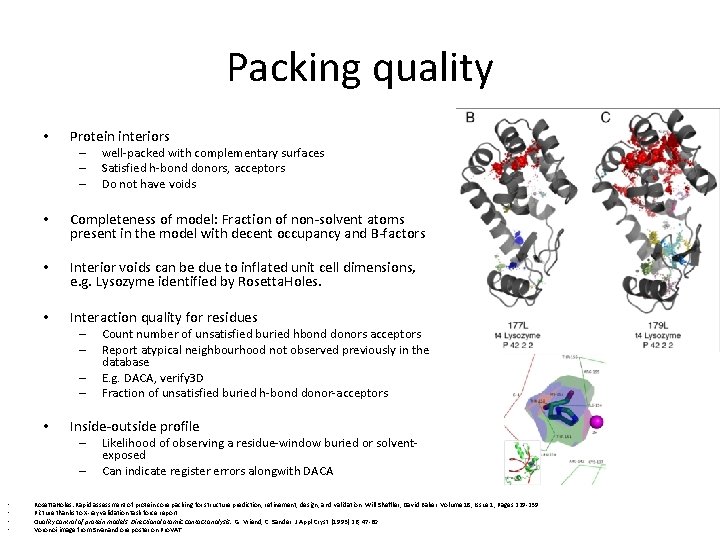
Packing quality • Protein interiors – – – • Completeness of model: Fraction of non-solvent atoms present in the model with decent occupancy and B-factors • Interior voids can be due to inflated unit cell dimensions, e. g. Lysozyme identified by Rosetta. Holes. • Interaction quality for residues – – • Count number of unsatisfied buried hbond donors acceptors Report atypical neighbourhood not observed previously in the database E. g. DACA, verify 3 D Fraction of unsatisfied buried h-bond donor-acceptors Inside-outside profile – – • • well-packed with complementary surfaces Satisfied h-bond donors, acceptors Do not have voids Likelihood of observing a residue-window buried or solventexposed Can indicate register errors alongwith DACA Rosetta. Holes: Rapid assessment of protein core packing for structure prediction, refinement, design, and validation. Will Sheffler, David Baker. Volume 18, Issue 1, Pages 229 -239. Picture thanks to X-ray validation task force report. Quality control of protein models: Directional atomic contact analysis. G. Vriend, C. Sander. J. Appl. Cryst. (1993) 26, 47 -60. Voronoi image from Swanand ore poster on Pro. VAT.
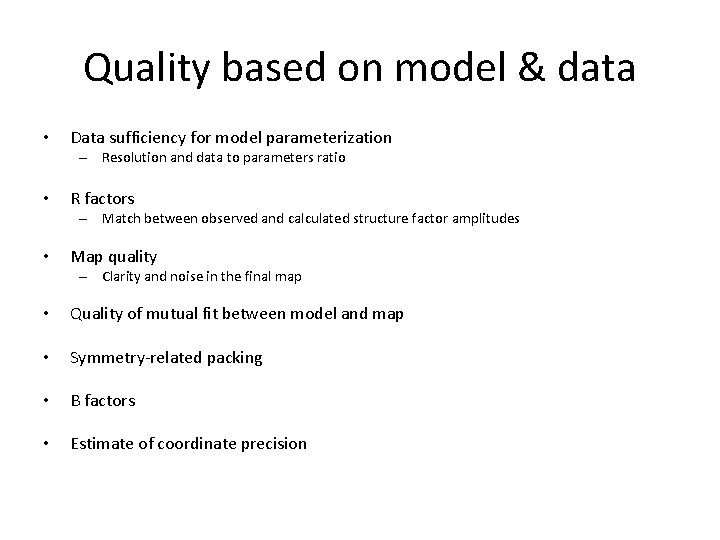
Quality based on model & data • Data sufficiency for model parameterization – Resolution and data to parameters ratio • R factors – Match between observed and calculated structure factor amplitudes • Map quality – Clarity and noise in the final map • Quality of mutual fit between model and map • Symmetry-related packing • B factors • Estimate of coordinate precision
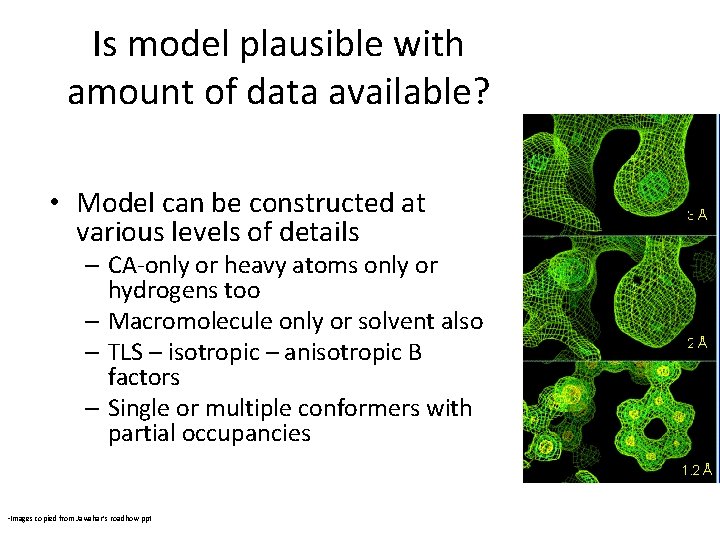
Is model plausible with amount of data available? • Model can be constructed at various levels of details – CA-only or heavy atoms only or hydrogens too – Macromolecule only or solvent also – TLS – isotropic – anisotropic B factors – Single or multiple conformers with partial occupancies • Images copied from Jawahar’s roadhow ppt
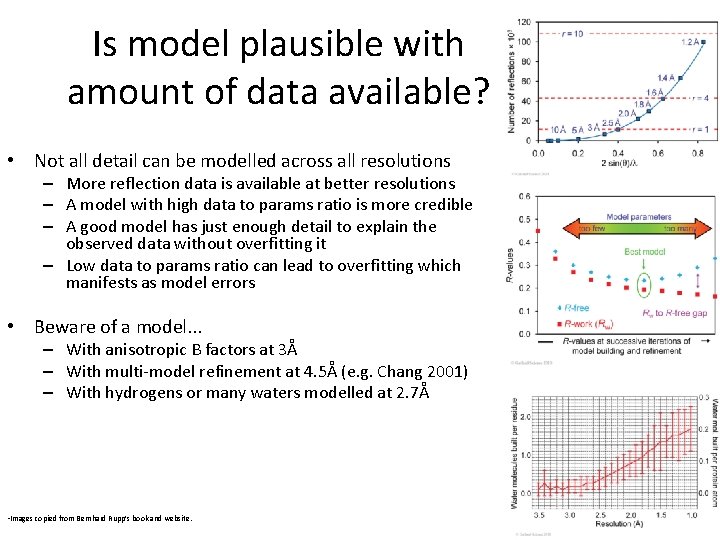
Is model plausible with amount of data available? • Not all detail can be modelled across all resolutions – More reflection data is available at better resolutions – A model with high data to params ratio is more credible – A good model has just enough detail to explain the observed data without overfitting it – Low data to params ratio can lead to overfitting which manifests as model errors • Beware of a model. . . – With anisotropic B factors at 3Å – With multi-model refinement at 4. 5Å (e. g. Chang 2001) – With hydrogens or many waters modelled at 2. 7Å • Images copied from Bernhard Rupp’s book and website.
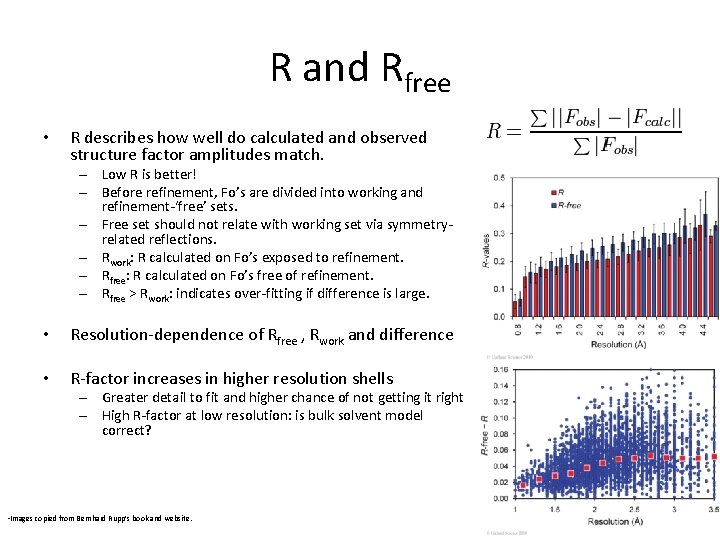
R and Rfree • R describes how well do calculated and observed structure factor amplitudes match. – Low R is better! – Before refinement, Fo’s are divided into working and refinement-‘free’ sets. – Free set should not relate with working set via symmetryrelated reflections. – Rwork: R calculated on Fo’s exposed to refinement. – Rfree: R calculated on Fo’s free of refinement. – Rfree > Rwork: indicates over-fitting if difference is large. • Resolution-dependence of Rfree , Rwork and difference • R-factor increases in higher resolution shells – Greater detail to fit and higher chance of not getting it right – High R-factor at low resolution: is bulk solvent model correct? • Images copied from Bernhard Rupp’s book and website.
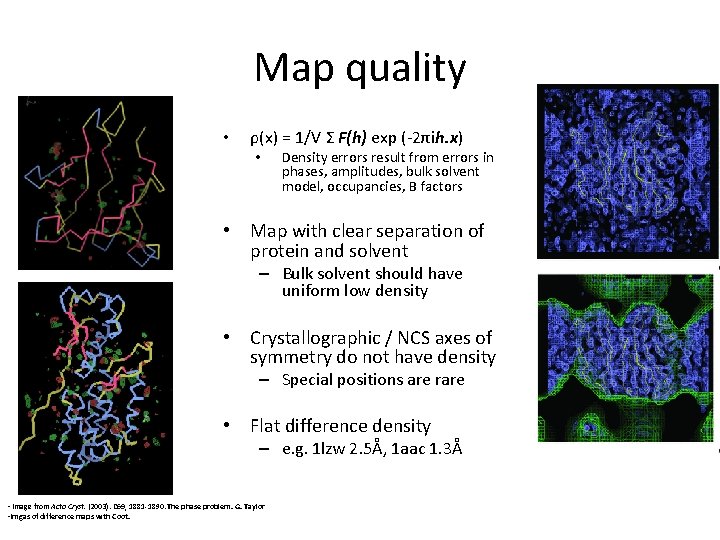
Map quality • ρ(x) = 1/V Σ F(h) exp (-2πih. x) • Density errors result from errors in phases, amplitudes, bulk solvent model, occupancies, B factors • Map with clear separation of protein and solvent – Bulk solvent should have uniform low density • Crystallographic / NCS axes of symmetry do not have density – Special positions are rare • Flat difference density – e. g. 1 lzw 2. 5Å, 1 aac 1. 3Å • Image from Acta Cryst. (2003). D 59, 1881 -1890. The phase problem. G. Taylor • Imgas of difference maps with Coot.
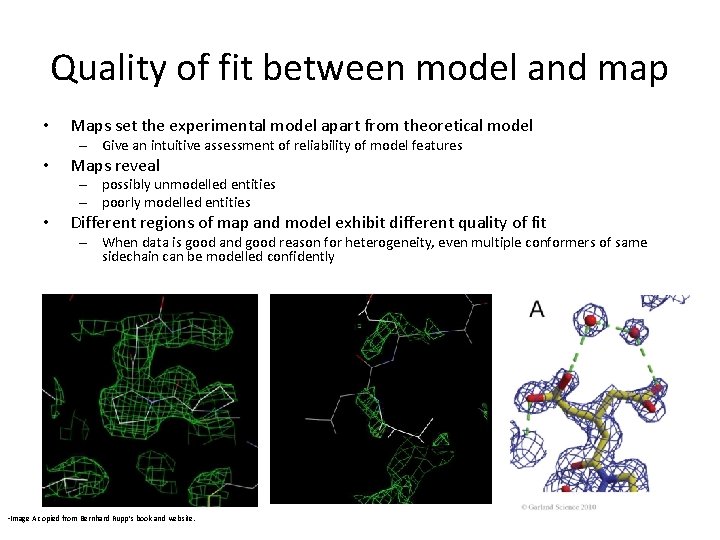
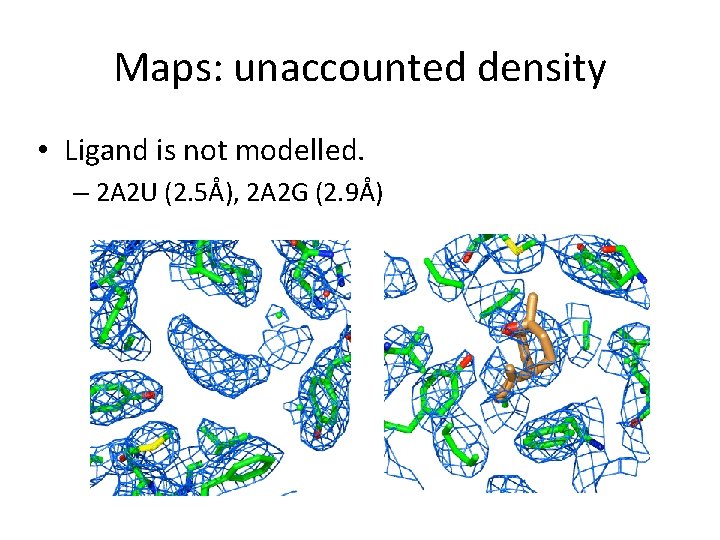
Quality of fit between model and map • Maps set the experimental model apart from theoretical model – Give an intuitive assessment of reliability of model features • Maps reveal – possibly unmodelled entities – poorly modelled entities • Different regions of map and model exhibit different quality of fit – When data is good and good reason for heterogeneity, even multiple conformers of same sidechain can be modelled confidently • Image A copied from Bernhard Rupp’s book and website.
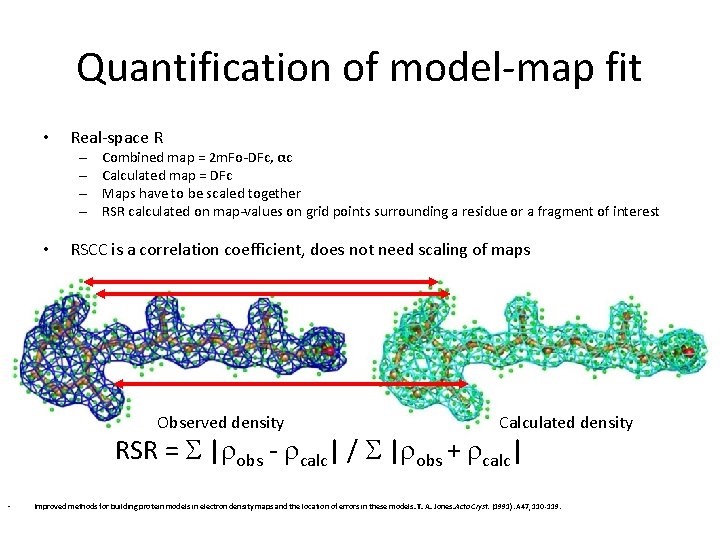
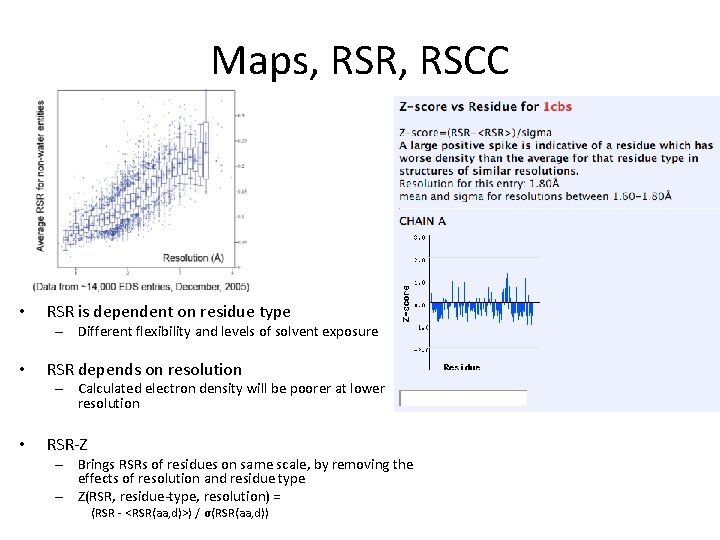
Quantification of model-map fit • Real-space R – – • Combined map = 2 m. Fo-DFc, αc Calculated map = DFc Maps have to be scaled together RSR calculated on map-values on grid points surrounding a residue or a fragment of interest RSCC is a correlation coefficient, does not need scaling of maps Observed density Calculated density RSR = | obs - calc| / | obs + calc| • Improved methods for building protein models in electron density maps and the location of errors in these models. T. A. Jones. Acta Cryst. (1991). A 47, 110 -119.
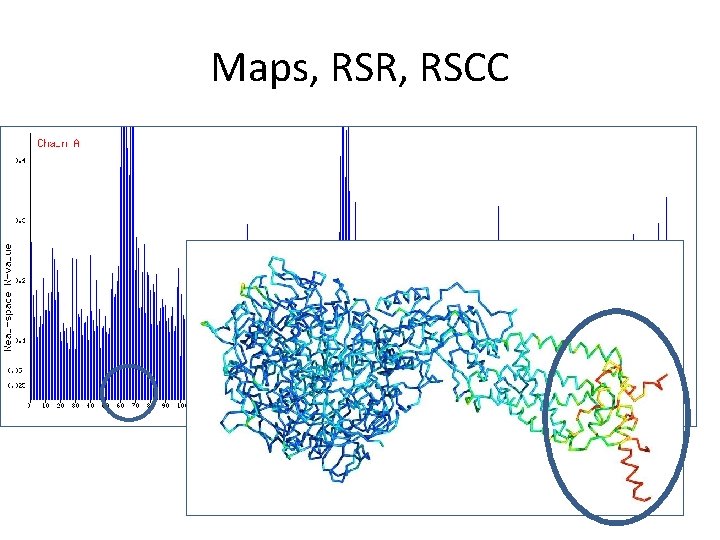
Maps, RSR, RSCC
Maps, RSR, RSCC • RSR is dependent on residue type – Different flexibility and levels of solvent exposure • RSR depends on resolution – Calculated electron density will be poorer at lower resolution • RSR-Z – Brings RSRs of residues on same scale, by removing the effects of resolution and residue type – Z(RSR, residue-type, resolution) = (RSR - <RSR(aa, d)>) / σ(RSR(aa, d))
Maps: unaccounted density • Ligand is not modelled. – 2 A 2 U (2. 5Å), 2 A 2 G (2. 9Å)
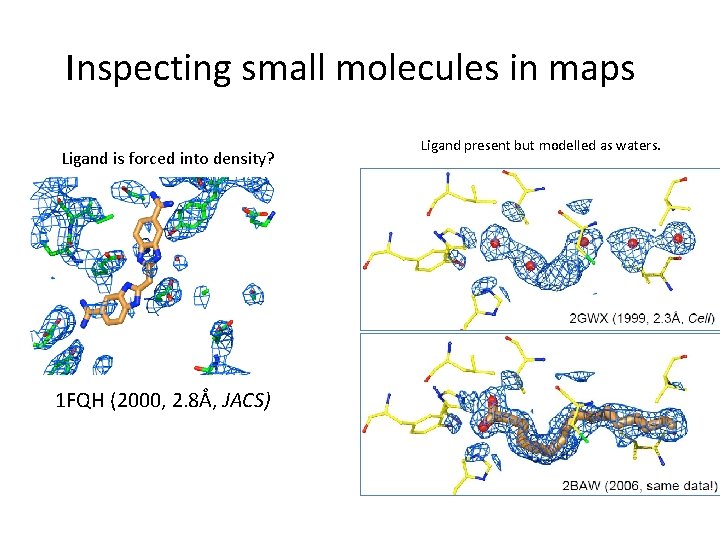
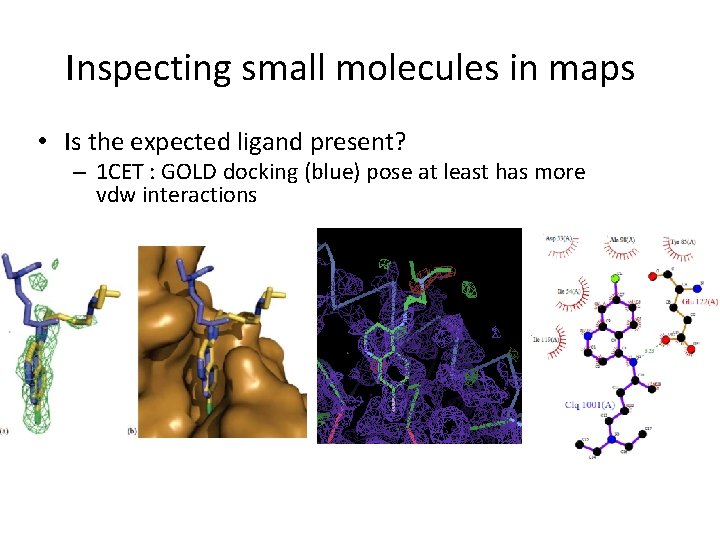
Inspecting small molecules in maps Ligand is forced into density? 1 FQH (2000, 2. 8Å, JACS) Ligand present but modelled as waters.
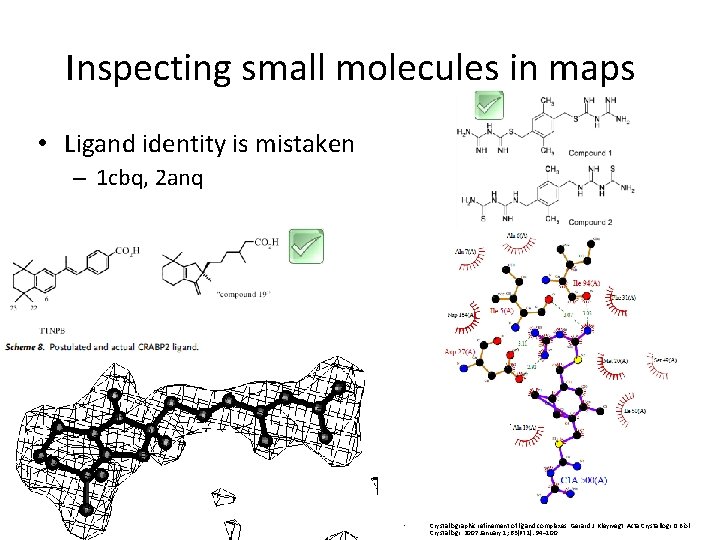
Inspecting small molecules in maps • Ligand identity is mistaken – 1 cbq, 2 anq • Crystallographic refinement of ligand complexes. Gerard J. Kleywegt. Acta Crystallogr D Biol Crystallogr. 2007 January 1; 63(Pt 1): 94– 100.
Inspecting small molecules in maps • Is the expected ligand present? – 1 CET : GOLD docking (blue) pose at least has more vdw interactions
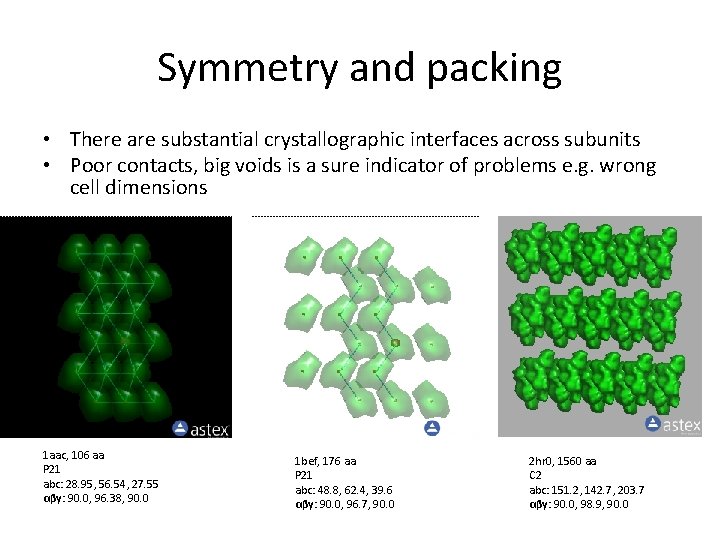
Symmetry and packing • There are substantial crystallographic interfaces across subunits • Poor contacts, big voids is a sure indicator of problems e. g. wrong cell dimensions 1 aac, 106 aa P 21 abc: 28. 95, 56. 54, 27. 55 αβγ: 90. 0, 96. 38, 90. 0 1 bef, 176 aa P 21 abc: 48. 8, 62. 4, 39. 6 αβγ: 90. 0, 96. 7, 90. 0 2 hr 0, 1560 aa C 2 abc: 151. 2, 142. 7, 203. 7 αβγ: 90. 0, 98. 9, 90. 0
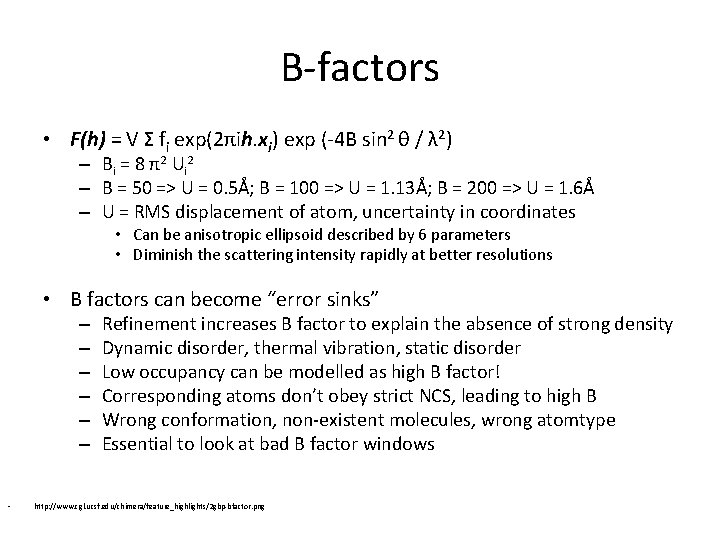
B-factors • F(h) = V Σ fi exp(2πih. xi) exp (-4 B sin 2 θ / λ 2) – Bi = 8 π2 Ui 2 – B = 50 => U = 0. 5Å; B = 100 => U = 1. 13Å; B = 200 => U = 1. 6Å – U = RMS displacement of atom, uncertainty in coordinates • Can be anisotropic ellipsoid described by 6 parameters • Diminish the scattering intensity rapidly at better resolutions • B factors can become “error sinks” – – – • Refinement increases B factor to explain the absence of strong density Dynamic disorder, thermal vibration, static disorder Low occupancy can be modelled as high B factor! Corresponding atoms don’t obey strict NCS, leading to high B Wrong conformation, non-existent molecules, wrong atomtype Essential to look at bad B factor windows http: //www. cgl. ucsf. edu/chimera/feature_highlights/2 gbp-bfactor. png
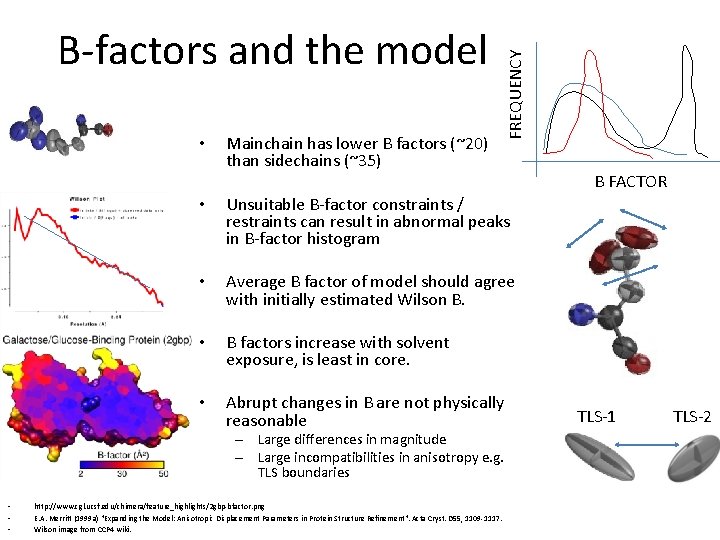
• Mainchain has lower B factors (~20) than sidechains (~35) • Unsuitable B-factor constraints / restraints can result in abnormal peaks in B-factor histogram • Average B factor of model should agree with initially estimated Wilson B. • B factors increase with solvent exposure, is least in core. • Abrupt changes in B are not physically reasonable – Large differences in magnitude – Large incompatibilities in anisotropy e. g. TLS boundaries • • • FREQUENCY B-factors and the model http: //www. cgl. ucsf. edu/chimera/feature_highlights/2 gbp-bfactor. png E. A. Merritt (1999 a) "Expanding the Model: Anisotropic Displacement Parameters in Protein Structure Refinement". Acta Cryst. D 55, 1109 -1117. Wilson image from CCP 4 wiki. B FACTOR TLS-1 TLS-2
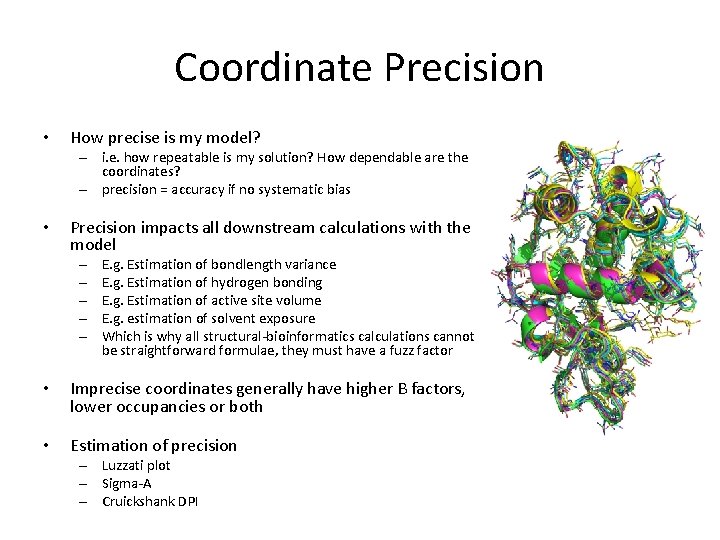
Coordinate Precision • How precise is my model? – i. e. how repeatable is my solution? How dependable are the coordinates? – precision = accuracy if no systematic bias • Precision impacts all downstream calculations with the model – – – E. g. Estimation of bondlength variance E. g. Estimation of hydrogen bonding E. g. Estimation of active site volume E. g. estimation of solvent exposure Which is why all structural-bioinformatics calculations cannot be straightforward formulae, they must have a fuzz factor • Imprecise coordinates generally have higher B factors, lower occupancies or both • Estimation of precision – Luzzati plot – Sigma-A – Cruickshank DPI
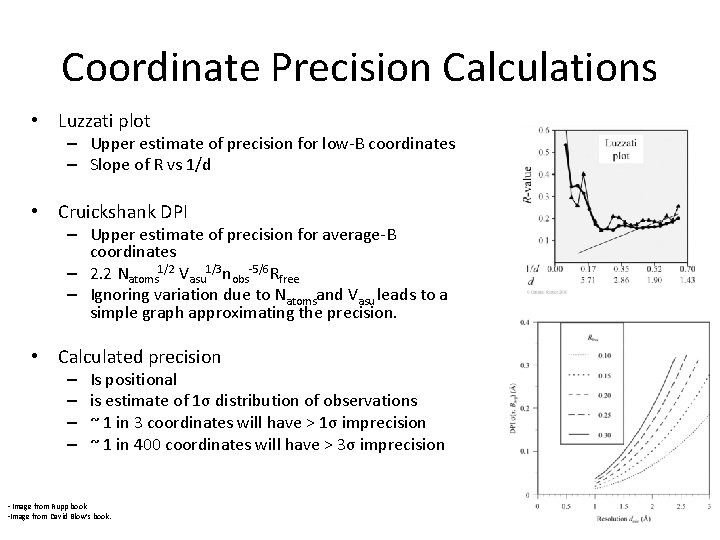
Coordinate Precision Calculations • Luzzati plot – Upper estimate of precision for low-B coordinates – Slope of R vs 1/d • Cruickshank DPI – Upper estimate of precision for average-B coordinates – 2. 2 Natoms 1/2 Vasu 1/3 nobs-5/6 Rfree – Ignoring variation due to Natomsand Vasu leads to a simple graph approximating the precision. • Calculated precision – – Is positional is estimate of 1σ distribution of observations ~ 1 in 3 coordinates will have > 1σ imprecision ~ 1 in 400 coordinates will have > 3σ imprecision • Image from Rupp book • Image from David Blow’s book.
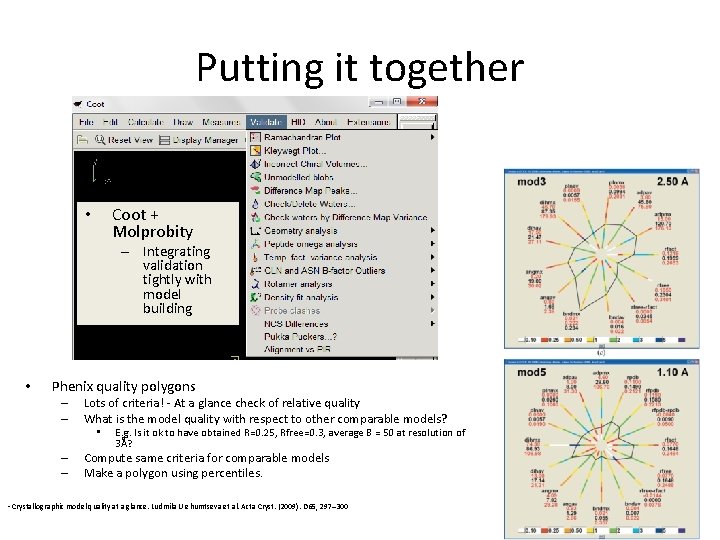
Putting it together Coot + Molprobity • – Integrating validation tightly with model building • Phenix quality polygons – – Lots of criteria! - At a glance check of relative quality What is the model quality with respect to other comparable models? • – – E. g. Is it ok to have obtained R=0. 25, Rfree=0. 3, average B = 50 at resolution of 3Å? Compute same criteria for comparable models Make a polygon using percentiles. • Crystallographic model quality at a glance. Ludmila Urzhumtseva et al. Acta Cryst. (2009). D 65, 297– 300
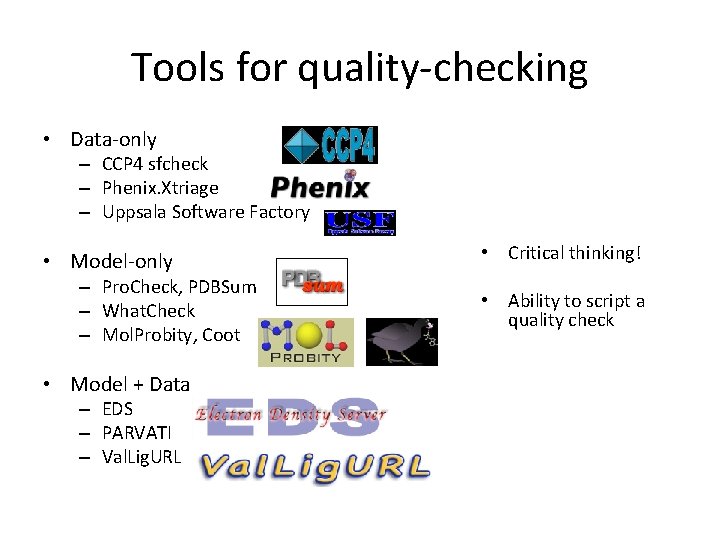
Tools for quality-checking • Data-only – CCP 4 sfcheck – Phenix. Xtriage – Uppsala Software Factory • Model-only – Pro. Check, PDBSum – What. Check – Mol. Probity, Coot • Model + Data – EDS – PARVATI – Val. Lig. URL • Critical thinking! • Ability to script a quality check
Summary • A good model makes sense from all aspects – chemical, physical, structural, crystallographic, statistical, biological • Errors are part of the game, but so is validation of model quality. – Most checks are diagnostic, but do not identify true cause or cure – Not for finding mistakes but preventing errors • Standard criteria and tools catch majority of errors and help build a high quality model. • Special attention should be given to non-standard entities like small molecules, carbohydrates etc. • Comparison against other models of similar resolution and size is useful.
Model Quality and PDBe • Tools for checking model quality are not available in a centralized location. • Places where quality stats are most needed – PDB deposition process – Webpages for PDB entries – Peer-review process • X-ray Validation Task Force – VTF is compiling recommendations regarding calculation and presentation of quality metrics. – All criteria are to be reported as percentiles within entries of comparable resolution. – PDBe will implement a comprehensive resource for validating model quality, available as online or downloadable tool. – The resource will be useful for end-users and depositors.
Acknowledgements • Alejandro and IPMont • Sameer Velankar, Jawahar Swaminathan at PDBe • Great books (Mc. Pherson, Blow, Rupp, Petsko-Ringe) • Excellent resources online – – – Rupp web Randy Read’s course Wikipedia CCP 4 wiki. . . many more