
Mobility Planning for Active Transportation Infrastructure and Sustainable
Mobility Planning for Active Transportation Infrastructure and Sustainable Communities Kevin Kokes, AICP Sustainable Development Program American Council of Engineering Companies of Dallas January 22, 2018

Sustainable Development Planning Projects Land Use-Transportation Corridor Studies (Urban Thoroughfares) • Rail Station Area/ TOD Plans Infrastructure Analysis • Context Sensitive Transportation Plans • Form-Based Codes and Design Guidelines Downtown Plans/ Area Visioning Studies Safe Routes to Schools and Safety Plans

Planning / Designing for All Ages and Abilities (Ages 8 to 80) Children Walk Commute Adults Fitness


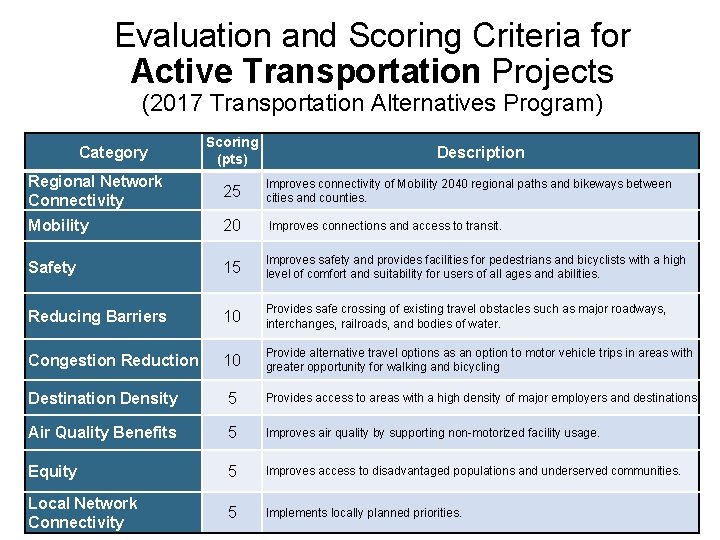
Evaluation and Scoring Criteria for Active Transportation Projects (2017 Transportation Alternatives Program) Category Scoring (pts) Description Regional Network Connectivity 25 Improves connectivity of Mobility 2040 regional paths and bikeways between cities and counties. Mobility 20 Improves connections and access to transit. Safety 15 Improves safety and provides facilities for pedestrians and bicyclists with a high level of comfort and suitability for users of all ages and abilities. Reducing Barriers 10 Provides safe crossing of existing travel obstacles such as major roadways, interchanges, railroads, and bodies of water. Congestion Reduction 10 Provide alternative travel options as an option to motor vehicle trips in areas with greater opportunity for walking and bicycling Destination Density 5 Provides access to areas with a high density of major employers and destinations. Air Quality Benefits 5 Improves air quality by supporting non-motorized facility usage. Equity 5 Improves access to disadvantaged populations and underserved communities. Local Network Connectivity 5 Implements locally planned priorities.
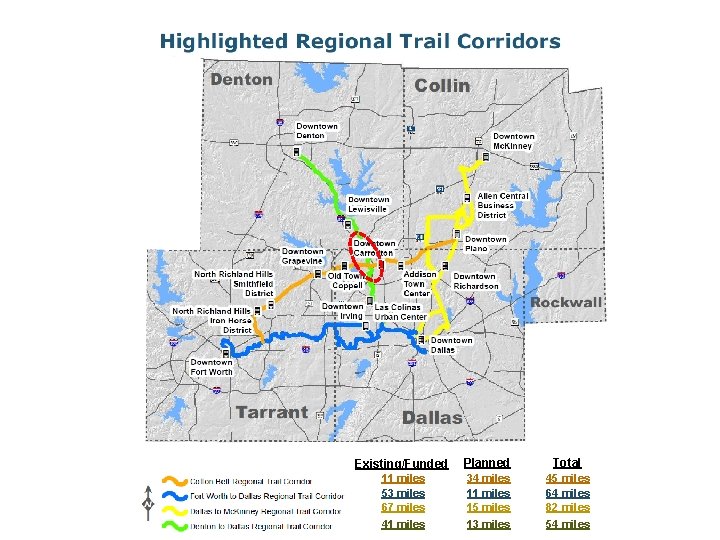
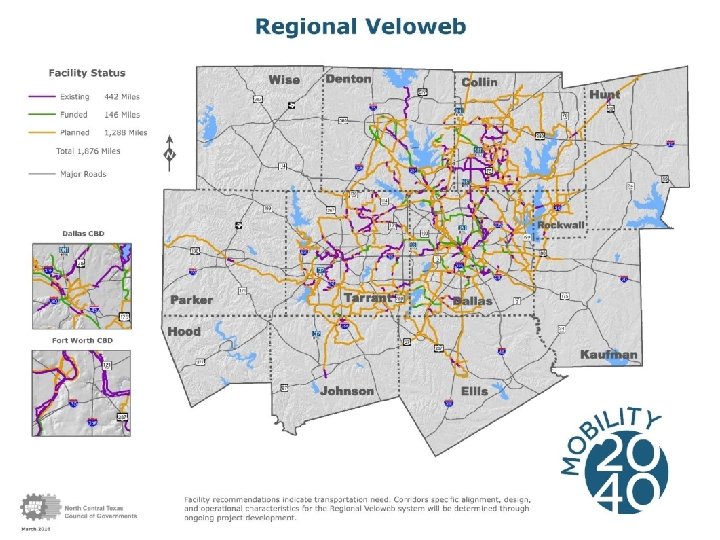
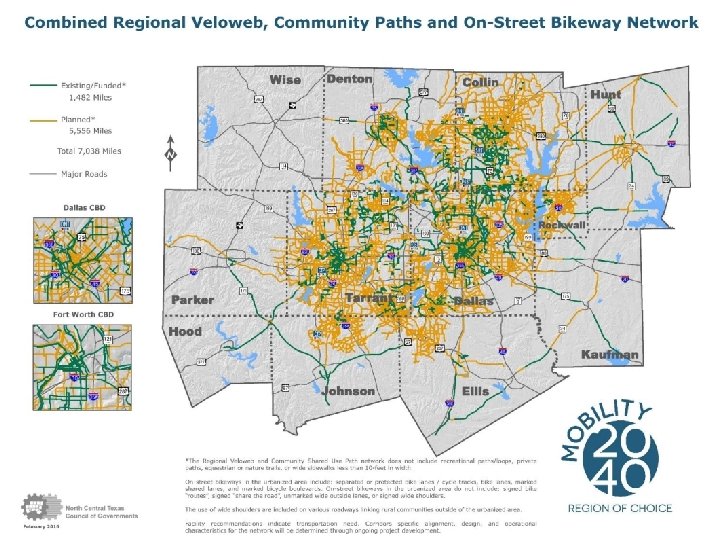
Existing/Funded Planned Total 11 miles 53 miles 67 miles 34 miles 11 miles 15 miles 45 miles 64 miles 82 miles 41 miles 13 miles 54 miles
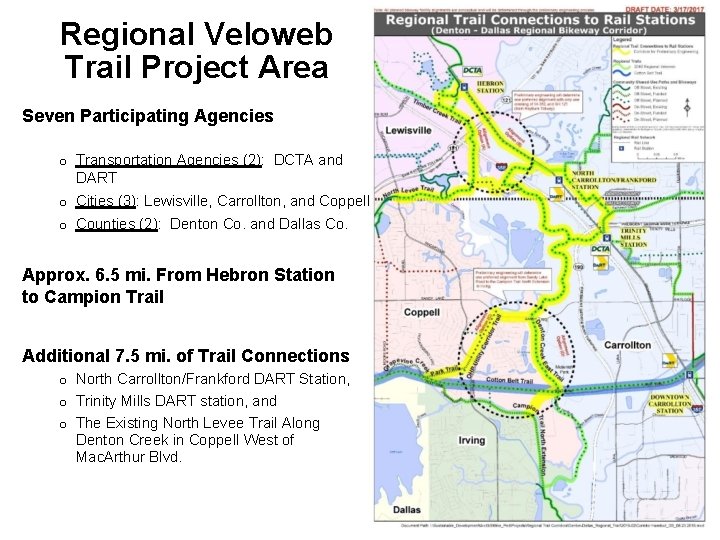
Regional Veloweb Trail Project Area Seven Participating Agencies o Transportation Agencies (2): DCTA and DART o Cities (3): Lewisville, Carrollton, and Coppell o Counties (2): Denton Co. and Dallas Co. Approx. 6. 5 mi. From Hebron Station to Campion Trail Additional 7. 5 mi. of Trail Connections o North Carrollton/Frankford DART Station, o Trinity Mills DART station, and o The Existing North Levee Trail Along Denton Creek in Coppell West of Mac. Arthur Blvd.
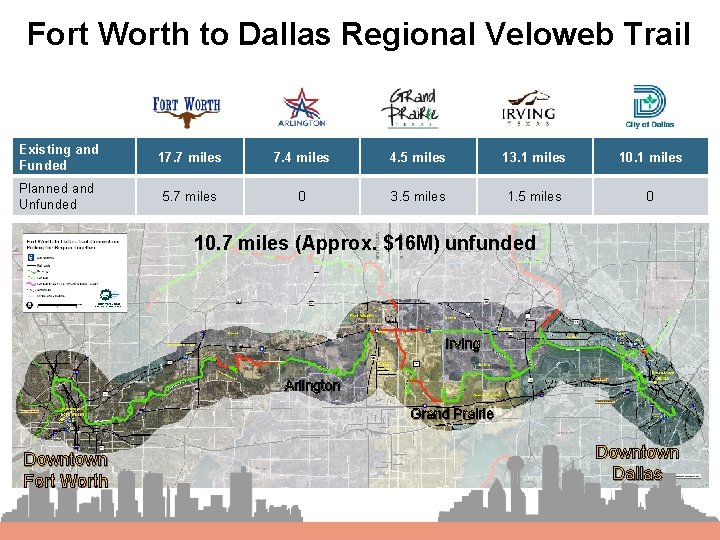
Fort Worth to Dallas Regional Veloweb Trail Existing and Funded 17. 7 miles 7. 4 miles 4. 5 miles 13. 1 miles 10. 1 miles Planned and Unfunded 5. 7 miles 0 3. 5 miles 1. 5 miles 0 10. 7 miles (Approx. $16 M) unfunded Irving Arlington Grand Prairie Downtown Fort Worth Downtown Dallas
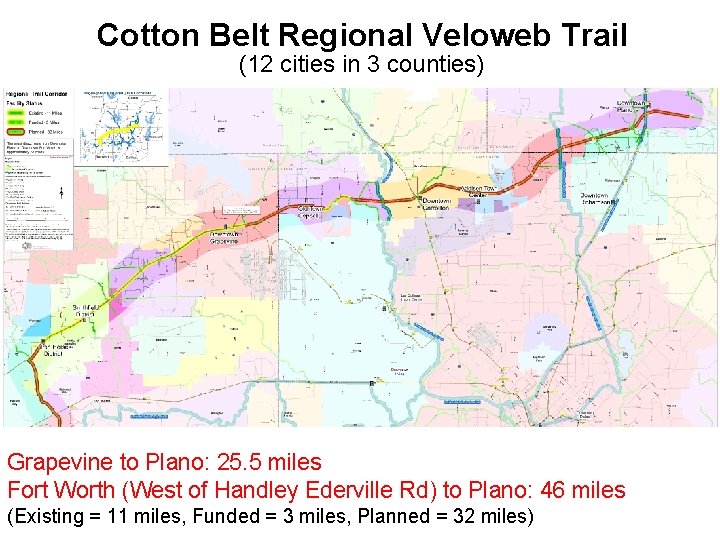
Cotton Belt Regional Veloweb Trail (12 cities in 3 counties) 12 Grapevine to Plano: 25. 5 miles Fort Worth (West of Handley Ederville Rd) to Plano: 46 miles (Existing = 11 miles, Funded = 3 miles, Planned = 32 miles)

What are Complete Streets? Multimodal Complete Streets There is no singular design prescription for Complete Streets; Source: City of Dallas each one is unique and responds to its community context. They are designed and operated to enable safe access for all users, including pedestrians, bicyclists, motorists and transit riders of all ages and abilities. Source: Smart Growth America
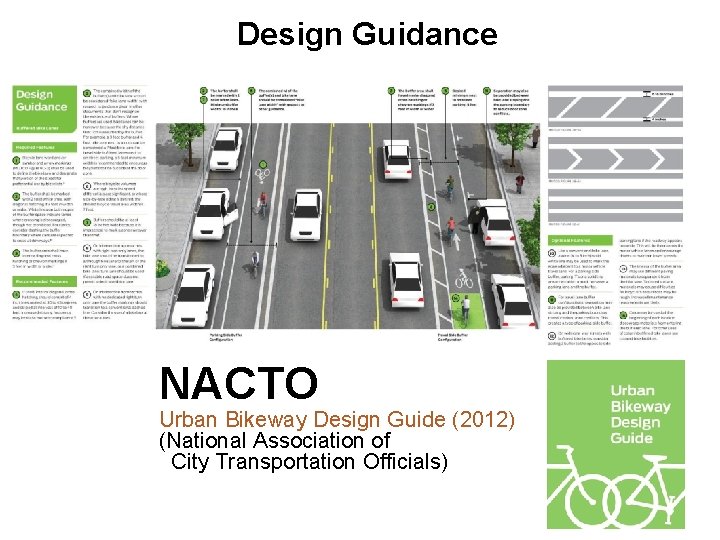
Design Guidance NACTO Urban Bikeway Design Guide (2012) (National Association of City Transportation Officials)
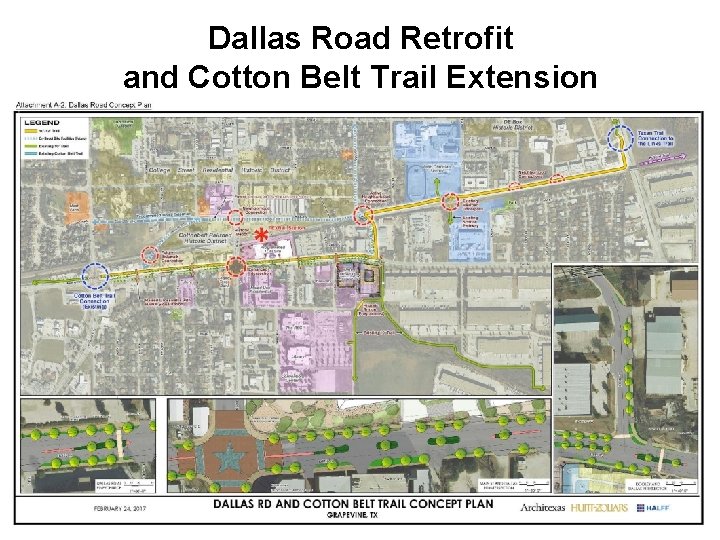
Dallas Road Retrofit and Cotton Belt Trail Extension

“A true walkable radius does not typically exist. ” Pedestrian and Bicycle Routes to Rail Stations Distance and gaps in the actual “Routes” to stations (walksheds) Barriers and Gaps in the Network Rail Station Destination nctcog. org/Routes. To. Rail 0. 5 mile 0. 5+ Disconnected actual mile pedestrian walk facility distance
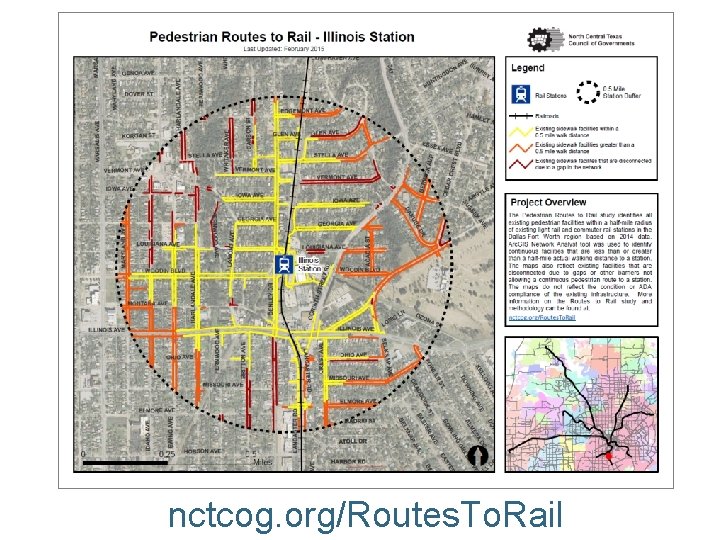
nctcog. org/Routes. To. Rail
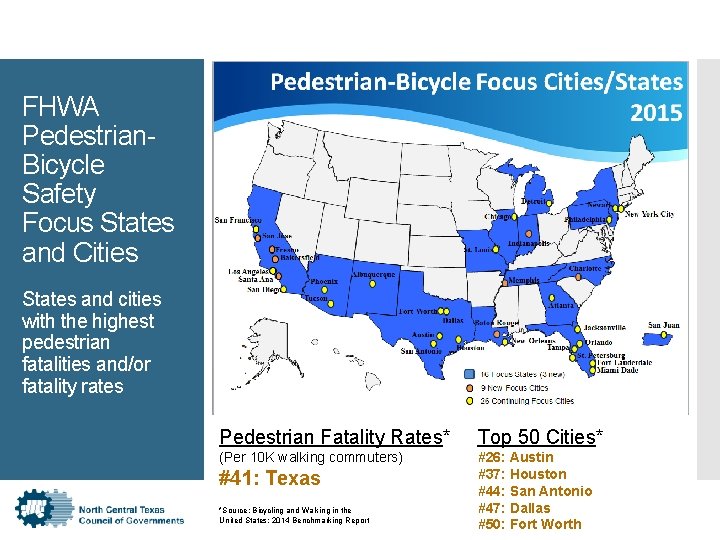
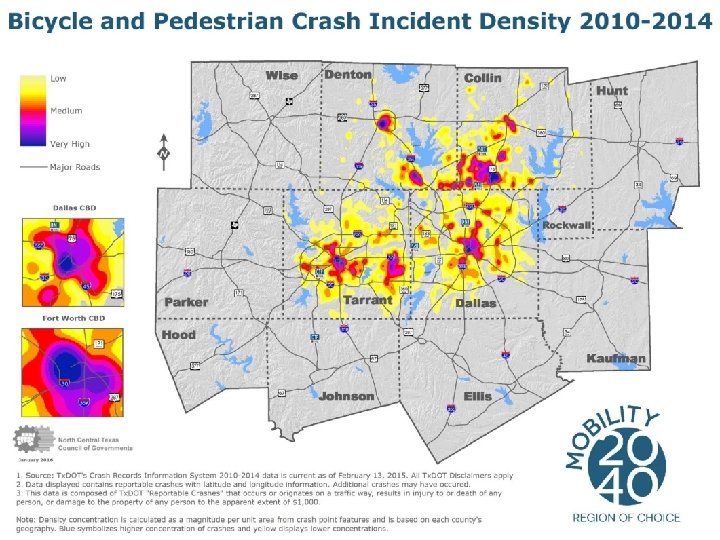
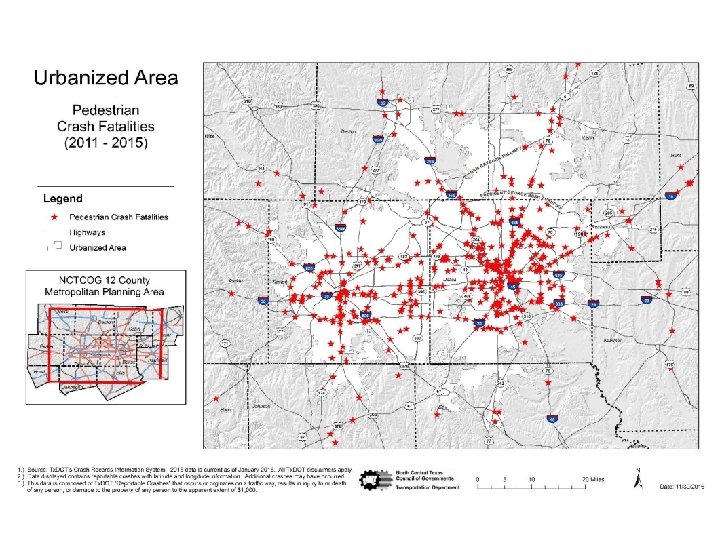
FHWA Pedestrian. Bicycle Safety Focus States and Cities States and cities with the highest pedestrian fatalities and/or fatality rates Pedestrian Fatality Rates* Top 50 Cities* (Per 10 K walking commuters) #26: Austin #37: Houston #44: San Antonio #47: Dallas #50: Fort Worth #41: Texas *Source: Bicycling and Walking in the United States: 2014 Benchmarking Report
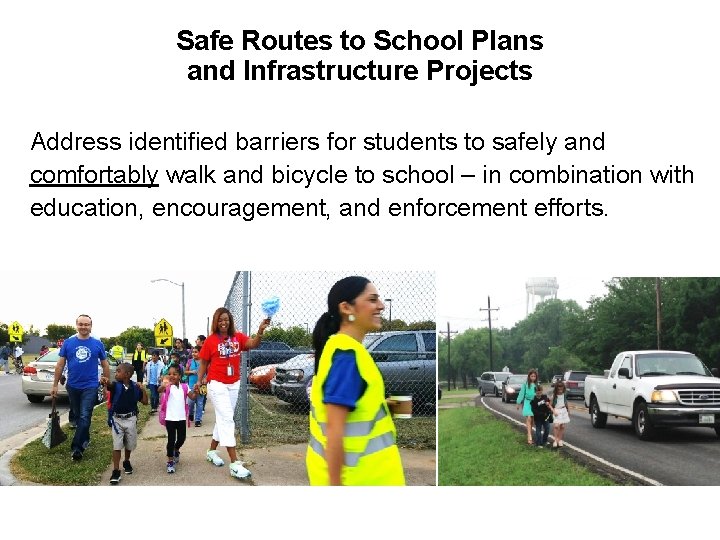
Safe Routes to School Plans and Infrastructure Projects Safe Routes to Schoolidentified barriers for students to safely and Address comfortably walk and bicycle to school – in combination with education, encouragement, and enforcement efforts.
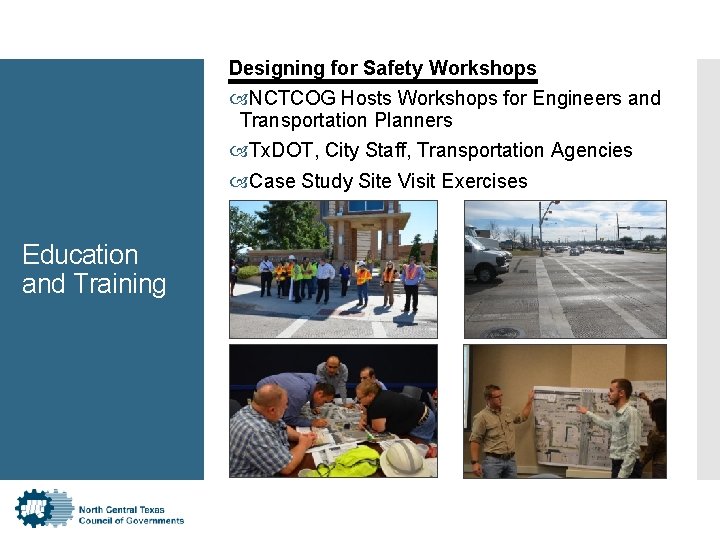
Designing for Safety Workshops NCTCOG Hosts Workshops for Engineers and Transportation Planners Tx. DOT, City Staff, Transportation Agencies Case Study Site Visit Exercises Education and Training
Kevin Kokes, AICP Principal Transportation Planner kkokes@nctcog. org (817) 695 -9275 nctcog. org/bikeped American Council of Engineering Companies of Dallas January 22, 2018
- Slides: 23