Missouri River Mainstem System MidWest Electric Consumers Association


- Slides: 19
Missouri River Mainstem System Mid-West Electric Consumers Association Meeting June 2015 Mike Swenson, P. E. Power Production Team Lead Missouri River Basin Water Management US Army Corps of Engineers BUILDING STRONG®
Current Reservoir Levels – Jun 22, 2015 Fort Peck Exclusive Flood Control Annual Flood Control & Multiple Use 2252. 3 2246 2237. 1 2234 Carryover Multiple Use 2030 1619. 7 1620 1617 1611. 8 1607. 5 Carryover Multiple Use 1837. 5 1805. 8 1540 1775 Permanent Pool 1673 5. 9 feet into Annual Flood Control Zone. System Storage Exclusive Flood Control Annual Flood Control & Multiple Use 72. 8 72. 4 67. 7 61. 0 56. 1 33. 9 Permanent Pool 17. 6 0 1415 4. 3 feet above the Annual Flood Control Zone. 1854 1850 1843. 4 Carryover Multiple Use 1570. 2 Permanent Pool 1854. 8 Exclusive Flood Control Annual Flood Control & Multiple Use 2160 3. 1 feet into Annual Flood Control Zone. Oahe Garrison Carryover Multiple Use 2196. 2 Permanent Pool Exclusive Flood Control Annual Flood Control & Multiple Use 2250 4. 9 MAF into Annual Flood Control Zone.
Plains Snowpack Peak Date: Feb 4, 2015 Source: NOAA National Operational Hydrologic Remote Sensing Center (NOHRSC)
Missouri River Basin – Mountain Snowpack Water Content June 9, 2015 26 24 22 20 18 16 14 12 10 8 6 4 2 0 Total Fort Peck to Garrison Inches of Water Equivalent Total above Fort Peck О Н Д Я ФМ А М И И А С 2014 -15 1981 -2010 Ave Peaked March 9, 72% of the normal peak 26 24 22 20 18 16 14 12 10 8 6 4 2 0 О Н Д Я ФМ А М И И А С 2014 -15 1981 -2010 Ave Peaked March 9, 78% of the normal peak The Missouri River Basin mountain snowpack normally peaks near April 15
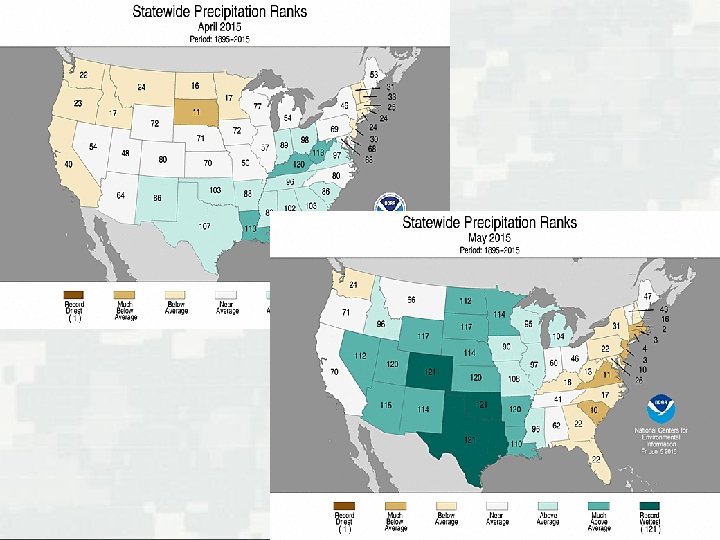
30 -Day Precipitation – Percent of Normal
Drought Monitor Source: National Drought Mitigation Center
Precipitation Outlooks July Source: NOAA Climate Prediction Center Jul – Aug – Sep
Annual Runoff above Sioux City, IA 70 Million Acre-Feet Historic Drought Periods 60 50 40 2015 Forecast 30 Median 20 10 0 1890 1900 1910 1920 1930 1940 1950 1960 1970 1980 1990 2000 2010
Missouri River Runoff above Sioux City, IA 2015 Actual and Forecasted 6 Million Acre-Feet 5 4 3 2 1 0 Jan Feb Mar Apr May Jun Jul Actual Normal Aug Sep Forecast Oct Nov Dec
Thousands System Storage 75 June 1 Forecast Million Acre-Feet Top of Exclusive Flood Control – 72. 4 MAF 70 Base of Exclusive Flood Control – 67. 7 MAF 65 60 Upper Basic Base of Annual Flood Control – 56. 1 MAF 55 Basic Lower Basic 50 System Storage Check 45 J F M A M J J 2014 A S O N D J F M A M J J 2015 A S O N D J F 2016
Mainstem System Generation 16 Million MWhs 14. 6 14 13. 5 12 10 11. 2 10. 4 9. 4 10. 0 11. 1 10. 3 9. 6 8. 7 8 6 7. 5 6. 1 5. 2 9. 6 9. 1 9. 2 7. 6 6. 5 5. 6 6. 3 4. 9 4 2 0 1967 -2014 93 94 95 96 97 98 99 00 01 02 03 04 05 06 07 08 09 10 11 12 13 14 UB Med LB Average June 1, 2015 Forecast
Missouri River Mainstem System Forecasted Energy Generation 1600 Energy in GWh 1400 1200 1000 800 600 400 200 0 Jan Feb Mar Apr May Jun Jul Aug Sep Oct 2015 Actual Upper Basic: 9, 600 GWh Basic: 9, 100 GWh Lower Basic: 9, 200 GWh Forecast 1967 -2014 Nov Dec J 16 F 16
2015 Reservoir Operations § Flood Control ► ► ► All 2014 flood water evacuated by early January Storage space available to capture runoff and reduce releases for downstream events Releases reduced to minimize downstream impacts § Navigation ► ► ► Full service flow support to start season Full service flow support following July 1 storage check Full length navigation season +10 -day (? ) 9. 8(? ) § Hydropower: annual generation forecast is 9. 1 Bk. Wh § Recreation, water supply and irrigation ► ► Normal releases, near normal reservoir levels Winter release of 14, 000 cfs from Gavins Point under Basic § Fish and Wildlife / Endangered Species ► ► Generally rising reservoirs at all three upper reservoirs during fish spawn No March and May spring pulses from Gavins Point BUILDING STRONG®
BUILDING STRONG®
Missouri River Mainstem System Forecasted Energy Generation 1600 Energy in GWh 1400 1200 1000 800 600 400 200 0 Jan Feb Mar Apr May Jun Jul Aug Sep 2015 Actual Upper Basic: 9, 600 GWh Basic: 9, 100 GWh Lower Basic: 9, 200 GWh Forecast 1967 -2014 Oct Nov Dec J 16 F 16
Mainstem System Generation 16 Million MWhs 14. 6 14 13. 5 12 10 11. 2 10. 4 9. 4 10. 0 11. 1 10. 3 9. 6 8. 7 7. 5 6. 1 5. 2 9. 1 8. 7 8 6 9. 6 7. 6 6. 5 5. 6 6. 3 4. 9 4 2 0 93 94 95 96 97 98 99 00 01 02 03 04 05 06 07 08 09 10 11 12 13 14 1967 -2014 Average UB Med LB June 1, 2015 Forecast
60 -Day Precipitation – Percent of Normal Ending mid-April
60 -Day Precipitation – Percent of Normal