
MISIC Regional Meeting Spring 2016 NWEA Iowa Team

- Slides: 14
MISIC Regional Meeting Spring 2016 NWEA Iowa Team Jessica Knierim – Account Manager Sue Madagan – Regional Manager
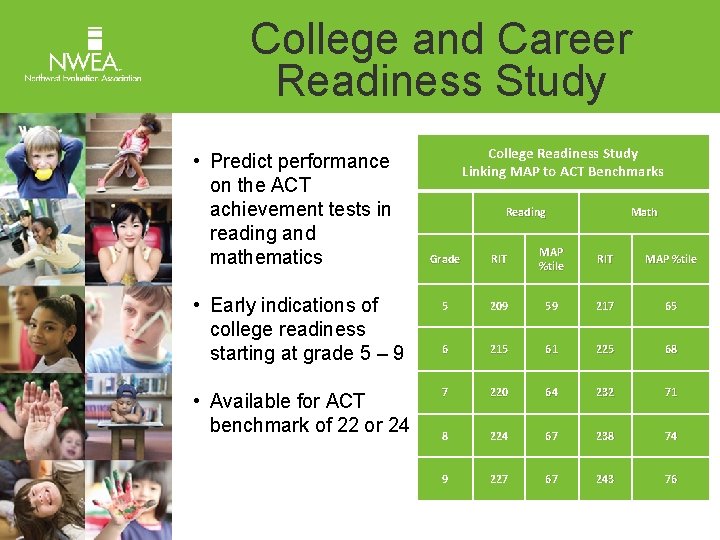
College and Career Readiness Study • Predict performance on the ACT achievement tests in reading and mathematics College Readiness Study Linking MAP to ACT Benchmarks Reading Math Grade RIT MAP %tile • Early indications of college readiness starting at grade 5 – 9 5 209 59 217 65 6 215 61 225 68 • Available for ACT benchmark of 22 or 24 7 220 64 232 71 8 224 67 238 74 9 227 67 243 76
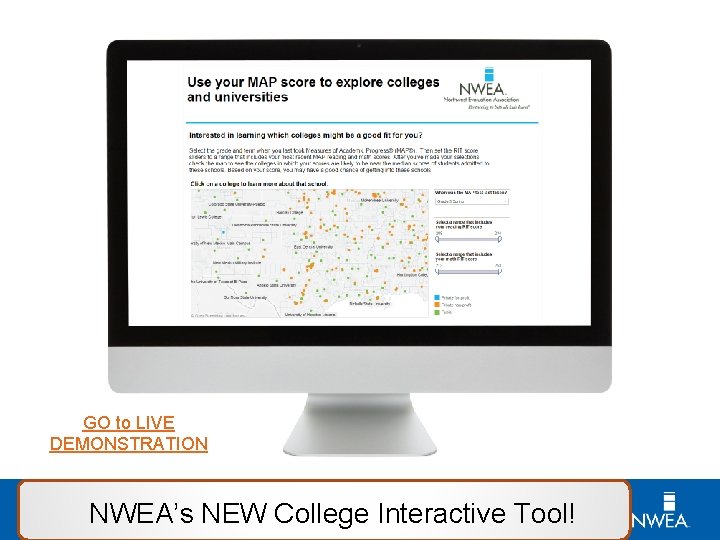
GO to LIVE DEMONSTRATION The Test NEW College Interactive Tool! NWEA’s
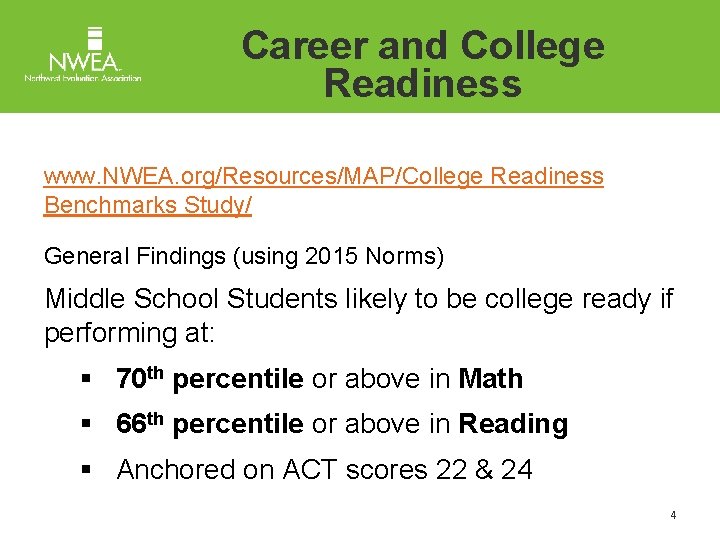
Career and College Readiness www. NWEA. org/Resources/MAP/College Readiness Benchmarks Study/ General Findings (using 2015 Norms) Middle School Students likely to be college ready if performing at: § 70 th percentile or above in Math § 66 th percentile or above in Reading § Anchored on ACT scores 22 & 24 4
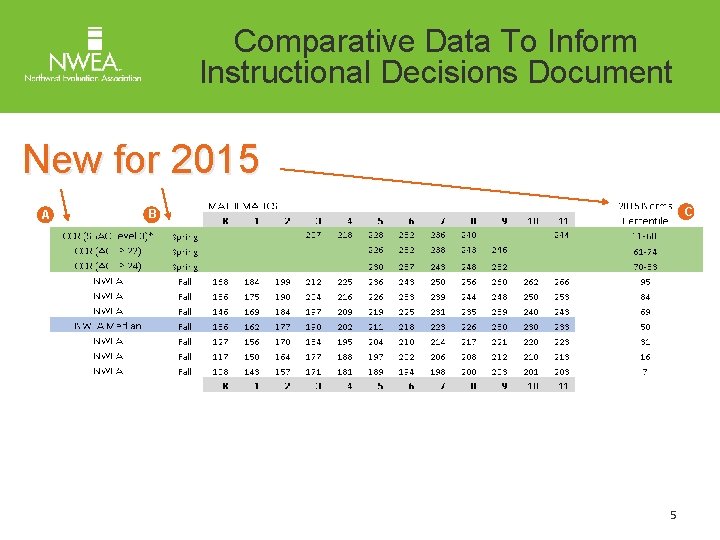
Comparative Data To Inform Instructional Decisions Document New for 2015 A C B 5
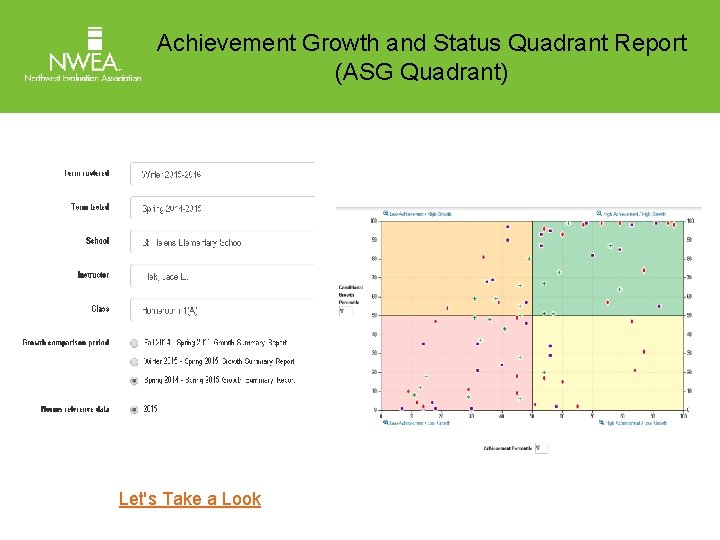
Achievement Growth and Status Quadrant Report (ASG Quadrant) Let's Take a Look
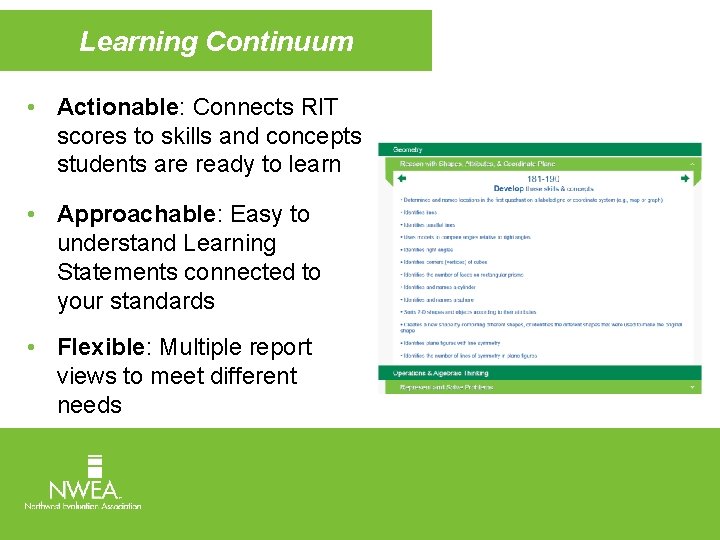
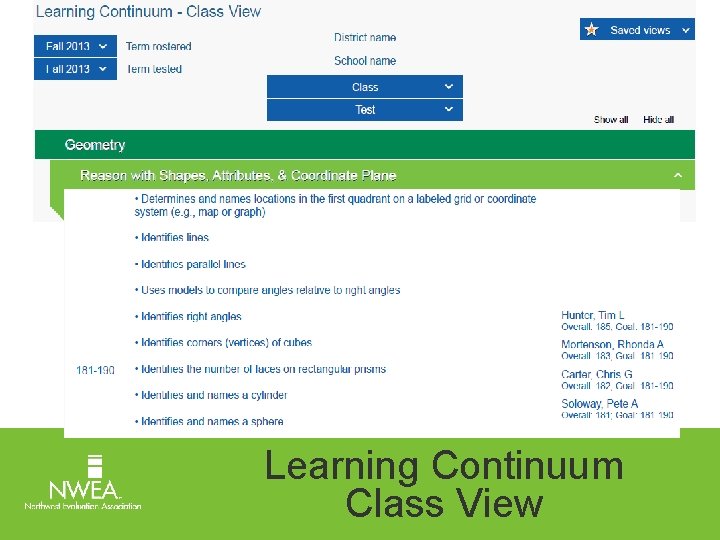
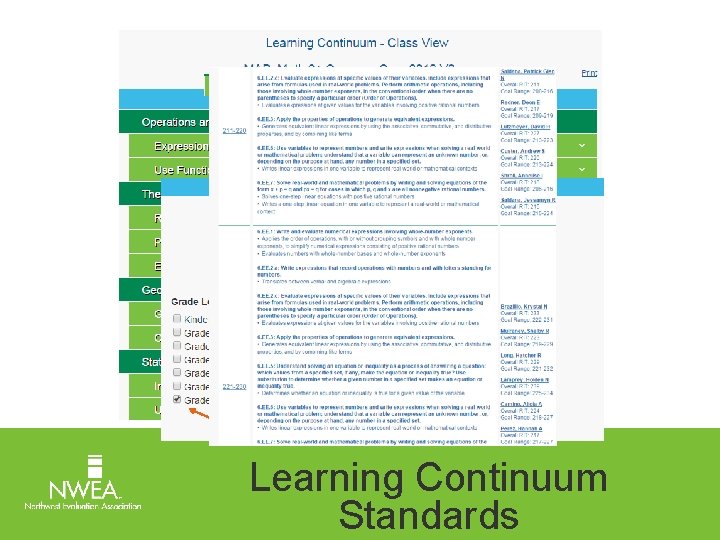
Learning Continuum • Actionable: Connects RIT scores to skills and concepts students are ready to learn • Approachable: Easy to understand Learning Statements connected to your standards • Flexible: Multiple report views to meet different needs
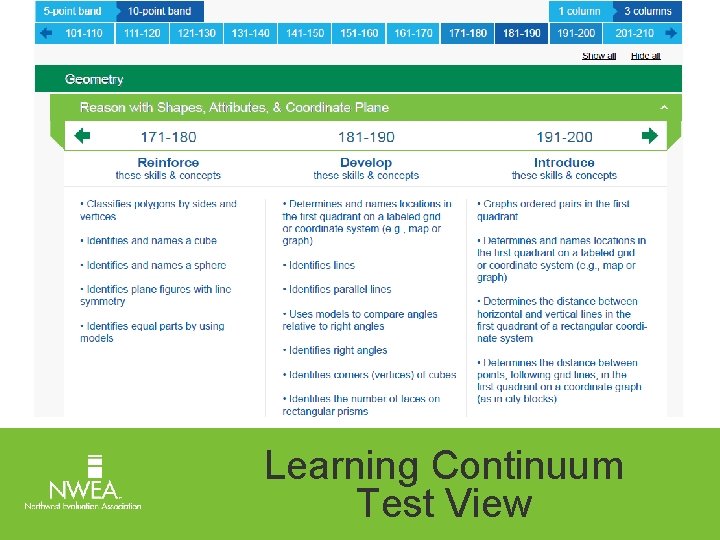
Learning Continuum Test View
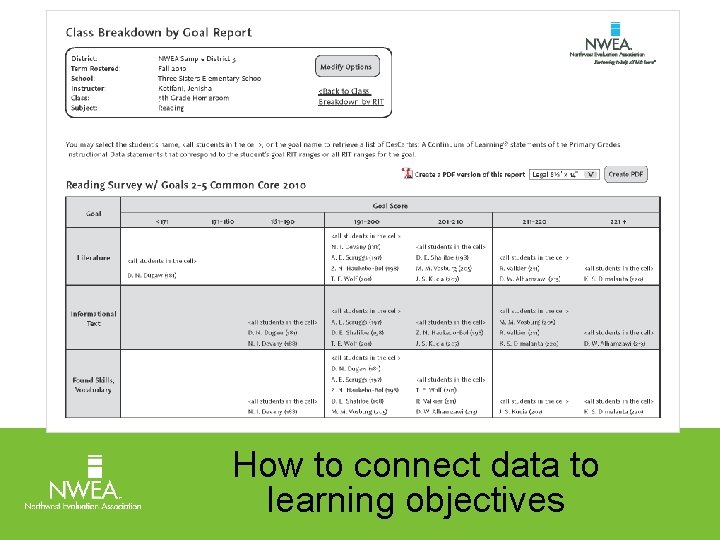
How to connect data to learning objectives
Learning Continuum Class View
Learning Continuum Standards
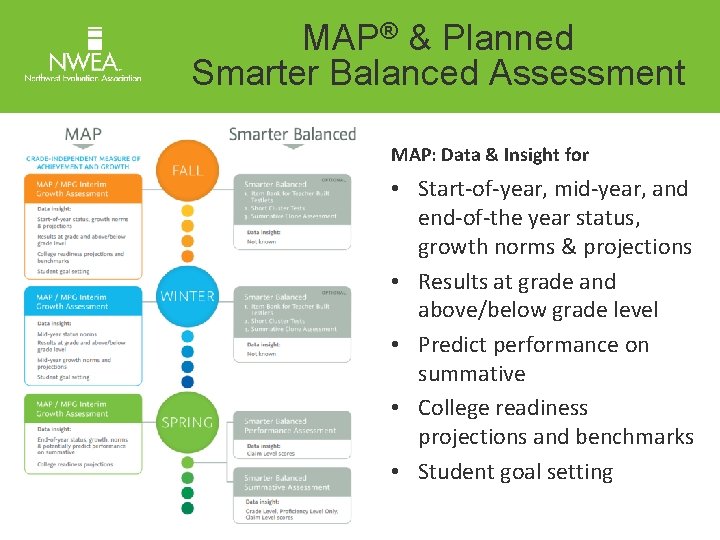
MAP® & Planned Smarter Balanced Assessment MAP: Data & Insight for • Start-of-year, mid-year, and end-of-the year status, growth norms & projections • Results at grade and above/below grade level • Predict performance on summative • College readiness projections and benchmarks • Student goal setting
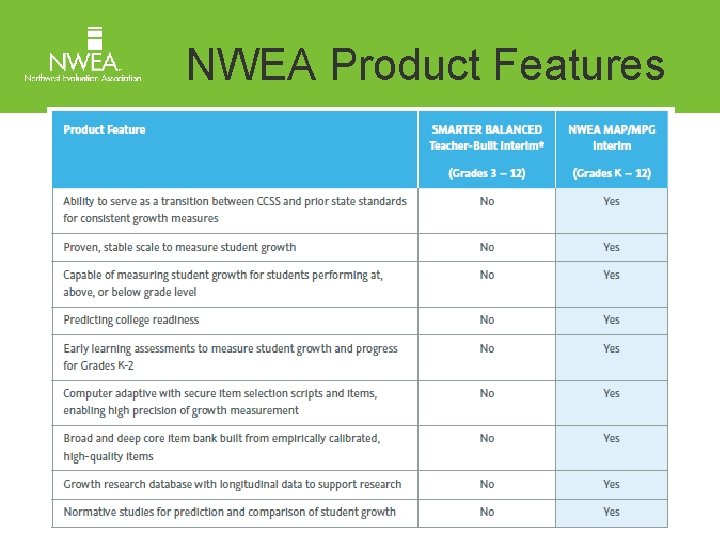
NWEA Product Features
Thank you for your time today! Questions? Jessica. Knierim@nwea. org