Minority Political Participation Political Science 61 ChicanoLatino Studies


- Slides: 22

Minority Political Participation Political Science 61 / Chicano/Latino Studies 64 November 6, 2007

Dilemma in Pluralism n Some groups excluded from participation and, consequently, have less voice in the debate n n n Formal/de jure exclusion—apartheid Informal/de facto exclusion—some groups have higher shares of people who do not participate Consequently, some groups have greater access than others n n Governmental outcomes disproportionately reflect these interests “The flaw in the pluralist heaven is that the heavenly chorus sings with a strong upper-class accent” – E. E. Schattschneider

Consequence n n Minorities (and other groups with limited participation and limited resources) are less likely to be represented in governing institutions The interests (the attitudes and values) of these lower-participating groups are less likely to shape policy

Mean Number of Political Acts, by Race/Ethnicity (range 0 to 4)

Political Activities by Race/Ethnicity

Level of Engagement Among Those Engaged n Mean hours contributed to campaigns n n Latinos— 8. 9 Latino citizens— 9. 2 African Americans— 11. 4 Anglos— 6. 8 n Dollars contributed n n Latinos--$177 Latino citizens--$194 African Americans--$165 Anglos--$257

Vote, 2004 Presidential Election, By Race/Ethnicity Source: Census Bureau, except Muslim data (poll)

Voter Turnout Among Registered, 2004 Election ?

Participation in Midterm Elections Generally Lower (Non-Hispanic) Whites – 50% +/Blacks – 43% +/Asian/Pacific Islander – 31% +/Latino – 30% +/-

Participation Differences at the Individual Level – Composition n Demographics n n n Age Education Income Minority communities more likely to be younger, less educated, and with lower incomes Political socialization / political learning Culture/nationalism n n Risk of ascription Does explain (non-)behavior for small share of blacks and Latinos

Mobilizing Institutions in Decay n Last wave of immigrants had institutions to train them in politics n n n Parties Local political machines/bosses Unions Community organizations under the control/influence of the party/political boss Churches face legal difficulties in political mobilization

Can These Gaps Be Overcome? n Yes n n n Immediately after VRA, Blacks voted at rates higher than whites, controlling for demographics Black institutions connected people to the ballot box Can this experience be repeated? Yes, when there are: n Incentives for minorities to participate, and Mobilization to encourage participation n Examples n n California Latino vote, 1994 / 1996 Florida Black vote 2004 Muslims in 2004 election

Newly Emerging Institutions of Mobilization n Churches n n n Unions, particularly service unions n n Christian right (little impact on minority participation) Bush campaign religious outreach 2004 (some effect on minorities in New Mexico, Ohio, and Florida) Felt in large cities Technology? n n Initial effect of technology will be felt more in majority communities (enlarging the gap) “Air war” versus “ground war” – Why Rock the Vote sounds good on paper, but doesn’t change much on the ground

Can Campaigns Make a Difference? n Or, Will There Be an Obama Effect? Positive Examples n n n Viva Kennedy (1960) – Increased Mexican American vote Jesse Jackson (1984) – Increased Black primary vote Adelante Con Clinton-Gore! (1996) – Increased Democratic share of general election vote Many negative examples (How not to target minority voters) Even the successful efforts do not have a sustained impact

Can Minority Candidates Make a Difference? Mobilization of minority voters may be outweighed by countermobilization of white voters in the other direction

2006 Unique – Five Black Statewide Candidates n n n Deval Patrick (Governor – MA – D) [56 -35] Harold Ford (Senate – TN - D) [48 -51] Michael Steele (Senate – MD – R) [44 -54] Lynn Swann (Governor – PA – R) [40 -60] Kenneth Blackwell (Governor – OH – R) [37 -60] Also, Latinos n n Robert Menendez [53 -45] (re)election to Senate (NJ) Bill Richardson [69 -31] as Governor (NM)

Opportunity to Test Effect of Race and Partisanship n Maryland n Black support n n n Michael Steele (Senate - R) – 25% White Republican candidate for Governor (Erlich) – 15% White support n n Steele – 50% Erlich – 54%

Pennsylvania n Black support n n n Lynn Swann (Governor - R) – 13% White Republican candidate for Senator (Santorum) – 10% White support n n Swann – 43% Santorum – 45%

Ohio n Black support n n n Kenneth Blackwell (Governor - R) – 20% White Republican candidate for Senator (De. Wine) – 15% White support n n Blackwell – 40% De. Wine – 48%

Tennessee n Black support n n n Harold Ford, Jr. (Senator - D) – 95% White Democratic candidate for Governor (Phil Bredesen) – 94% White support n n Ford, Jr. – 40% Bredesen – 66%

So? n Two patterns n Some blacks will vote for Black Republicans who won’t vote for white Republicans n n Black Democrats receive near unanimous black support Whites less likely to support Black candidates than white candidates n Harold Ford would have won with white support comparable to Bredesen

Question for Next Time What distinguishes white support for “Gregory Hammond” when they think he’s white and when they think he’s black?
 Gambar
 Milbrath
 Gladiatorial political participation
 What is her favourite subject
 Paradigm shift from women studies to gender studies
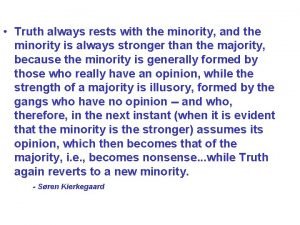
 Truth always rests with the minority
 Define minority group
 3 behaviours that enable a minority to influence a majority
 Define minority group
 Continuity equation in semiconductor
 Difference between pnp and npn
 Meaning of minority language
 Control account purpose
 Minority interest example
 Majority-minority districts definition ap human geography
 Minority contractors near me
 Difference between majority and minority carriers
 Language
 Office of minority health resource center
 Doctoral initiative on minority attrition and completion
 Tri state minority supplier development council
 Minority consent dalam sosiologi adalah
 Silent minority


