Mining User Similarity Based on Location History Yu

Mining User Similarity Based on Location History Yu Zheng, Quannan Li, Xing Xie Microsoft Research Asia

Outline • Introduction • Architecture – Modeling Location History – Measuring User Similarity • Experimental Results • Conclusion
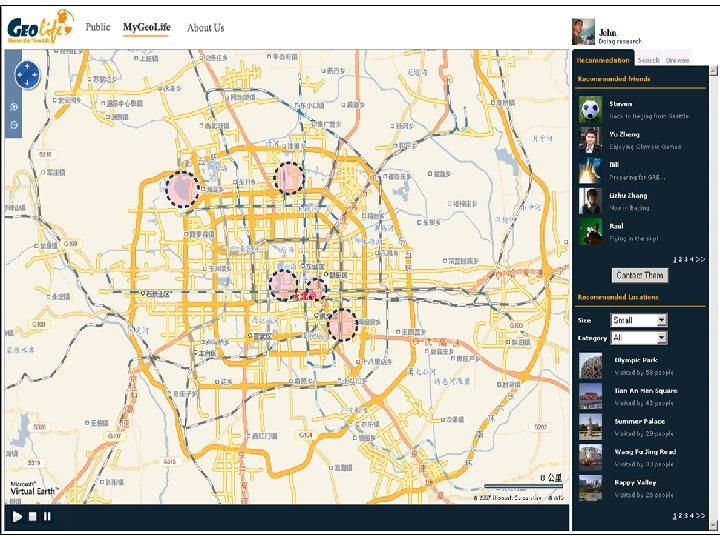
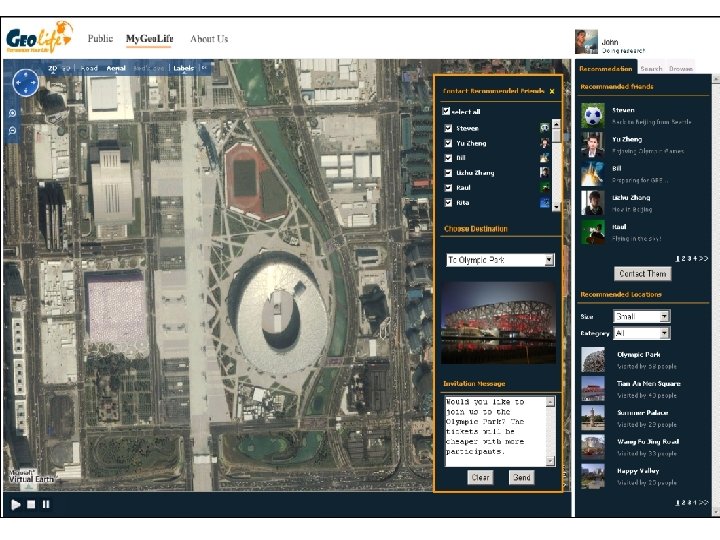
 • Goals – Inferring the similarity (correlations ) between users from their")
Introduction (1) • Goals – Inferring the similarity (correlations ) between users from their location histories – Enable friend recommendation Personalized location recommendation • Motivation – The increasing availability of user-generated trajectories • Life logging, Travel experience sharing • Sports activity analysis, Multimedia content management, … – People’s outdoor movements in the real world imply their interests • Like sports: if frequently visit gyms and stadiums • Like Travel: if usually access mountains and lakes – According to the first law of the geography • Everything is related to everything else, but near things are more related than distant things. • People with similar location histories might share similar interests and preferences. – Significance of user similarity in Web communities • Generally, it help users find more relevant information from a large-scale dataset • In GIS community: friend discovering and location recommendation
 • Difficulty & Challenges – How to model different users’ location history")
Introduction (2) • Difficulty & Challenges – How to model different users’ location history uniformly • Various users’ location histories are inconsistent and incomparable • What’s a shared location? By distance ? ? X – How to measure the similarity between users • By counting the number of shared locations ? ? • The Pearson correlation and the cosine correlation ? ? • They do not take into account two important properties of people’s outdoor movements. • Contribution and insights – A step towards integrating social networking into GIS – A hierarchical-graph • Uniformly modeling different users’ location histories on a various scales of geo-spaces – A similarity measure considering • Sequence property of users’ movement behavior • Hierarchy property of geographic spaces

Preliminary • GPS logs P and GPS trajectory • Stay points S={s 1, s 2, …, sn}. – Stands for a geo-region where a user has stayed for a while – E. g. , if a user spent more 20 minutes within a distance of 200 meters – Carry a semantic meaning beyond a raw GPS point • Location history: – represented by a sequence of stay points – with transition intervals
 Modeling Location History A Hierarchical Graph for each individual Measuring Similarity A")
Architecture (1) Modeling Location History A Hierarchical Graph for each individual Measuring Similarity A similarity score Sij for each pair of users
 1. Stay point detection 2. Hierarchical clustering 3. Individual graph")
Modeling Location History (1) 1. Stay point detection 2. Hierarchical clustering 3. Individual graph building Modeling Location History A Hierarchical Graph for each individual Measuring Similarity A similarity score Sij for each pair of users
 1. Stay point detection 2. Hierarchical clustering 3. Individual graph")
Modeling Location History (2) 1. Stay point detection 2. Hierarchical clustering 3. Individual graph building
 Modeling Location History A Hierarchical Graph for each individual 1.")
Measuring User Similarity (1) Modeling Location History A Hierarchical Graph for each individual 1. Sequence Extraction 2. Sequence Matching 3. Similarity Score Calculating Measuring Similarity A similarity score Sij for each pair of users
 • Similar sequence Extraction")
, , Measuring Similarity (2) • Similar sequence Extraction
 • Sequence matching – We aim to find out the maximum-length")
Measuring Similarity (3) • Sequence matching – We aim to find out the maximum-length similar sequence – A pair of similar sequence: two individuals share the property of visiting the same sequence of places with a similar time interval Same visiting order: ai == bi Similar transition time: B A X A C A B C X √
 • Similarity Calculating – Two factors • The length")
, , Measuring Similarity (4) • Similarity Calculating – Two factors • The length of the matched similar sequence • The level of the matched similar sequence – Calculation 1. Calculating similarity score for each sequence (weighted by its length) 2. Adding up similarity score of each sequence found on a level 3. Weighted Summing up the score of multiple levels
 User 1: User 3> User 2 A B User 1: A")
Measuring Similarity (5) User 1: User 3> User 2 A B User 1: A B User 2: A B User 1: a c e User 2: b d A B User 1: A B User 3: A B c e User 1: a c e User 3: b c e
 • GPS Devices and Users – 112 users collecting the data in")
Experiments (1) • GPS Devices and Users – 112 users collecting the data in the past year
 • GPS dataset – > 6 million GPS points – > 170,")
Experiments (2) • GPS dataset – > 6 million GPS points – > 170, 000 kilometers – 36 cities in China and a few city in the USA, Korea and Japan
 • Evaluation approach – Evaluated as an information retrieval problem – Ground")
Experiments (3) • Evaluation approach – Evaluated as an information retrieval problem – Ground truth: Users label the relationship with a ratings show in this Table Relevance level Relationships suggestion 4 Strongly similar Family members/intimate lovers/roommate 3 Similar Good friends/workmates/classmates 2 Weakly similar Ordinary friends, neighbors in a community 1 Different Strangers in the same city 0 Quite different Strangers in other cities
 • Comparing with baselines – The Pearson Correlation – Cosine Similarity")
Experiments (4) • Comparing with baselines – The Pearson Correlation – Cosine Similarity
 • NDCG comparison")
Experiments (5) • NDCG comparison

Conclusion • A hierarchical graph – A uniform framework to measure various users’ location histories – Effectively modeling users’ outdoor movements • Sequentially • Hierarchically • Our similarity measurement outperformed existing methods – The Person measurement and – Cosine similarity measurement – Hierarchy + Sequence achieved the best performance

Thanks! Microsoft Research Asia yuzheng@microsoft. com
- Slides: 22