Miniature worlds Bromeliad food webs as a model

Miniature worlds: Bromeliad food webs as a model system for ecology Diane Srivastava

The idea of the archetype If we have a precise knowledge of that which constitutes the typical structure of each of these groups, we shall have, so far, an exhaustive knowledge of the Animal Kingdom. - T. H. Huxley (1869)

• Easily manipulated • Many replicates possible • Quick response time

? • Easily manipulated • Many replicates possible • Quick response time

• Real ecosystem, co-evolved species! • Difficult to manipulate • Low replication • Slow response time

General ecological principles ? • Real ecosystem, co-evolved species! • Difficult to manipulate • Low replication • Slow response time

? “Replication vs. realism” -David Schindler

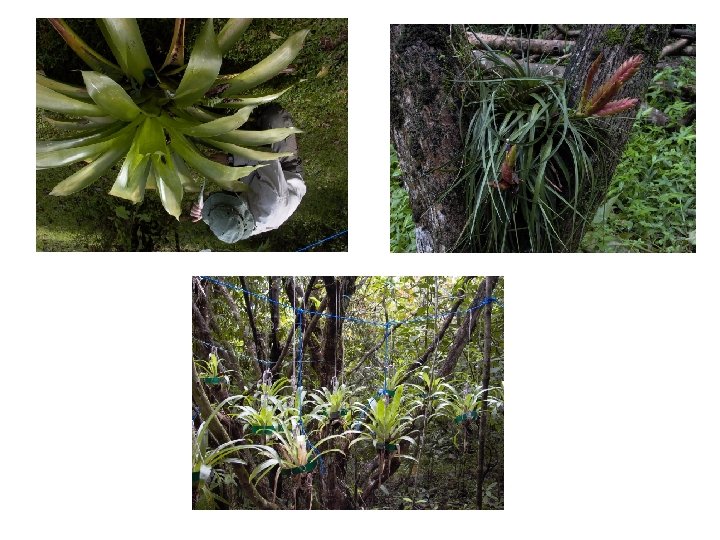
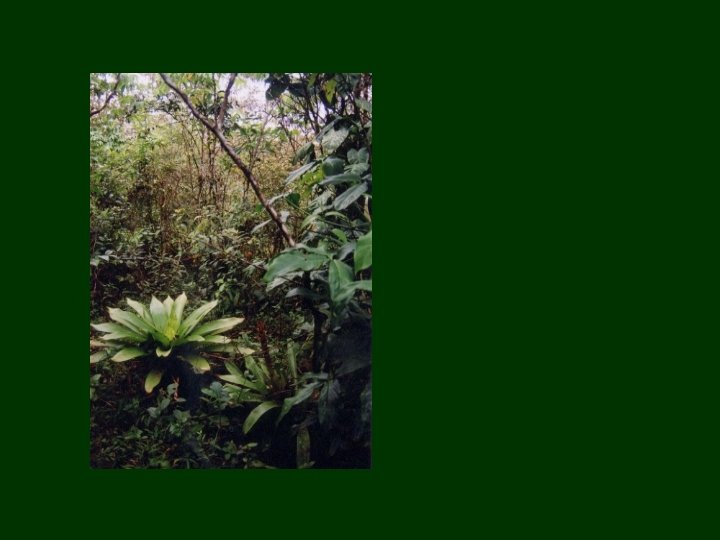
Container habitats

c. William H. Bond

Bromeliad food web Intermediate predators Microbial Food web c. William H. Bond Detritus Bacteria, fungi

Rotifers Flagellates Bacteria, fungi Ciliates

Why bromeliads are useful systems • Discrete, simple food webs Number of trophic levels (with M. Melnychuk, J. Ware)

Why bromeliads are useful systems • Discrete, simple food webs • Stable manipulations of community structure Effect of habitat complexity on trophic cascades

Why bromeliads are useful systems • Discrete, simple food webs • Stable manipulations of community structure • Scale of population dynamics differs with taxa Extinction cascades (with T. Bell)

Why bromeliads are useful systems • Discrete, simple food webs • Stable manipulations of community structure • Scale of population dynamics differs with taxa • Similar habitat occurs over broad geographic range Biogeographical comparisons (B. Richardson) • Contained ecosystem for nutrient budgets Insects and bromeliad growth? (A. Reich, J. Ngai)

Does energy limit the number of trophic levels?
.")
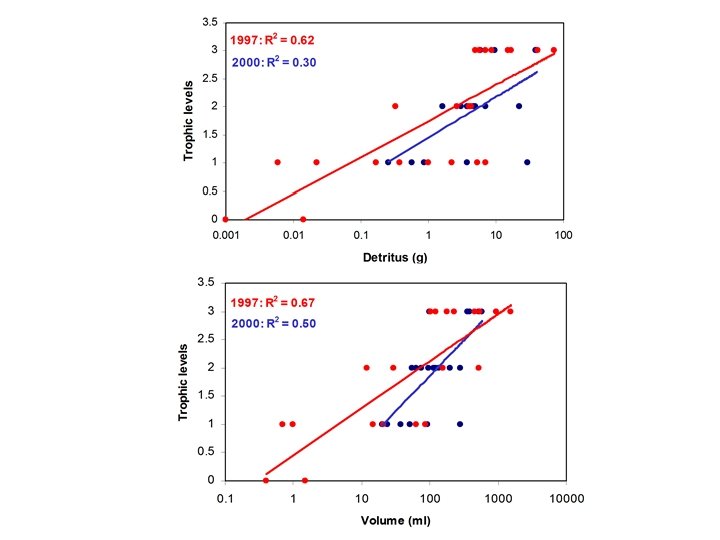
Theory: Energy is lost in the transfer between trophic levels (about 10% transfer efficiency). If energy is limiting, trophic diversity will be a logarithmic function of basal energy (every 10 x increase in energy can support one more trophic level).
.")
Theory: Energy is lost in the transfer between trophic levels (about 10% transfer efficiency). If energy is limiting, trophic diversity will be a logarithmic function of basal energy (every 10 x increase in energy can support one more trophic level). Problem: Difficult to quantify basal energy, number of trophic levels

• 10 x increase in energy correlated with < 1 trophic level • Intraguild predation will decrease trophic levels • Covariates?

No damselfly larvae below 100 ml capacity
")
1997 Damselflies present Damselflies absent 2000 Bromeliad capacity (ml)
 1997 Damselflies present Damselflies absent 2000 Bromeliad")
Prey available (g per M. modesta larva) 1997 Damselflies present Damselflies absent 2000 Bromeliad capacity (ml)
")
Larva survived Larva missing Bromeliad capacity (ml)
 Larva survived Larva missing Bromeliad capacity")
Growth rate, corrected for initial mass (g day-1) Larva survived Larva missing Bromeliad capacity (ml)

Effect of habitat complexity on trophic cascades

Theory: Trophic cascades occur when there are strong linear trophic links. Habitat complexity may increase predator search time, or increase prey survival (refuges)

Theory: Trophic cascades occur when there are strong linear trophic links. Habitat complexity may increase predator search time, or increase prey survival (refuges) Problems: Manipulating habitat complexity, isolating effects on predators and prey

Experimental design Top trophic level

Experimental design Top trophic level X Bromeliad complexity 1 leaf 3 leaves 6 leaves

Experimental design Top trophic level X Bromeliad complexity 1 leaf 3 leaves 6 leaves X Bromeliad size (Expt. 2 only) small large

Expt. 1 = = Predation x complexity or complexity 2 P<0. 05

Expt. 1 = = Predation x complexity P<0. 0001

Insects grow more slowly in complex bromeliads

Effect of predator diminishes with complexity…and size Predator x Complexity: Detrital processing: P<0. 05 No predator - Predator 1 3 Complexity 6 Larger bromeliads also have reduced foraging efficiency Detrital processing: Small - Large 1 3 Complexity 6

Effect of predator diminishes with complexity…and size Detrital processing: No predator - Predator 1 3 Complexity 6 Larger bromeliads also have reduced foraging efficiency Detrital processing: Small - Large 1 3 Complexity 6

Effect of predator diminishes with complexity…and size Predator x Size: Detrital processing: P<0. 05 No predator - Predator 1 3 Complexity 6 Larger bromeliads also have reduced foraging efficiency Detrital processing: Small - Large 1 3 Complexity 6

Effect of predator diminishes with complexity…and size Predator x Size: Detrital processing: P<0. 05 No predator - Predator 1 3 Complexity 6 Larger bromeliads also have reduced foraging efficiency No predator: Size effect P=0. 01 Detrital processing: Predator: NO Size effect: P=0. 88 Small - Large 1 3 Complexity 6

Increased bromeliad complexity Decreased detritivore efficiency Effect on detrital processing Direct effect

Increased bromeliad complexity Trophic effect Higher trophic level present Decreased detritivore efficiency + Decreased predator efficiency Effect on detrital processing Direct effect

Increased bromeliad size Trophic effect Higher trophic level present Decreased detritivore efficiency + Decreased predator efficiency Effect on detrital processing Direct effect

Alex Reich Bromeliad growth experiment

What happens to food webs and ecosystems when species go extinct?

Theory: Declining species diversity will cause: • Loss of species at lower trophic levels (extinction cascades) • Reduction in ecosystem functions

Theory: Declining species diversity will cause: • Loss of species at lower trophic levels (extinction cascades) • Reduction in ecosystem functions Problem: Manipulating animal diversity!
 Detritus response (function)")
Experimental design extinction Top predator Detritivores response Ciliates (cascade) Detritus response (function)
 Helodid (H) Red Yellow chironomid (R) (Y) 1 species (4")
Detritivore communities Tipulid (T) Helodid (H) Red Yellow chironomid (R) (Y) 1 species (4 community types): T H R Y 2 species (6 community types): TH TR TY HR HY RY 4 species (1 community type): THRY

All communities are designed to have, theoretically, the same metabolic capacity Therefore, differences amongst communities are true effects of composition T H TH THRY

Diversity of lower level Are there extinction cascades? Diversity of higher level

No damselfly Ciliate species richness R No insects Y TR TY TH HY HR THRY RY T H H, HY, TH, TR, TY p<0. 05

No damselfly Ciliate species richness R Y TR TY TH HY RY HR THRY T H H, HY, TH, TR, TY p<0. 05

No damselfly Ciliate species richness R Y TR TY TH HY RY HR Full model (F tests, p<0. 05): THRY T H With damselfly H, HY, TH, TR, TY p<0. 05 R Y H HR HY T TR TH RY TY THRY Species identity Species interactions (TH, TR: p<0. 05) Trophic diversity x species interactions

Decomposition Does insect diversity affect decomposition? Diversity of insects

No damselfly Decomposition T TY TH H R Y HR TR HY THRY RY No insects H, R, T, Y, TY p<0. 05

No damselfly Decomposition Full model: T TY TH H R TR HR HY THRY RY Y Control H, R, T, Y, TY p<0. 05 Species identity (T, H, R, Y) Species interactions Trophic diversity (p<0. 05) Trophic x species interactions

No damselfly Decomposition Full model: T TY TH TR HR H HY R RY Y Control With damselfly THRY H, R, T, Y, TY p<0. 05 T TY H R Y TR TH RY HR THRY HY Species identity (T, H, R, Y) Species interactions Trophic diversity (p<0. 05) Trophic x species interactions

Rotifers Flagellates Bacteria, fungi Detrital processing chain Coarse particles Fine particles Ciliates
 Detrital loss Ciliate richness Ciliate density HR")
ALL SIGNIFICANT SPECIES INTERACTIONS (No damselfly bromeliads) Detrital loss Ciliate richness Ciliate density HR + HY + RY TH TR TY THRY Flagellate density + + + Rotifer density

Summary: • Evidence of indirect extinction cascades between insects and ciliates, possibly due to processing chains • Decomposition is more strongly affected by vertical (trophic levels) than horizontal (species) extinctions

Could container habitats be model systems for ecology? Simple quantifications of habitat size, complexity and basal energy Easy manipulations of diversity and trophic structure Quantifiable food webs and ecosystem functions Real co-evolved communities!

With damselfly No damselfly Ciliate density Flagellate density Rotifer density H H, TH, TR p<0. 05 H, HR p<0. 05 H H H Full model: Species identity Species interactions Trophic diversity Trophic x species interactions Full model: Species identity (H: p=0. 003) Species interactions Trophic diversity Trophic x species interactions Full model: Species identity (H: p<0. 001) Species interactions Trophic diversity Trophic x species interactions
 for species identity effects. Function = ß 0+ß 1*tip")
Interaction regressions: 1. Account (test) for species identity effects. Function = ß 0+ß 1*tip +ß 2*hel +ß 3*red +ß 4*yel Treatment Regression term T H TH THRY tip hel red yel 1 0 0. 5 0. 25 0 1 0. 5 0. 25 0 0 0 0. 25
 for species identity effects. 2. Test if multi-species communities")
Interaction regressions: 1. Account (test) for species identity effects. 2. Test if multi-species communities have functions different than expected from the “sum of their parts” (species interactions) Treatment Regression term T H TH THRY tip hel red yel tip*hel all 1 0 0. 5 0. 25 0 1 0. 5 0. 25 0 0 0 0. 25 0 0 1 Function = ß 0+ß 1*tip +ß 2*hel +ß 3*red +ß 4*yel +ß 5*tip*hel+…
 for species identity effects. 2. Test if multi-species communities")
Interaction regressions: 1. Account (test) for species identity effects. 2. Test if multi-species communities have functions different than expected from the “sum of their parts” (species interactions) Treatment Regression term T H TH THRY tip hel red yel tip*hel all 1 0 0. 5 0. 25 0 1 0. 5 0. 25 0 0 0 0. 25 0 0 1 0 3. Cross everything with trophic diversity 0 0 0 1
- Slides: 67