
Mineral Stability n What controls when and where
Mineral Stability n What controls when and where a particular mineral forms? Commonly referred to as “Rock cycle” n Rock cycle: Mineralogical changes that occur because of variations in geologic environment n n Knowing answer provides information about earth history or processes
Mineral formation n Why would you want to know earth history or processes: Find: ore deposits, oil and gas, building materials n Understand engineering hazards, water cycle n Understand how humans effect the earth: climate… n
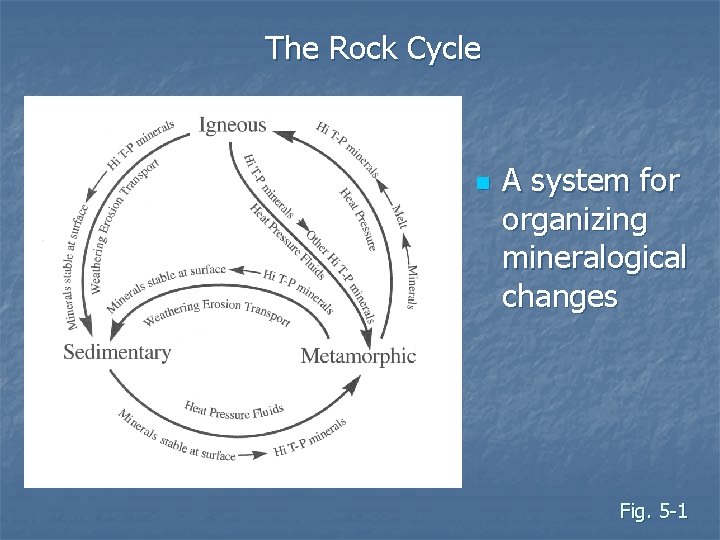
The Rock Cycle n A system for organizing mineralogical changes Fig. 5 -1
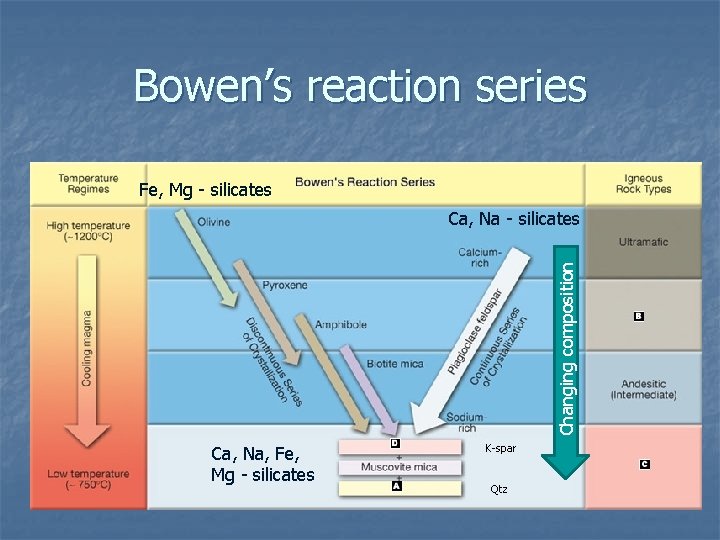
Bowen’s reaction series Fe, Mg - silicates Changing composition Ca, Na - silicates Ca, Na, Fe, Mg - silicates K-spar Qtz
3 requirements for mineral stability n Constituents n n Available reactants/elements (X) Correct environmental conditions (energy) Pressure (P) n Temperature (T) n
Mineral Stability n n More stable position is one of lower energy Minerals may not be stable – e. g. metastable minerals n n Mineral contains more energy than expected from their environment Energy required to overcome metastability – activation energy
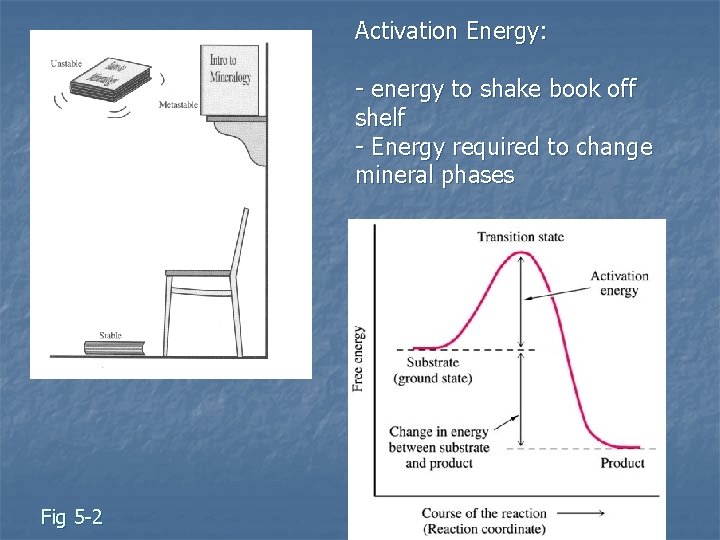
Activation Energy: - energy to shake book off shelf - Energy required to change mineral phases Fig 5 -2
How can stability be estimated? n Algebraically: Physical chemistry/Thermodynamics n Estimates of DG – Gibbs free energy n n Graphically – “phase diagrams”: Essentially figures of solutions to DG problems n Many types, common ones: n One component – P & T variable, X fixed (i. e. the component) n Two (or more) components – T & X variable, P fixed n
Components and Phases n Component – Chemical entity H 2 O n Al 2 Si. O 5 n n Phase – physically separable part of a system; e. g. for H 20: ice, water vapor n for Al 2 Si. O 5: Sillimanite, Kyanite, Andalusite n n One and two component phase diagrams n Several types of 2 -component diagrams
One component diagrams n n n Fields – where only one phase (mineral) is stable Lines – where two phases are stable simultaneously Points – where three phases are stable
One component diagrams n If P and/or T changes One phase converts to another n Examples: n H 2 O – component; ice, water, and vapor are phases n Al 2 Si. O 5 – component; Kyanite, Andalusite, Sillimanite are phases n
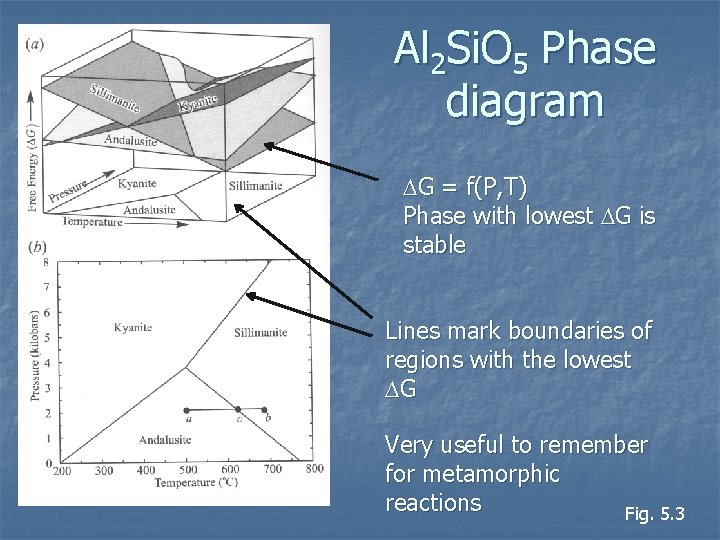
Al 2 Si. O 5 Phase diagram DG = f(P, T) Phase with lowest DG is stable Lines mark boundaries of regions with the lowest DG Very useful to remember for metamorphic reactions Fig. 5. 3
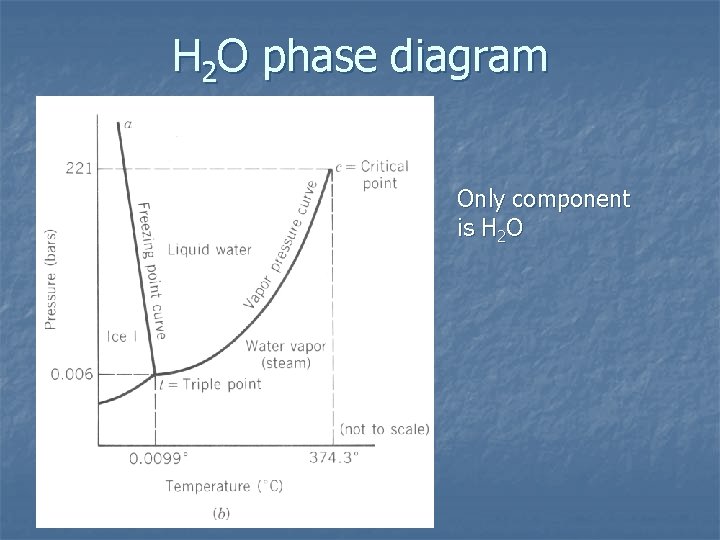
H 2 O phase diagram Only component is H 2 O
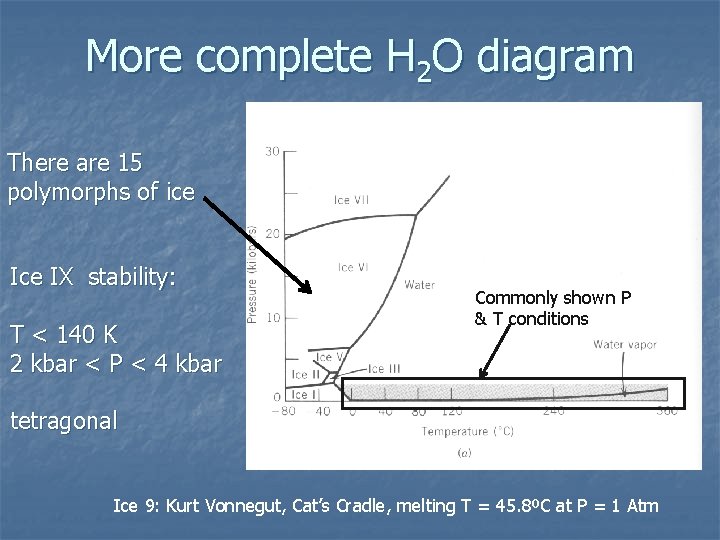
More complete H 2 O diagram There are 15 polymorphs of ice IX stability: T < 140 K 2 kbar < P < 4 kbar Commonly shown P & T conditions tetragonal Ice 9: Kurt Vonnegut, Cat’s Cradle, melting T = 45. 8ºC at P = 1 Atm
Two component phase diagrams n n What happens if there are two components in a system? Example: Plagioclase feldspars – two components with complete solid solution (at high T, otherwise “exsolution”) Albite– Na. Al. Si 3 O 8 n Anorthite – Ca. Al 2 Si 2 O 8 n Any composition in between the two end member compositions n
n n How does solid (and melt) composition vary during crystallization? How does composition vary as solids melt to form magma? OR… If you know the composition of a plagioclase feldspar, can you determine T and P of crystallization?

Two component phase diagram with complete solid solution = Na, Ca, Al, Si. O 2 = (Na, Ca)x. Aly. Siz. O 8 100% Albite – Na. Al. Si 3 O 8 Mole % Anorthite 100% Anorthite – Ca. Al 2 Si 2 O 8
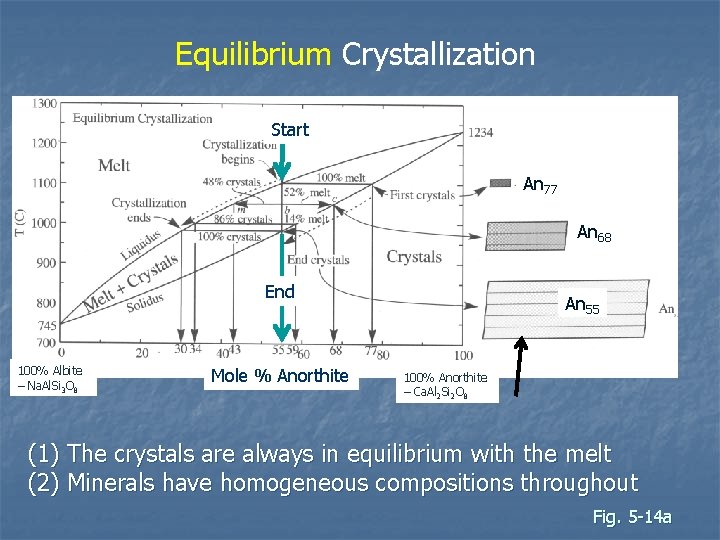
Equilibrium Crystallization Start An 77 An 68 End 100% Albite – Na. Al. Si 3 O 8 Mole % Anorthite An 55 100% Anorthite – Ca. Al 2 Si 2 O 8 (1) The crystals are always in equilibrium with the melt (2) Minerals have homogeneous compositions throughout Fig. 5 -14 a
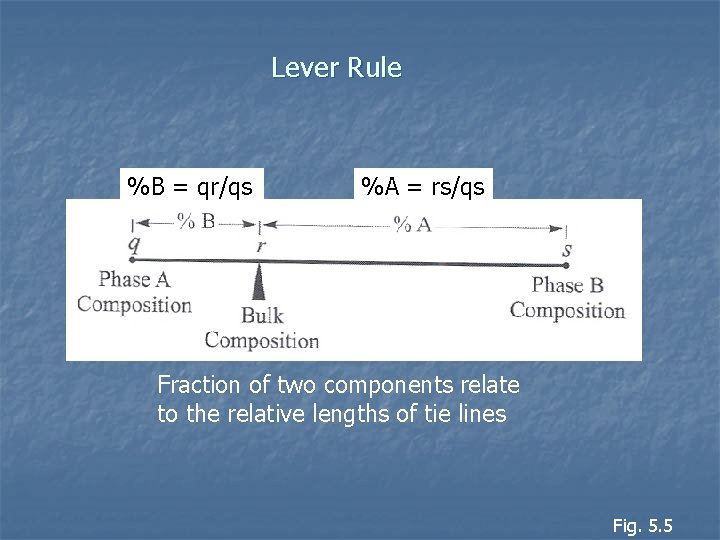
Lever Rule %B = qr/qs %A = rs/qs Fraction of two components relate to the relative lengths of tie lines Fig. 5. 5
Non-equilibrium crystallization n Results in “zoning” Individual mineral grains may vary in composition from center to edge n Easily observed petrographically n n Very common in plagioclase feldspars
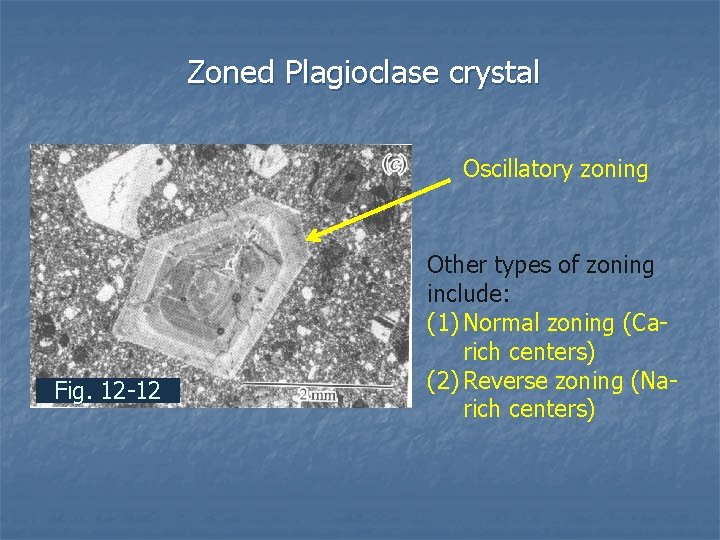
Zoned Plagioclase crystal Oscillatory zoning Fig. 12 -12 Other types of zoning include: (1) Normal zoning (Carich centers) (2) Reverse zoning (Narich centers)
n Zoning reflects change in P and T when mineral crystallizes n n Crystallizing mineral in disequilibrium with composition of melt Can be explained by non-equilibrium crystallization using phase diagram
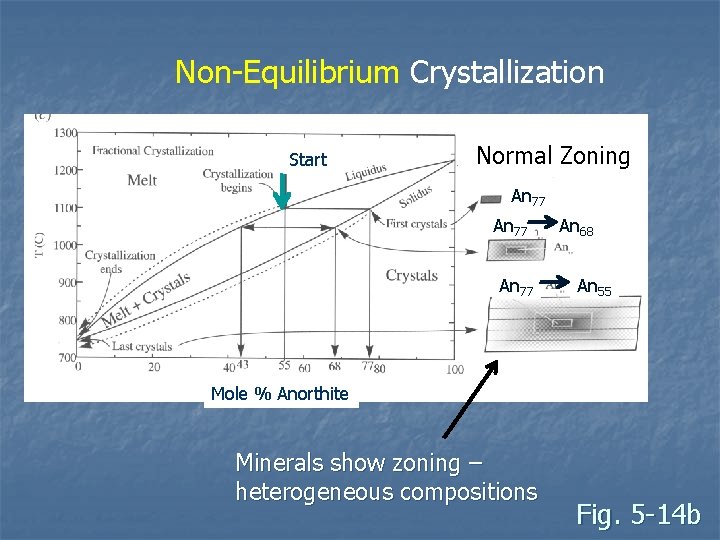
Non-Equilibrium Crystallization Start Normal Zoning An 77 An 68 An 55 Mole % Anorthite Minerals show zoning – heterogeneous compositions Fig. 5 -14 b
Controls on zoned crystals n n n Diffusion rate through solid crystal Time allowed for diffusion to occur Diffusion is rapid in olivine – few zoned crystals n n Mostly equilibrium Diffusion slow in plagioclase n Commonly zoned
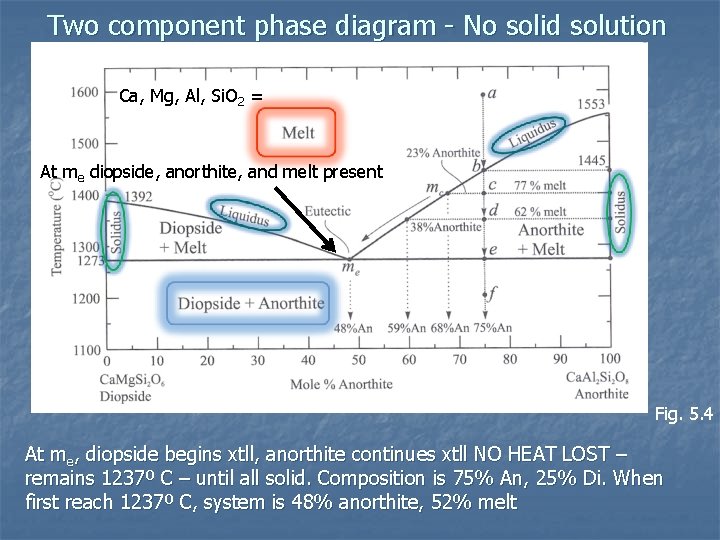
Two component phase diagram - No solid solution Ca, Mg, Al, Si. O 2 = At me diopside, anorthite, and melt present Fig. 5. 4 At me, diopside begins xtll, anorthite continues xtll NO HEAT LOST – remains 1237º C – until all solid. Composition is 75% An, 25% Di. When first reach 1237º C, system is 48% anorthite, 52% melt
Rates of growth n n n Slowest growing faces are often most prominent Fast growth causes faces to disappear This is why minerals have common forms
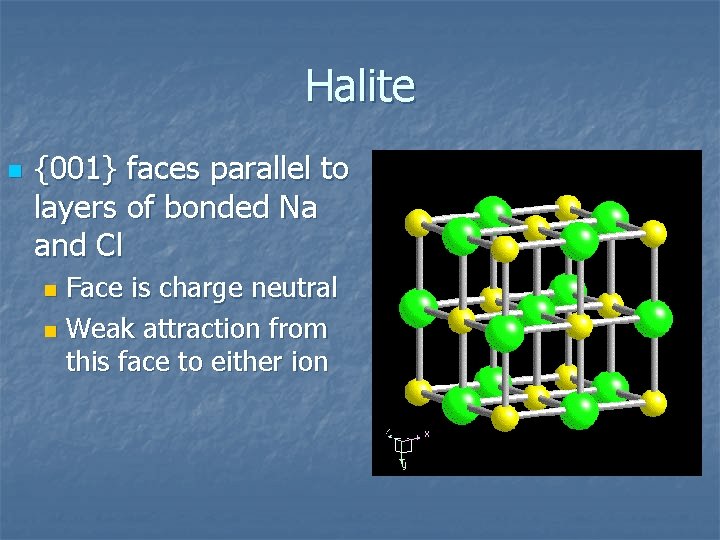
Halite n {001} faces parallel to layers of bonded Na and Cl Face is charge neutral n Weak attraction from this face to either ion n
n {111} faces parallel layers of pure Na and Cl High surface charge on face n Comes from unsatisfied bonds from element n Strong attraction from this face to oppositely charge ion n n Result is {111} face grows faster than {001} face n Thicker layer for a given amount of time
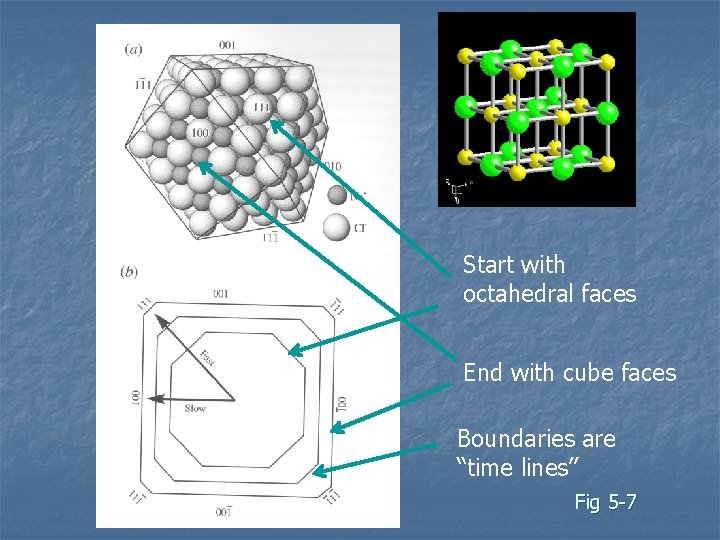
Start with octahedral faces End with cube faces Boundaries are “time lines” Fig 5 -7
- Slides: 29