Mineral Nutrition of Grazing Cattle Oklahoma State University


- Slides: 46
Mineral Nutrition of Grazing Cattle Oklahoma State University
Lesson Outline and Objectives • Discuss typical mineral composition of common Oklahoma forages • Consider mineral needs of cattle • Determinerals that are most likely needed in a supplement
Importance? Proper mineral and vitamin nutrition contributes to: – A strong immune system – Reproductive efficiency – Weight gain
Why All the Fuss? • Producers have endless options • Annual mineral costs vary from $2 to $40 per cow: Cattle Fax • Requirements vary considerably
Why All the Fuss? …cont. • Forage mineral concentration changes over time (within a year) • Mineral interactions add to the uncertainty • Identifying site specific mineral needs and(or) deficiencies is costly and time consuming
“In matters of style, swim with the current; In matters of principle, stand like a rock” Will Rogers
Why Do We Supplement Salt and Minerals? • Forage diet may not meet the animals requirement • Offset imbalance of an antagonistic mineral that is too high in forage • Deliver vitamins, antibiotics, ionophores
Macro or Major • • • Ca P Magnesium Sulfur K - potassium Sodium Micro or Trace • • • Selenium Zinc Manganese Iron Copper Cobalt
Factors That Influence Forage Mineral Concentration • • • Forage species Plant maturity Grazing pressure (leaf vs stem) Weathering Soil mineral concentration and/or fertilizer applications
Forage Species Composition data: Oklahoma, Lusby and Selk, 1994 National, Greene et al. , 1998
Sodium Requirement
Phosphorus Requirement
Copper Requirement
Zinc Requirement
Manganese Requirement
Selenium Requirement
Iron Requirement
Species Summary • Legumes are an excellent source of minerals • Almost all forages (except legumes) are low in Na • Native warm season grasses are moderate to low in P while other grasses are moderate • All grasses contain low Cu and Zn • Fescue tends to be low in Se, while other forages are moderate to adequate
Plant Maturity
Influence of Plant Maturity on Mineral Composition Source: Greene et al. , 1987
Carotene in Native Pasture NRC Req. Waller et al. , 1972
Grazing Pressure
Influence of Grazing Pressure on Forage Minerals • Leaf has 2 X to 3 X of most minerals compared to stem • Limited forage availability (<1, 200 lb per acre) reduces dry matter intake
Nitrogen Fertilization
Effects of Late-summer N Fertilization Rate on Minerals in Bermudagrass Did not change concentrations of: Mineral Ca, % Cu, ppm Mo, ppm Mean 0. 42 3. 86 0. 43 Source: Lalman et al. , 2002 SE 0. 02 0. 14 0. 02 P>F 0. 9 0. 8 0. 6
Effects of Late-summer N Fertilization Rate on Minerals in Bermudagrass Increased concentrations of: Mineral P, % Mg, % K, % S, % Mean 0. 16 0. 10 0. 36 0. 22 *P <. 01 Source: Lalman et al. , 2002 Contrast* Lin Lin Percent 0 vs 135 17 33 36 19
Effects of Late-summer N Fertilization Rate on Minerals in Bermudagrass Decreased concentrations of: Mineral FE, ppm Zn, ppm Mean 318 21. 7 114 *P <. 01 Source: Lalman et al. , 2002 Contrast* Lin Lin Percent 0 vs 135 27 16 18
Weathering
Harvest Date: Calcium NRC Linear P <. 01 Quad P <. 01 Nov vs March = 24% Source: Lalman et al. , 2002
Harvest Date: Phosphorus NRC Linear P <. 01 Quad P <. 01 Nov vs March = 39% Source: Lalman et al. , 2002
Harvest Date: Magnesium NRC Linear P <. 01 Quad P <. 01 Nov vs March = 50% Source: Lalman et al. , 2002
Harvest Date: Potassium NRC Linear P <. 01 Quad P <. 01 Nov vs March = 76% Source: Lalman et al. , 2002
Summary: Forage Mineral Composition • Many factors influence forage mineral composition • A general idea of species differences, maturity, and weathering (standing forage) can lead to a logical supplementation plan
Mineral Supplementation
Consider the Form • Sulfates are more available than oxides: 80 to 100 VS 0 to 70 – Cu – Zn • Organic forms have higher availability compared to inorganic: 100 to 130
If It Isn’t Broke, Don’t Fix It! • Are you satisfied with fertility? – Pregnancy = 90% or more? – Weaning rate = 86% or more? • Are you satisfied with weaning weights? – Weaning weight = 525 lb or more? • Do you have evidence that your calves remain healthy (don’t get sick) after they are weaned?
Take Care of the BIG Things First • Cows calve in good body condition (nutrition) • Well planned and executed herd health program (disease control) • Maintain a fertile cow herd (cull problem cows and genetic selection)
Mineral Programs and Costs Program Cost/cow/year Salt only Salt + dicalcium phosphate Salt + dical + TM + vit. pack Salt + dical + organic TM $2. 00 $6. 00 $11. 00 $19. 00
Percentage Improvement in Calf Crop Weaned Needed to Cover Additional Costs Program Increased Weaning Rate Salt only Salt + dicalcium phosphate Salt + dical + TM + Vit. Pack Salt + dical + organic TM 0% 1% 3% 6%
Composition of OSU Range Research Center Mineral Ca, % P, % Mg, % Cost per ton Cu, ppm = $450 Zn, ppm Se, ppm Forage Quality Avg to Low High 12 10 8 6 1 8 1000 3000 12 12 Cows consume both native and bermudagrass forage
Other Additives?
Home Mixing?
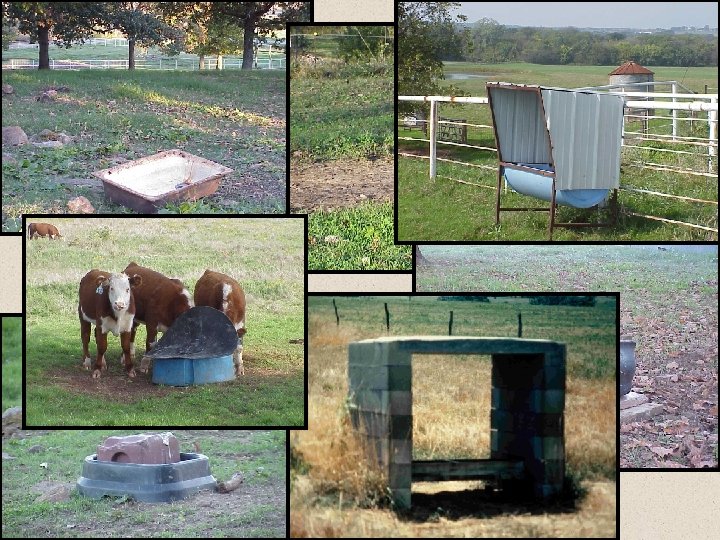
Protect Your Investment
Summary • Production history and forage/feed mineral concentration are a good place to begin • Na, P, Cu, Zn are frequently deficient in Oklahoma. Se, Mn ? • Mineral supplements do not need to be extremely complicated or expensive