
MIGRATION Unit Two Movement People move in so







- Slides: 88
MIGRATION Unit Two
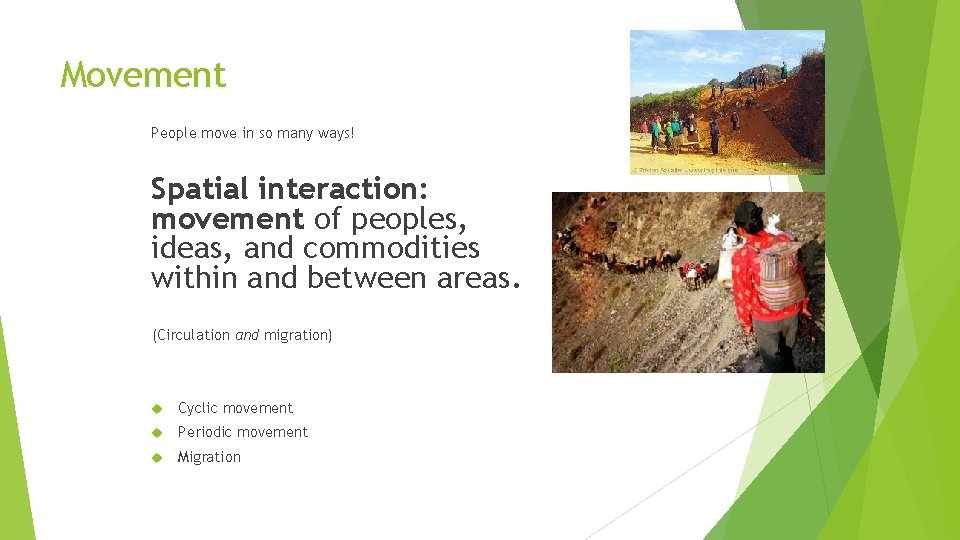
Movement People move in so many ways! Spatial interaction: movement of peoples, ideas, and commodities within and between areas. (Circulation and migration) Cyclic movement Periodic movement Migration
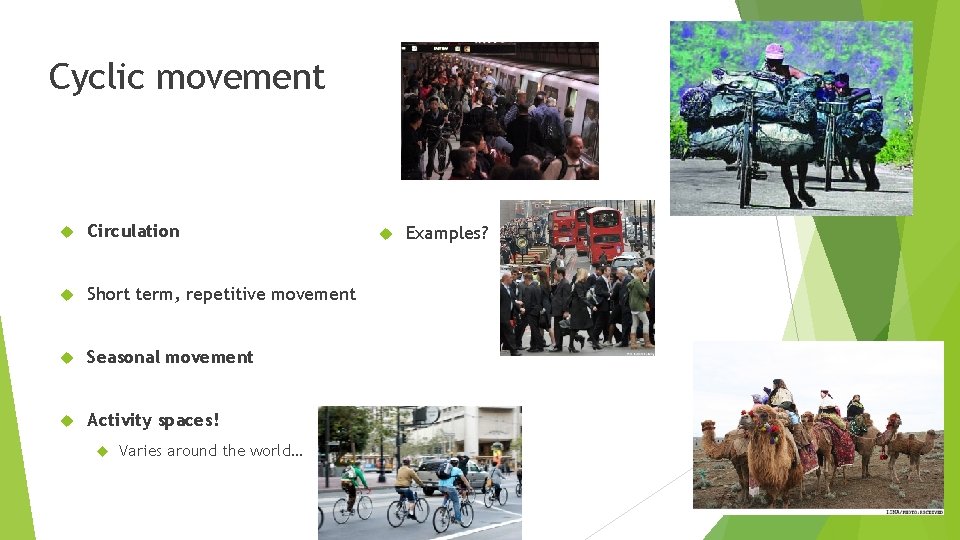
Cyclic movement Circulation Short term, repetitive movement Seasonal movement Activity spaces! Varies around the world… Examples?
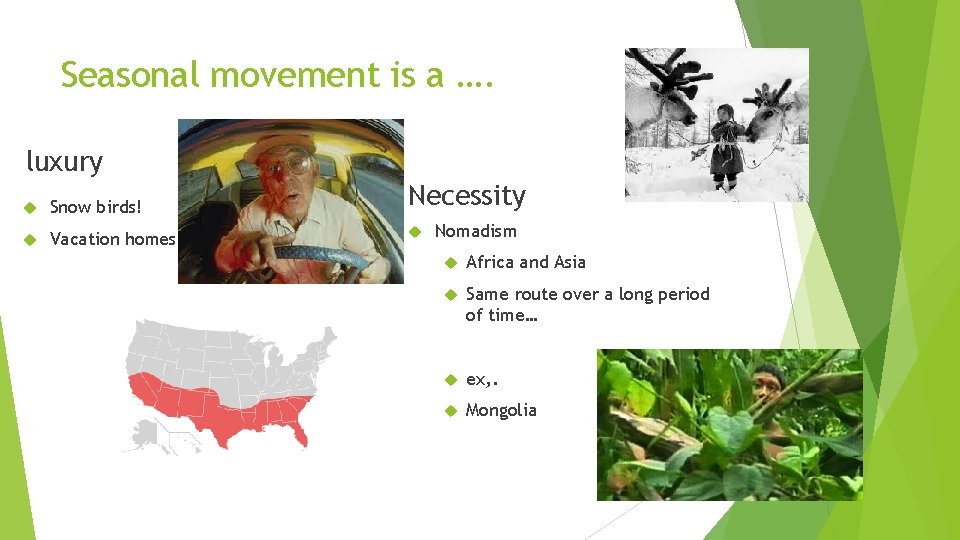
Seasonal movement is a …. luxury Snow birds! Vacation homes Necessity Nomadism Africa and Asia Same route over a long period of time… ex, . Mongolia
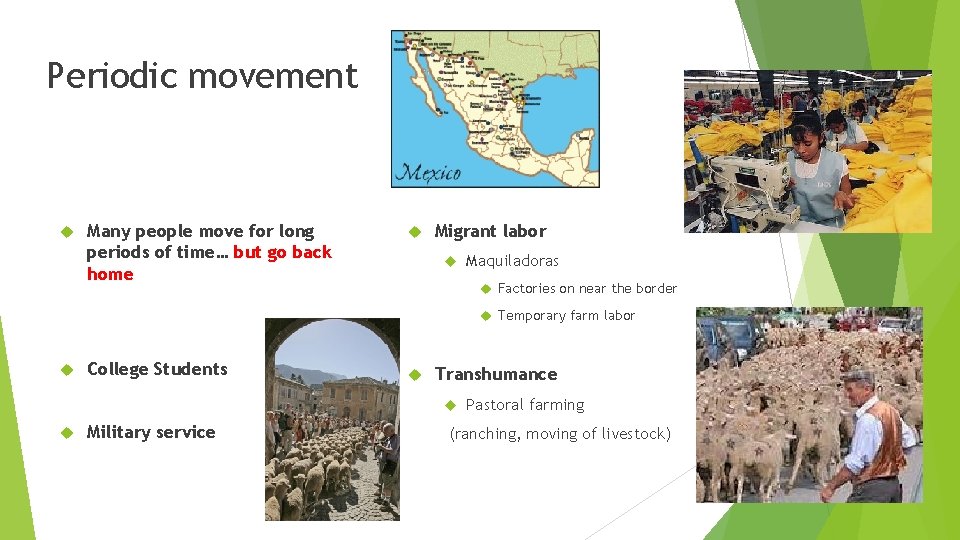
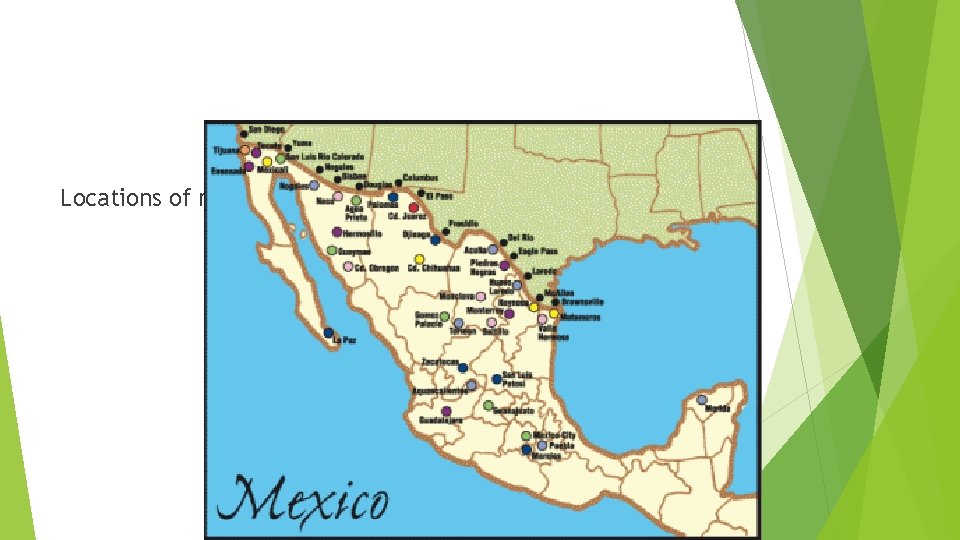
Periodic movement Many people move for long periods of time… but go back home Migrant labor Maquiladoras Factories on near the border Temporary farm labor College Students Transhumance Military service Pastoral farming (ranching, moving of livestock)
Locations of maquiladoras
Migration is… A type of mobility Migration is a permanent move to a new location Migration = relocation diffusion Emigration= Emigration moving from a place (-) Immigration= Immigration moving to a place (+) NET migration = the difference between immigration and emigration
Main Types of migration (we will break these down a little later…) International migration Permanent move from one country to another (aka Transnational migration) Immigrants (+) Emigrants (-) Internal migration Migration within the borders of a country Interregional (move from one region to another) Intraregional (move within one region)
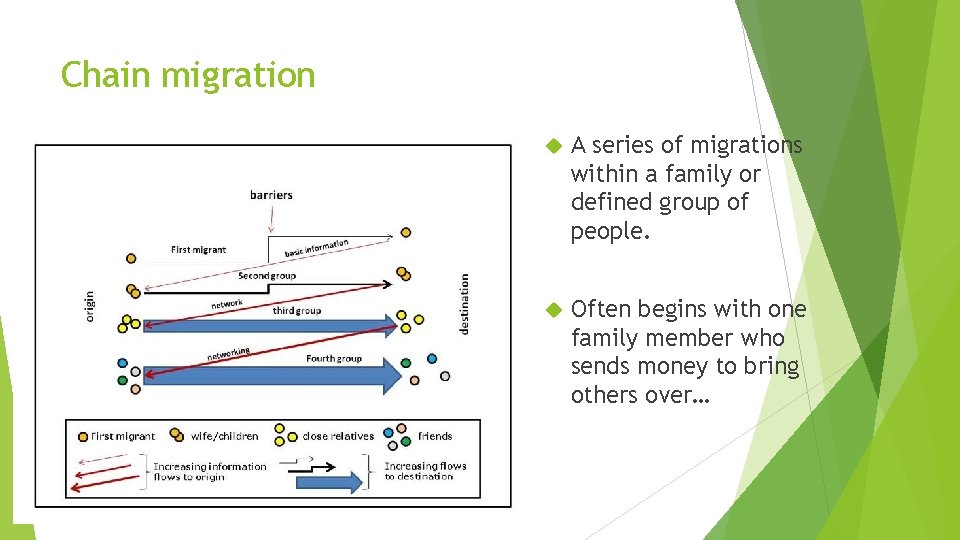
Chain migration A series of migrations within a family or defined group of people. Often begins with one family member who sends money to bring others over…
Why Do People Migrate? Distance of migration International Two migration types: Voluntary Forced http: //www. forcedmigration. org/about/whatisfm
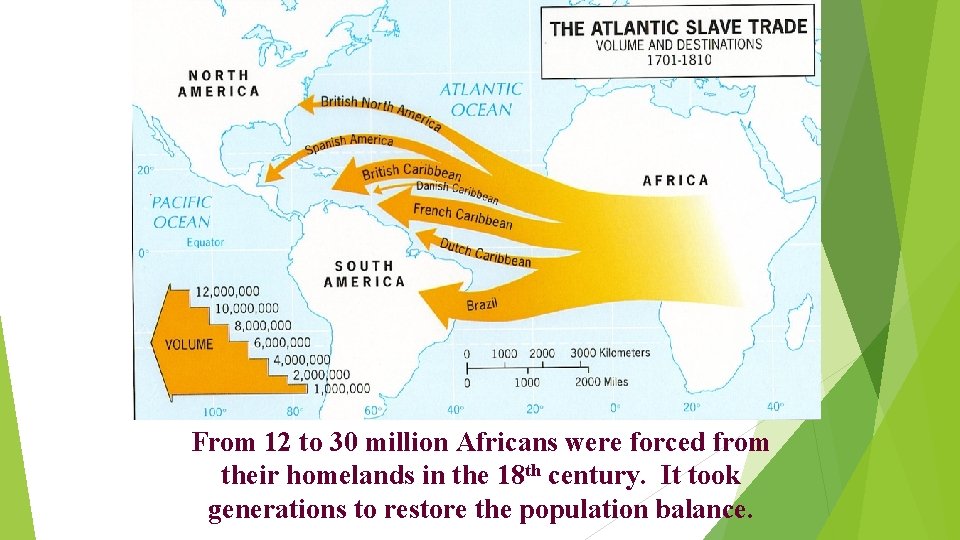
From 12 to 30 million Africans were forced from their homelands in the 18 th century. It took generations to restore the population balance.
Migration transition: theory time! International migration is most common in countries that are in stage 2 of the demographic transition
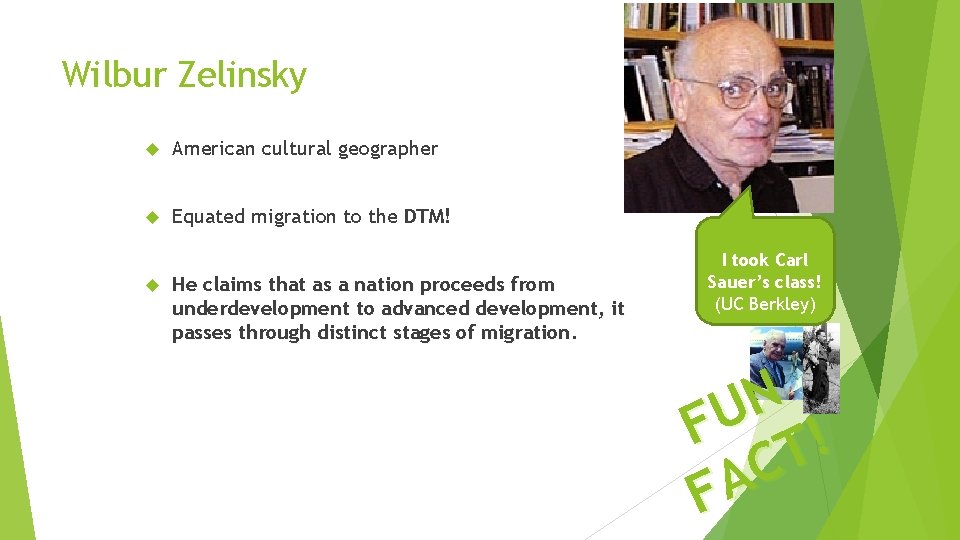
Wilbur Zelinsky American cultural geographer Equated migration to the DTM! He claims that as a nation proceeds from underdevelopment to advanced development, it passes through distinct stages of migration I took Carl Sauer’s class! (UC Berkley) N FU T! C FA
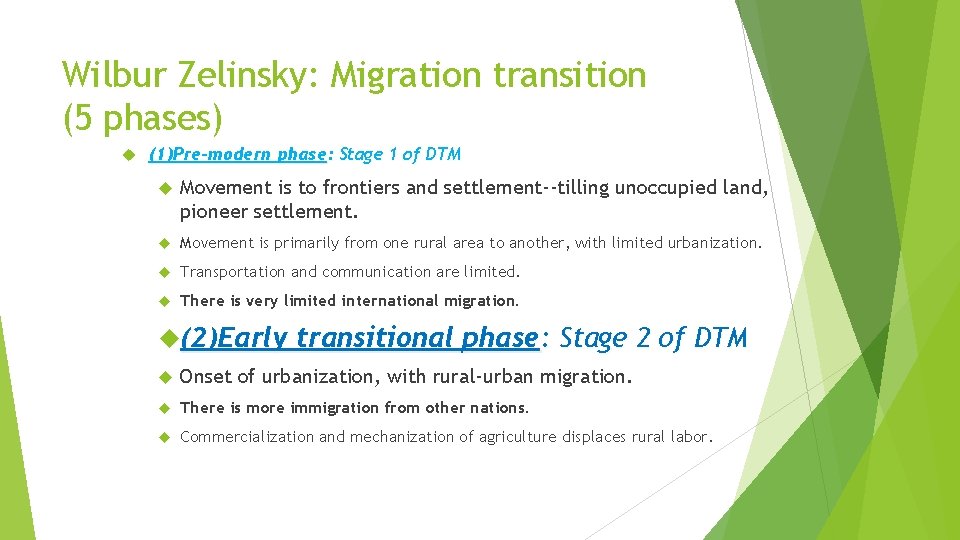
Wilbur Zelinsky: Migration transition (5 phases) (1)Pre-modern phase: Stage 1 of DTM Movement is to frontiers and settlement--tilling unoccupied land, pioneer settlement. Movement is primarily from one rural area to another, with limited urbanization. Transportation and communication are limited. There is very limited international migration. (2)Early transitional phase: Stage 2 of DTM Onset of urbanization, with rural-urban migration. There is more immigration from other nations. Commercialization and mechanization of agriculture displaces rural labor.
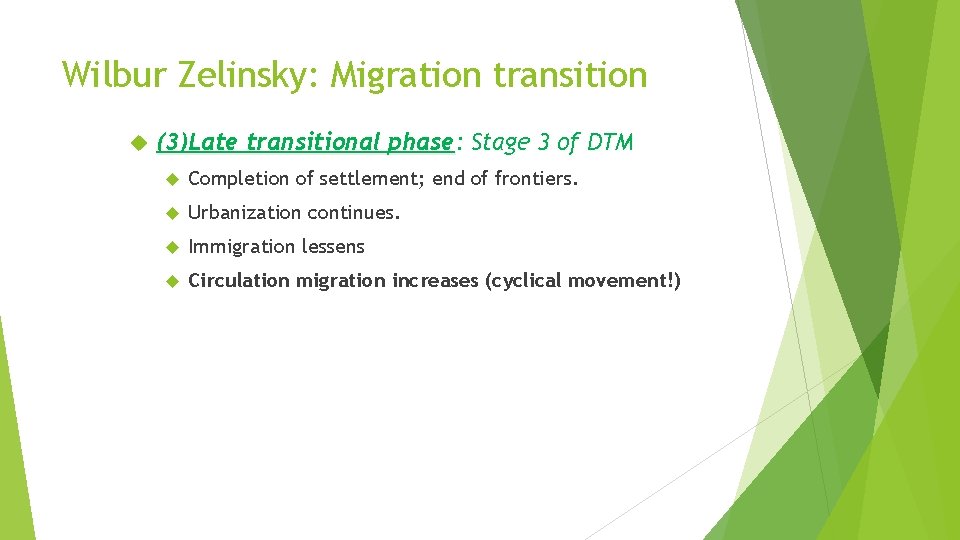
Wilbur Zelinsky: Migration transition (3)Late transitional phase: Stage 3 of DTM Completion of settlement; end of frontiers. Urbanization continues. Immigration lessens Circulation migration increases (cyclical movement!)
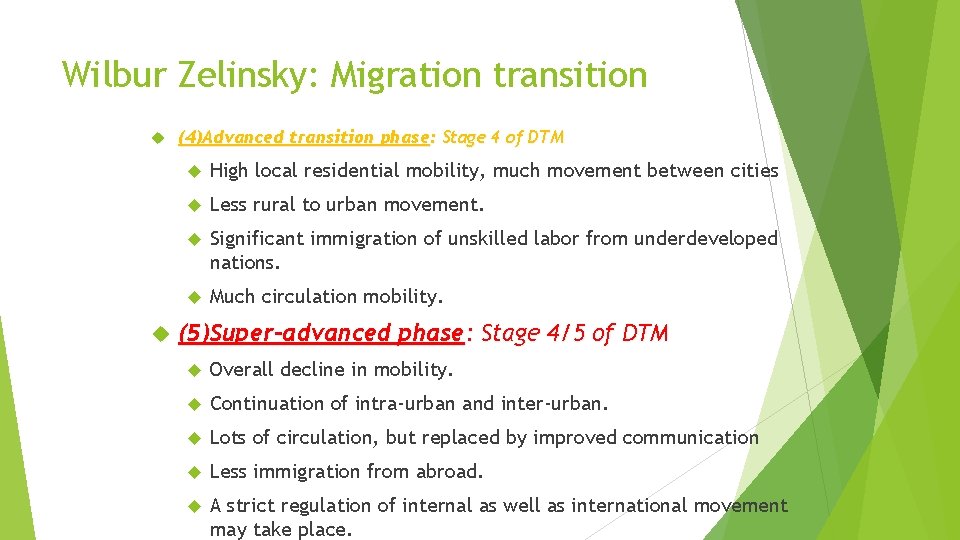
Wilbur Zelinsky: Migration transition (4)Advanced transition phase: Stage 4 of DTM High local residential mobility, much movement between cities Less rural to urban movement. Significant immigration of unskilled labor from underdeveloped nations. Much circulation mobility. (5)Super-advanced phase: Stage 4/5 of DTM Overall decline in mobility. Continuation of intra-urban and inter-urban. Lots of circulation, but replaced by improved communication Less immigration from abroad. A strict regulation of internal as well as international movement may take place.
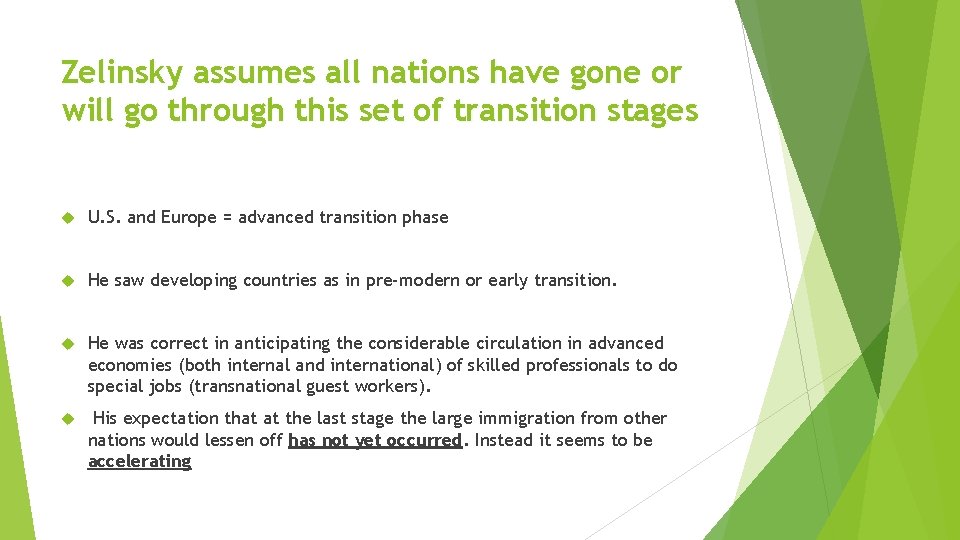
Zelinsky assumes all nations have gone or will go through this set of transition stages U. S. and Europe = advanced transition phase He saw developing countries as in pre-modern or early transition. He was correct in anticipating the considerable circulation in advanced economies (both internal and international) of skilled professionals to do special jobs (transnational guest workers). His expectation that at the last stage the large immigration from other nations would lessen off has not yet occurred. Instead it seems to be accelerating
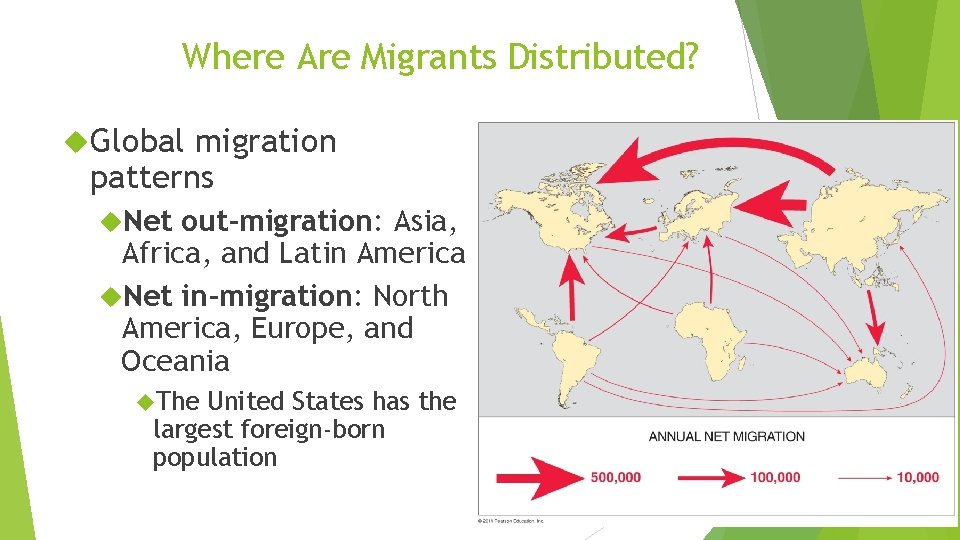
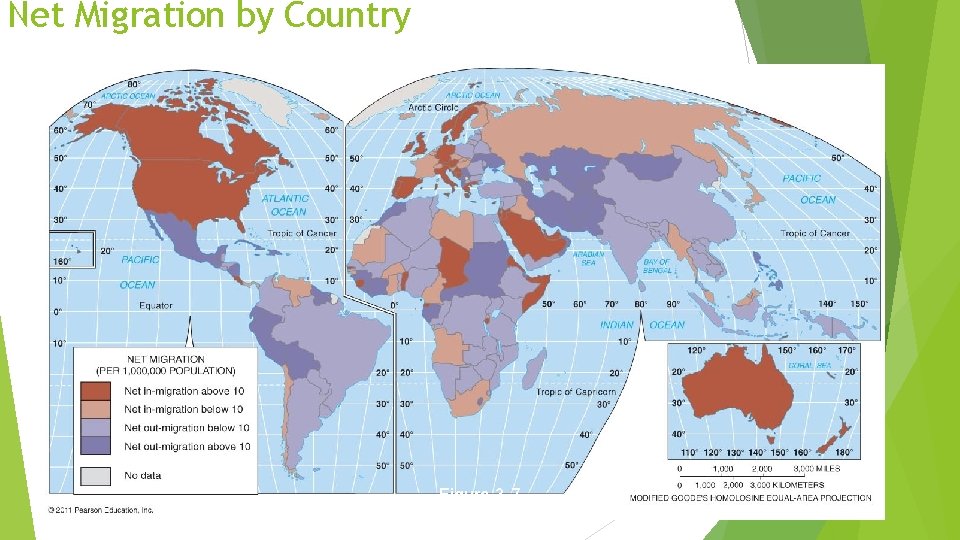
Where Are Migrants Distributed? Global migration patterns Net out-migration: Asia, Africa, and Latin America Net in-migration: North America, Europe, and Oceania The United States has the largest foreign-born population
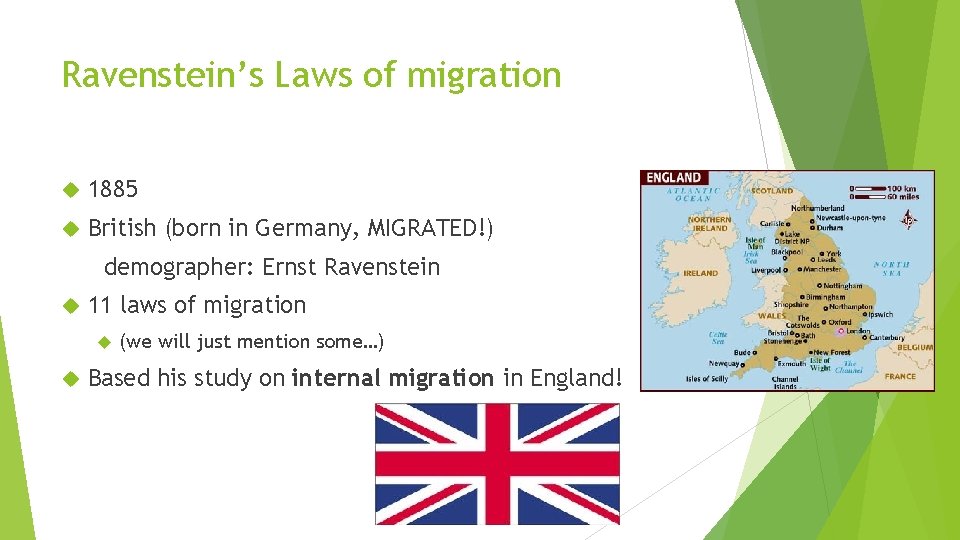
Ravenstein’s Laws of migration 1885 British (born in Germany, MIGRATED!) demographer: Ernst Ravenstein 11 laws of migration (we will just mention some…) Based his study on internal migration in England!
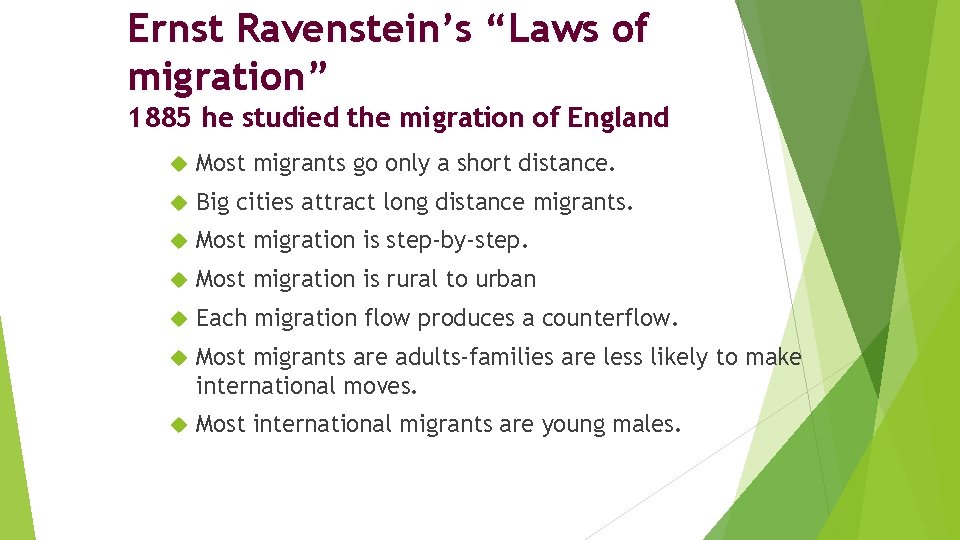
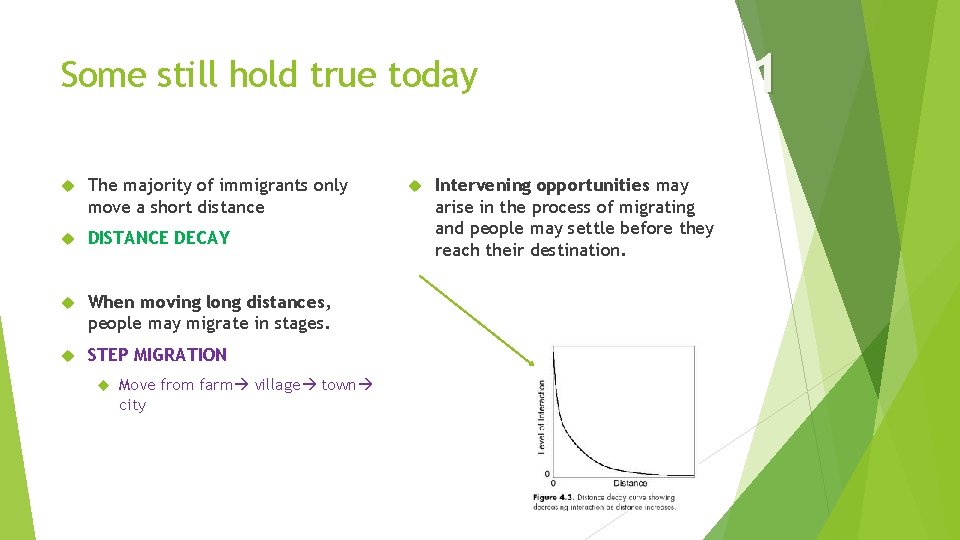
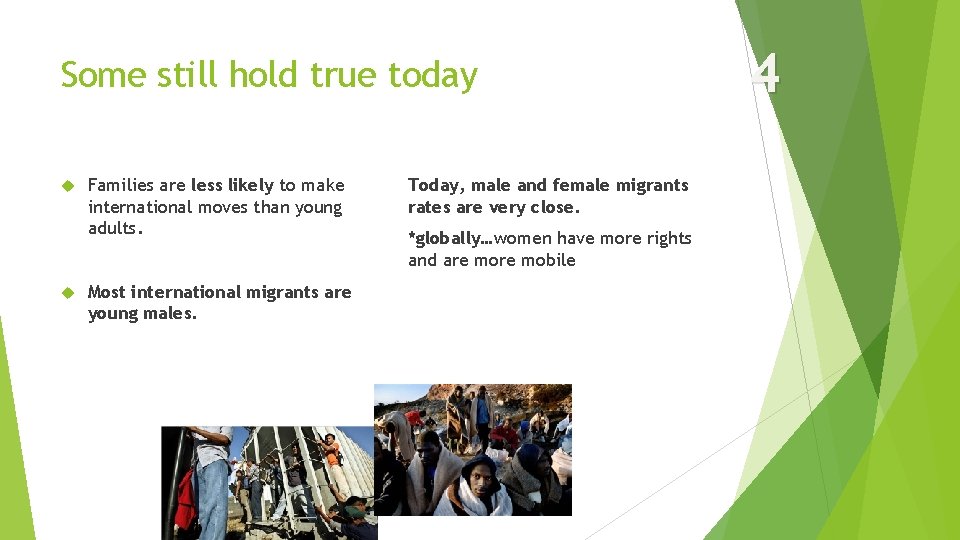
Ernst Ravenstein’s “Laws of migration” 1885 he studied the migration of England Most migrants go only a short distance. Big cities attract long distance migrants. Most migration is step-by-step. Most migration is rural to urban Each migration flow produces a counterflow. Most migrants are adults-families are less likely to make international moves. Most international migrants are young males.
Some still hold true today The majority of immigrants only move a short distance DISTANCE DECAY When moving long distances, people may migrate in stages. STEP MIGRATION Move from farm village town city Intervening opportunities may arise in the process of migrating and people may settle before they reach their destination. 1
Some still hold true today Migrants who move longer distances tend to choose cities as their destinations RURAL to URBAN migration! For Ernst, it was London Today, this occurs throughout the world but the highest rates are in the developing world 2
Some still hold true today Families are less likely to make international moves than young adults. Most international migrants are young males. Today, male and female migrants rates are very close. *globally…women have more rights and are mobile 4
Why Do People Migrate? Some characteristics of migrants have changed since Ravenstein… Gender Traditionally, males outnumbered females In the United States today, 55 percent of immigrants = female Family status In the United States today, about 40 percent of immigrants = young adults, aged 25– 39 Also increasing percentage of children USA 16% of immigrants are under 15!
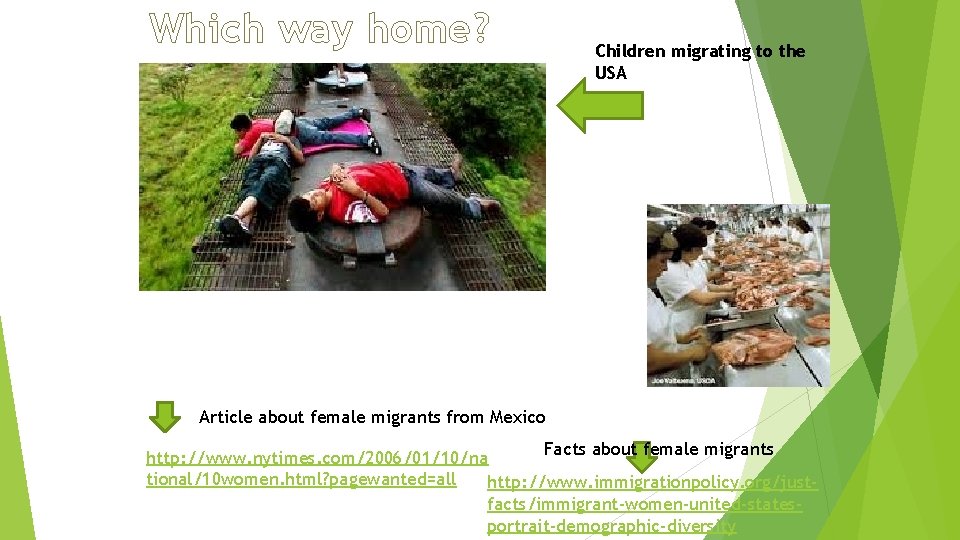
Which way home? Children migrating to the USA Article about female migrants from Mexico Facts about female migrants http: //www. nytimes. com/2006/01/10/na tional/10 women. html? pagewanted=all http: //www. immigrationpolicy. org/justfacts/immigrant-women-united-statesportrait-demographic-diversity
Net Migration by Country Figure 3 -7
Why Do People Migrate? Reasons Most for migration people migrate for economic reasons Cultural and Environmental reasons PUSH PULL
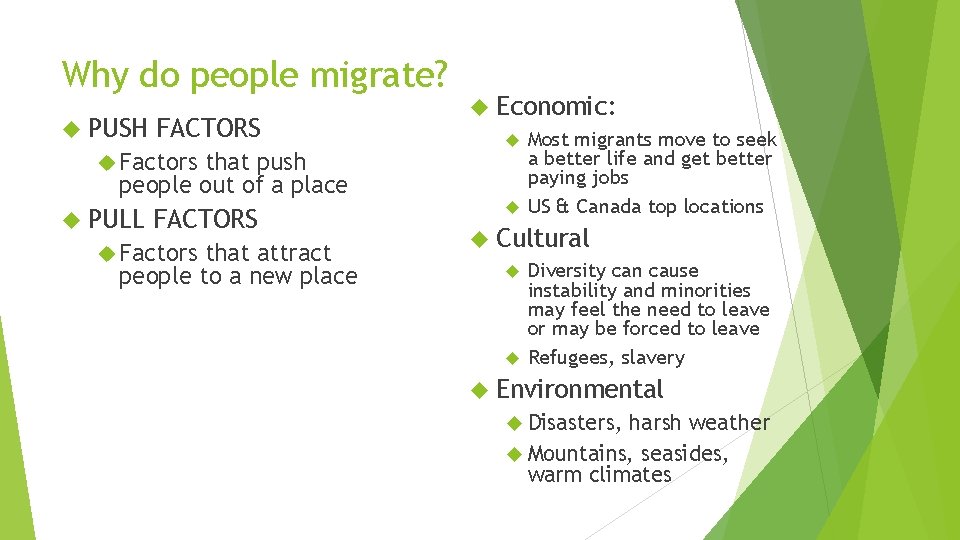
Push factors Encourage people to move away from the region they live in Reasons for emigrating because of a difficulty
Pull factors Attracts migrants to a new region Reasons for immigrating because of something desirable
Economic push and pull Economic: people move away from places with poor economic opportunities and toward places with better ones Push: Lack of jobs, recession Pull Job opportunities, public education, affordable housing Economic push and pull help to explain the overall worldwide movement of people from rural to urban areas during the 19 th and 20 th centuries
Moving to work…. “The majority of migrants cross borders in search of better economic and social opportunities. Economic migrants are the worlds fastest growing group of migrants. Globalization has increased the mobility of labor, and a decline in fertility and working-age populations in many developed countries is leading to a rising demand for workers from abroad to sustain national economies. New patterns of migration have arisen, and many countries that once sent migrants abroad -- for example, Argentina, Ireland South Korea -- are now experiencing migrant inflows as well. ” http: //www. unhcr. org/en-us/figures-at-a-glance. html
cultural push and pull (examples) push Forced migration Slavery Refugees Political factors War, corrupt leadership Religious persecution Ethnic conflict pull Religious freedom Education Democracy
Environmental Pull Climate Elevations Temperate and warm climates Many people live at lower elevations Seacoasts People cluster around coasts
Environmental Push Climate Elevations Most sparsely populated areas of the world have uninhabitable climates (extreme cold/heat) Higher latitudes = colder (less people) in mountains Seacoasts BUT being at/below sea level may push people too (Maldives) Natural disasters Floods Hurricanes/typh oons Tornadoes Earthquakes Tsunamis
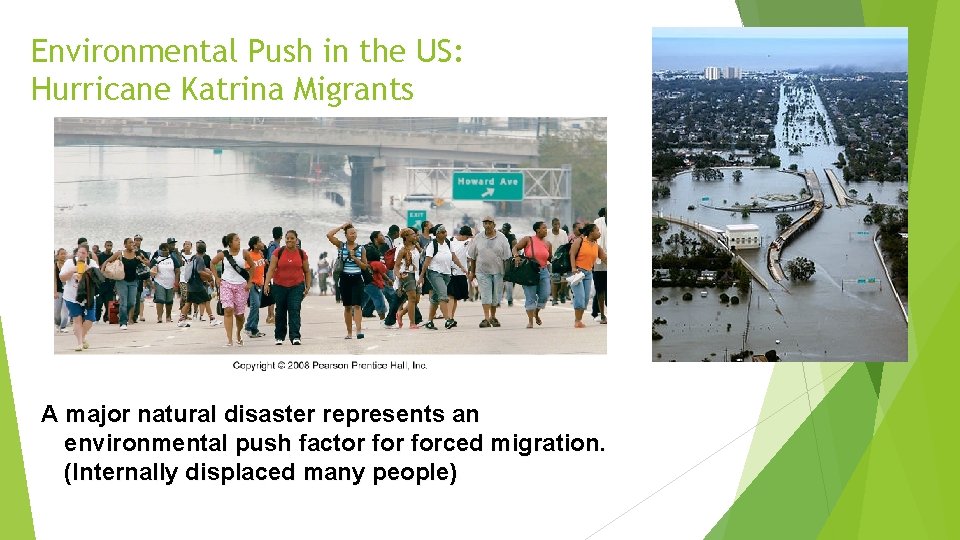
Environmental Push in the US: Hurricane Katrina Migrants A major natural disaster represents an environmental push factor forced migration. (Internally displaced many people)
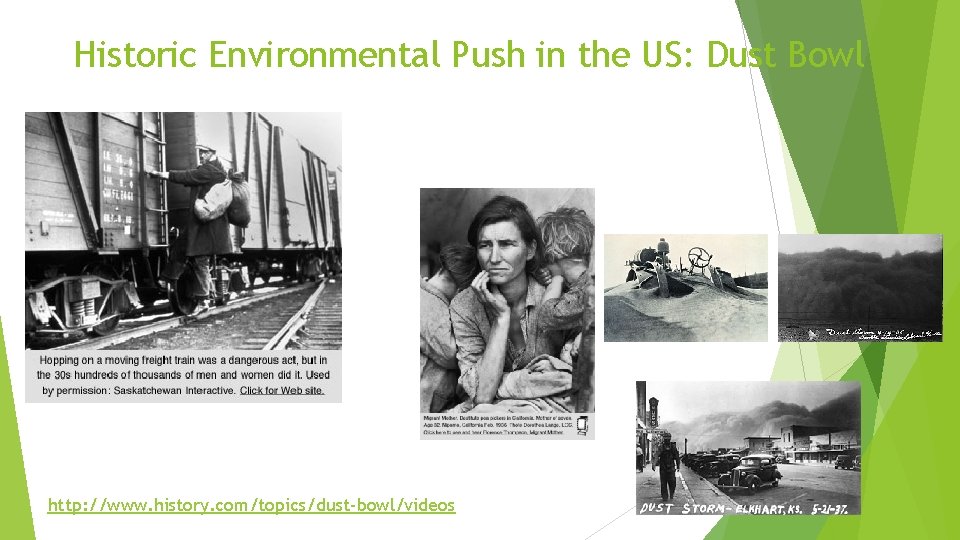
Historic Environmental Push in the US: Dust Bowl http: //www. history. com/topics/dust-bowl/videos
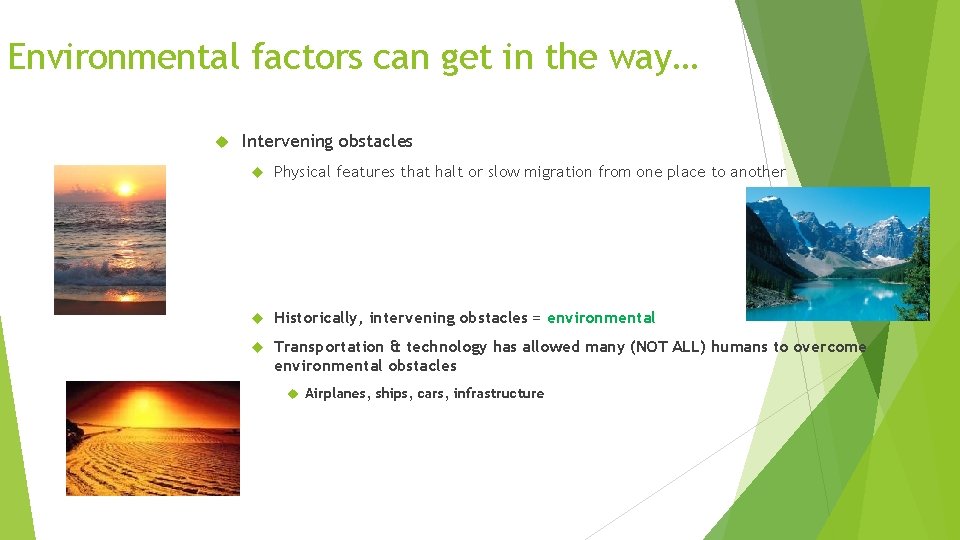
Environmental factors can get in the way… Intervening obstacles Physical features that halt or slow migration from one place to another Historically, intervening obstacles = environmental Transportation & technology has allowed many (NOT ALL) humans to overcome environmental obstacles Airplanes, ships, cars, infrastructure
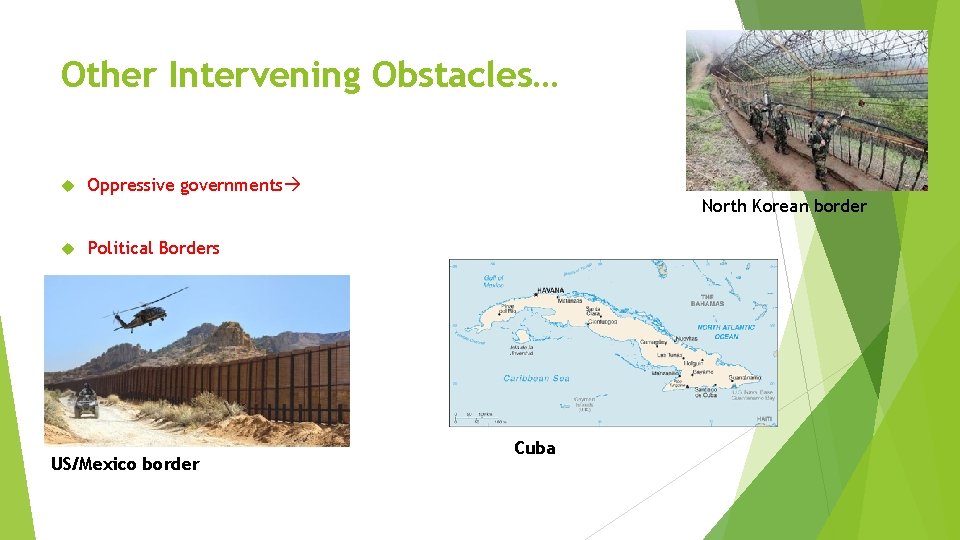
Other Intervening Obstacles… Oppressive governments North Korean border Political Borders US/Mexico border Cuba
Why do people migrate? PUSH FACTORS Factors that push people out of a place PULL FACTORS Factors that attract people to a new place Economic: Most migrants move to seek a better life and get better paying jobs US & Canada top locations Cultural Diversity can cause instability and minorities may feel the need to leave or may be forced to leave Refugees, slavery Environmental Disasters, harsh weather Mountains, seasides, warm climates
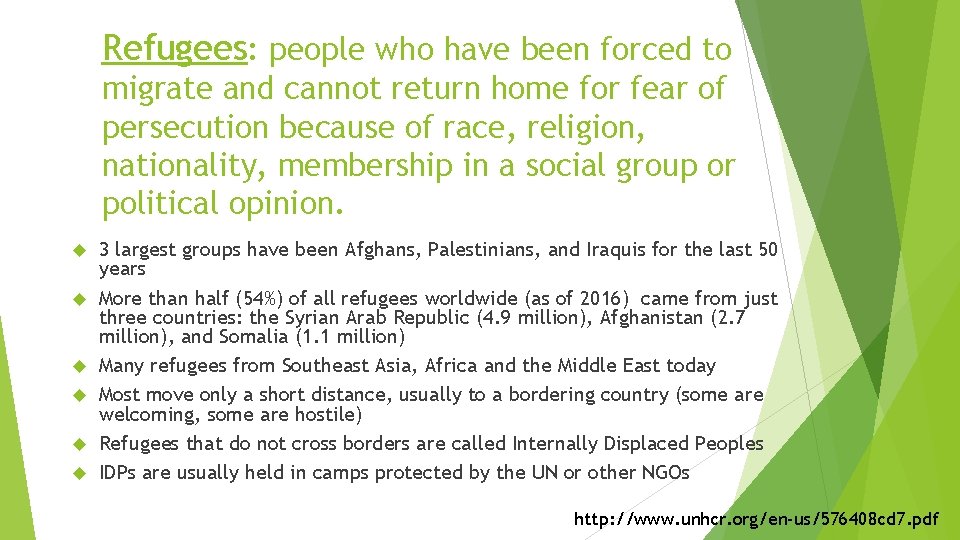
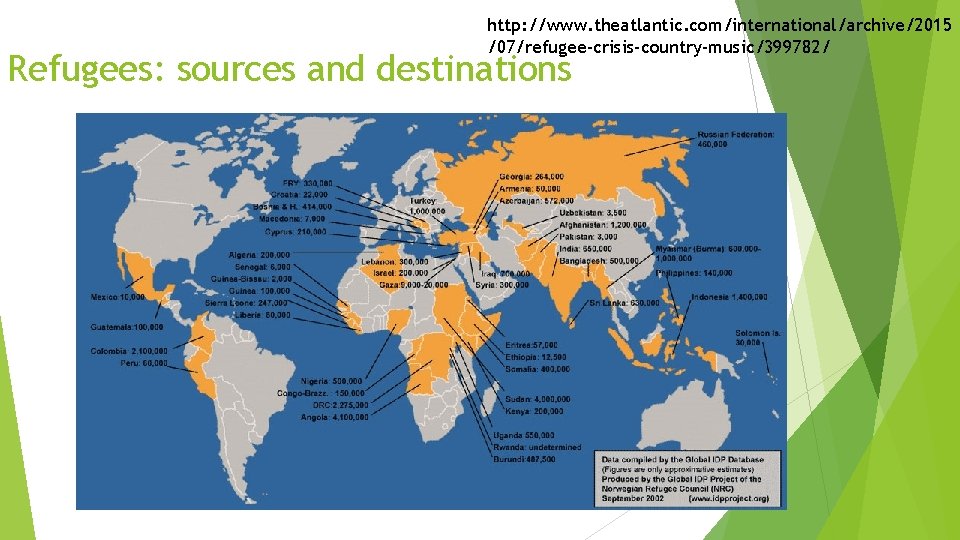
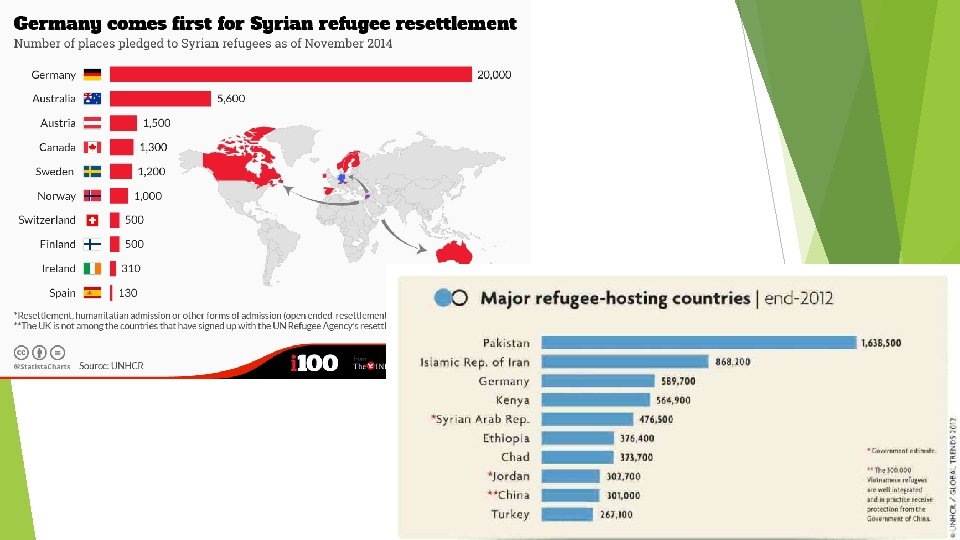
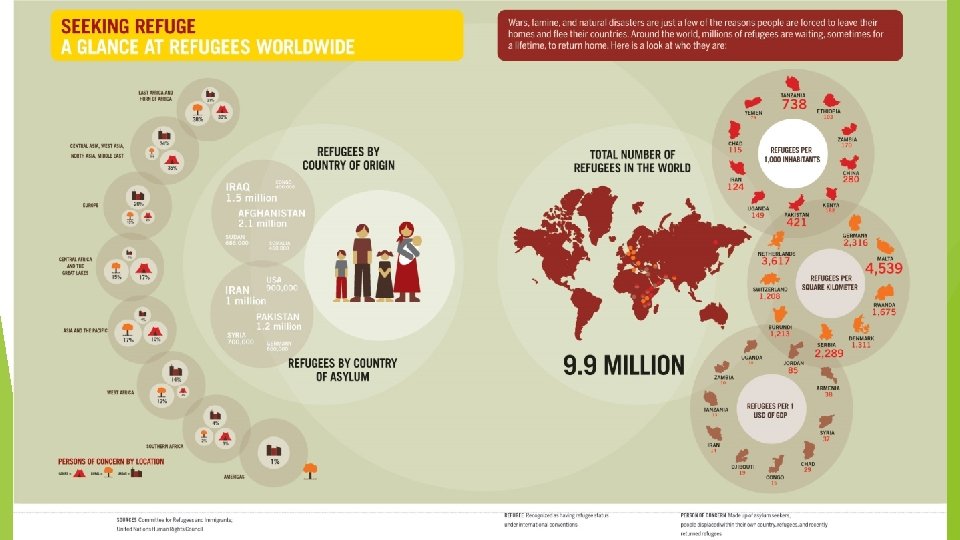
Refugees: people who have been forced to migrate and cannot return home for fear of persecution because of race, religion, nationality, membership in a social group or political opinion. 3 largest groups have been Afghans, Palestinians, and Iraquis for the last 50 years More than half (54%) of all refugees worldwide (as of 2016) came from just three countries: the Syrian Arab Republic (4. 9 million), Afghanistan (2. 7 million), and Somalia (1. 1 million) Many refugees from Southeast Asia, Africa and the Middle East today Most move only a short distance, usually to a bordering country (some are welcoming, some are hostile) Refugees that do not cross borders are called Internally Displaced Peoples IDPs are usually held in camps protected by the UN or other NGOs http: //www. unhcr. org/en-us/576408 cd 7. pdf
http: //www. theatlantic. com/international/archive/2015 /07/refugee-crisis-country-music/399782/ Refugees: sources and destinations
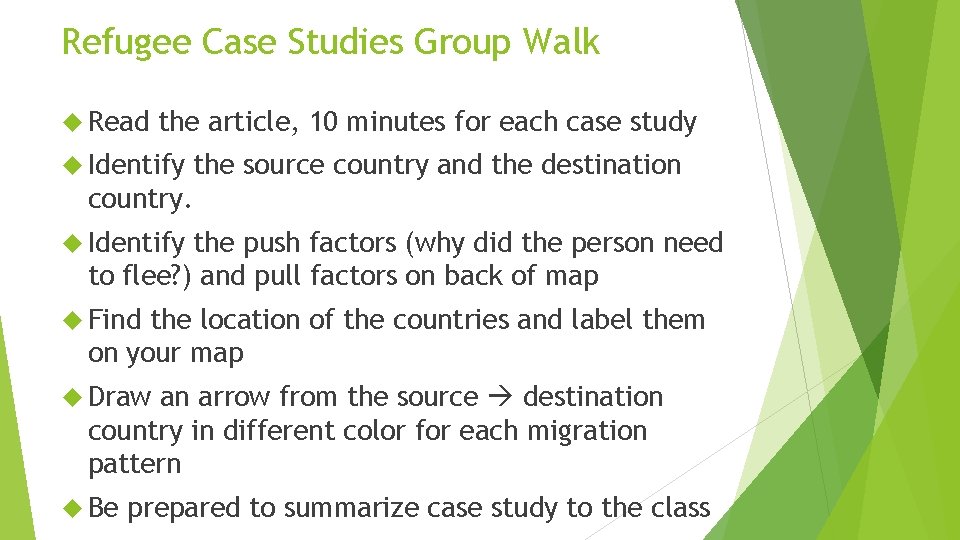
Refugee Case Studies Group Walk Read the article, 10 minutes for each case study Identify the source country and the destination country. Identify the push factors (why did the person need to flee? ) and pull factors on back of map Find the location of the countries and label them on your map Draw an arrow from the source destination country in different color for each migration pattern Be prepared to summarize case study to the class
Ravenstein also noted the importance of what is now called the gravity model
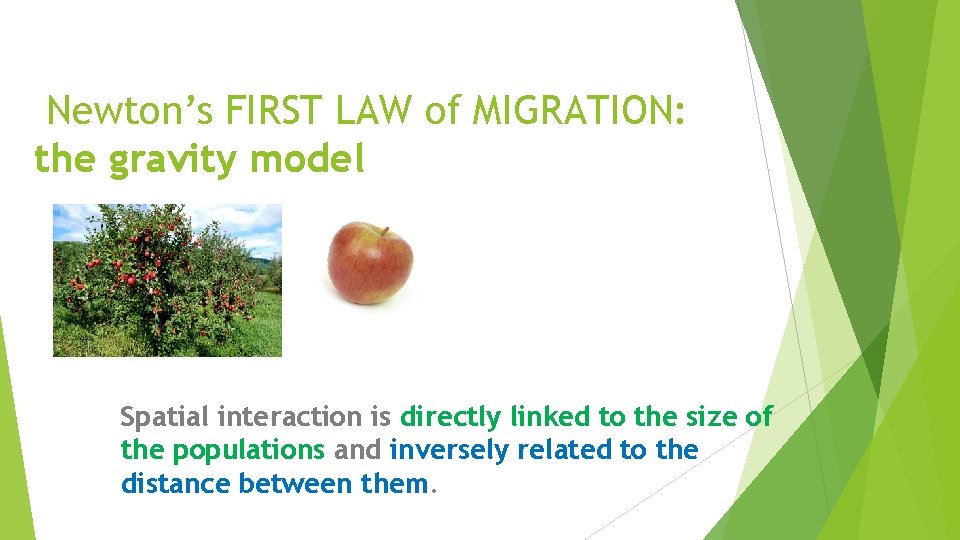
Newton’s FIRST LAW of MIGRATION: the gravity model Spatial interaction is directly linked to the size of the populations and inversely related to the distance between them.
The gravity model social scientists refer to this as the modified law of gravitation Takes into account the population size of two places and their distance. The gravity model incorporates these two features: (1)Larger places attract people, ideas, and commodities more than smaller places (2)Places closer together have a greater attraction.
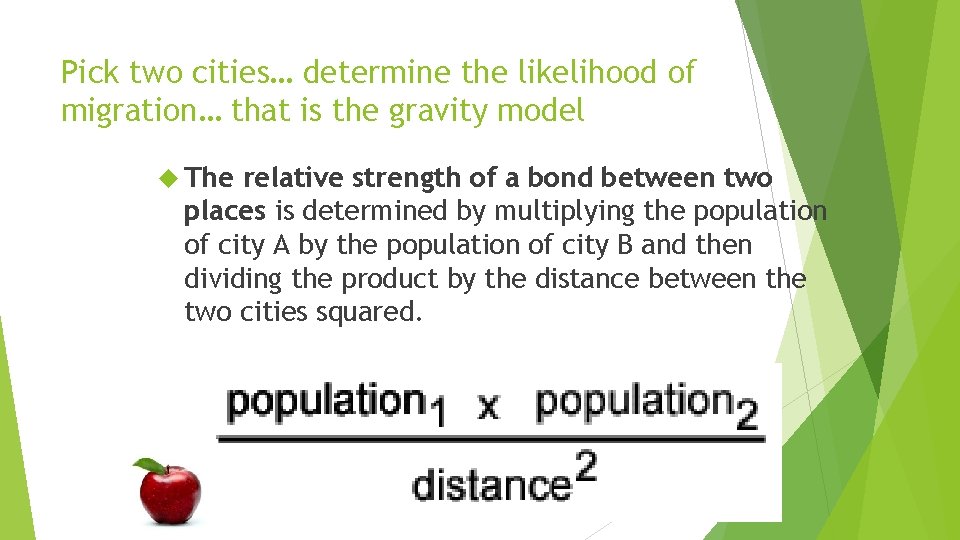
Pick two cities… determine the likelihood of migration… that is the gravity model The relative strength of a bond between two places is determined by multiplying the population of city A by the population of city B and then dividing the product by the distance between the two cities squared.
Gravity Model The distance beyond cost, effort, and means strongly influence willingness to travel… eventually this will prevent migration from occurring. Large city has a greater gravitational pull than a small one… Still tends to pull people that live closer than farther away
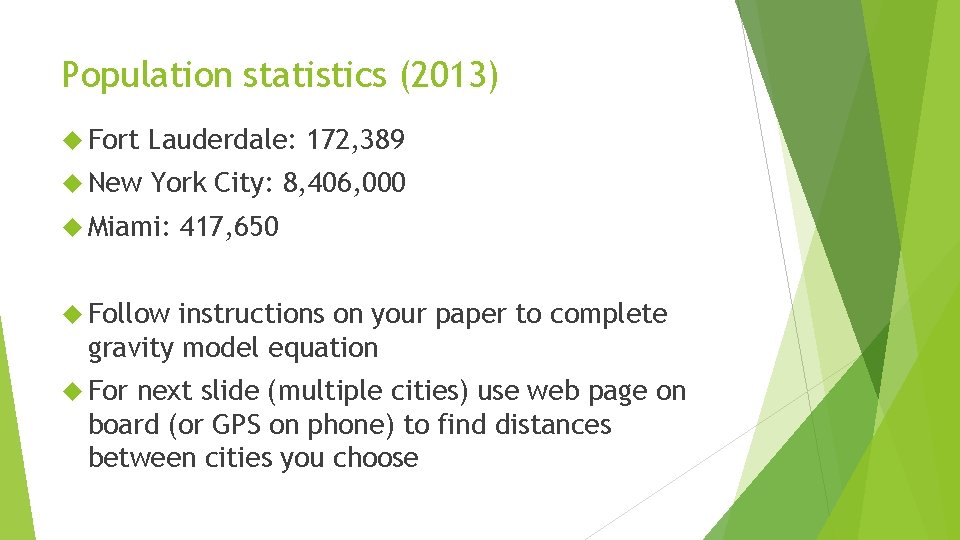
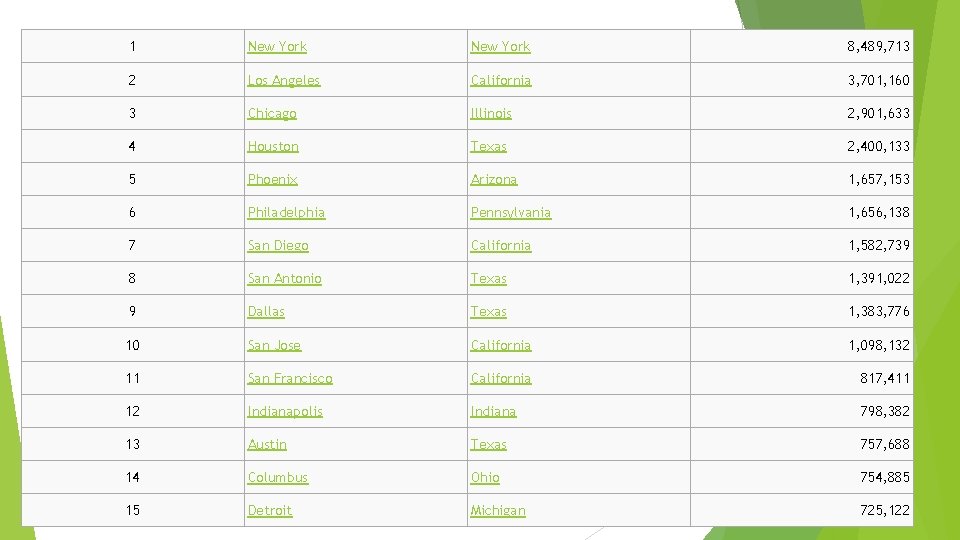
Population statistics (2013) Fort Lauderdale: 172, 389 New York City: 8, 406, 000 Miami: 417, 650 Follow instructions on your paper to complete gravity model equation For next slide (multiple cities) use web page on board (or GPS on phone) to find distances between cities you choose
1 New York 8, 489, 713 2 Los Angeles California 3, 701, 160 3 Chicago Illinois 2, 901, 633 4 Houston Texas 2, 400, 133 5 Phoenix Arizona 1, 657, 153 6 Philadelphia Pennsylvania 1, 656, 138 7 San Diego California 1, 582, 739 8 San Antonio Texas 1, 391, 022 9 Dallas Texas 1, 383, 776 10 San Jose California 1, 098, 132 11 San Francisco California 817, 411 12 Indianapolis Indiana 798, 382 13 Austin Texas 757, 688 14 Columbus Ohio 754, 885 15 Detroit Michigan 725, 122
U. S. Migration Patterns Key Issue 2 continued
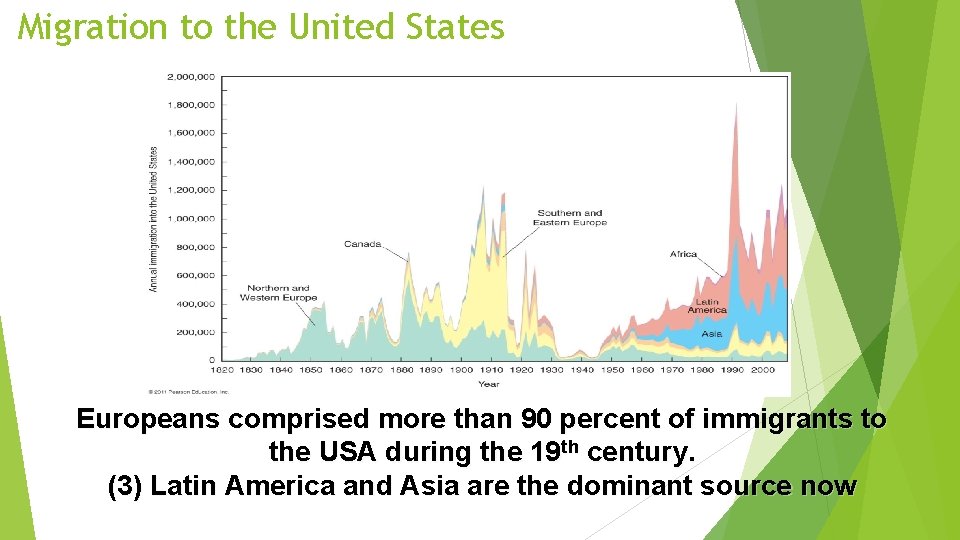
Lets take a look at U. S. migration patterns… About 70 million people have migrated to the US since 1820. Three main eras of migration (1) Colonial migration from England Africa (2) 19 th Century immigration from Europe (3) Recent immigration from LDCs
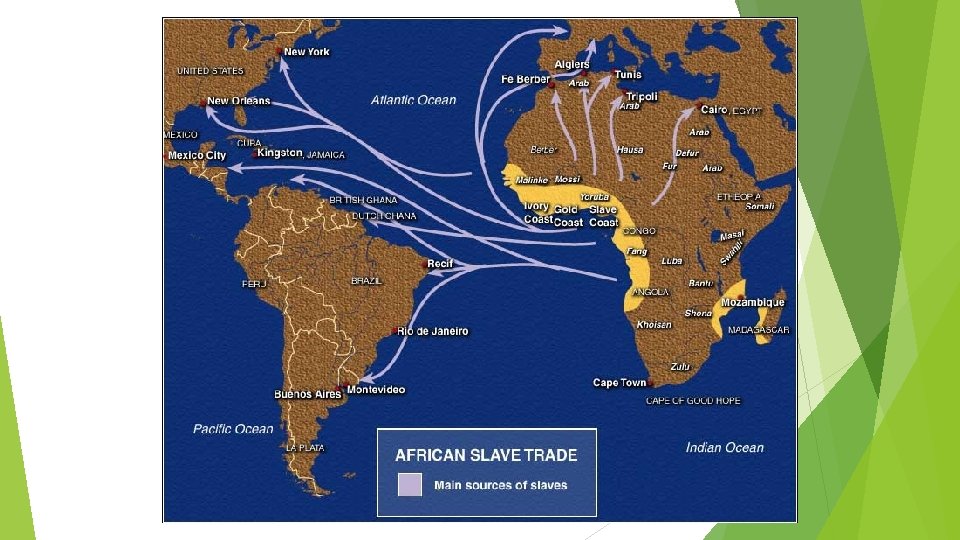
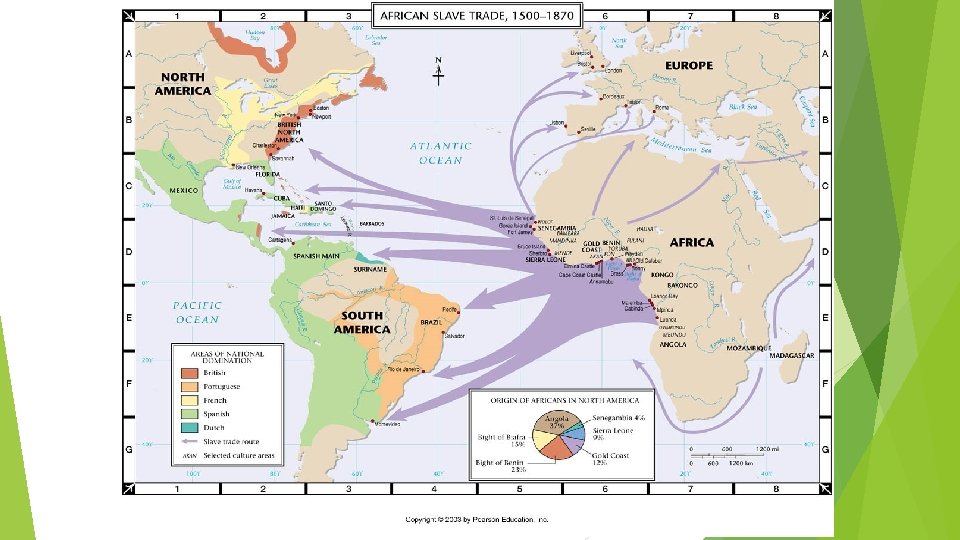
(1) Initial settlement of colonies Europe’s Europe voluntary migrants Before 1776 - 1 million 1776 -1840 - another 1 million Africa Forced Migration- Slaves Over 400, 000 Africans were shipped to the American colonies during the 1700 s Even though the slave trade was made illegal in 1808, another 250, 000 were brought over.
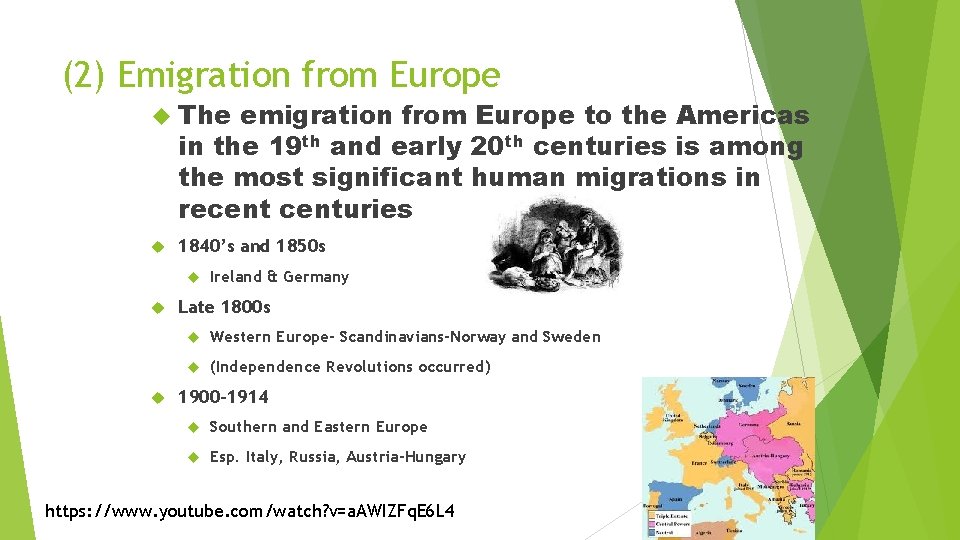
(2) Emigration from Europe The emigration from Europe to the Americas in the 19 th and early 20 th centuries is among the most significant human migrations in recenturies 1840’s and 1850 s Ireland & Germany Late 1800 s Western Europe- Scandinavians-Norway and Sweden (Independence Revolutions occurred) 1900 -1914 Southern and Eastern Europe Esp. Italy, Russia, Austria-Hungary https: //www. youtube. com/watch? v=a. AWIZFq. E 6 L 4
Migration to the United States Europeans comprised more than 90 percent of immigrants to the USA during the 19 th century. (3) Latin America and Asia are the dominant source now
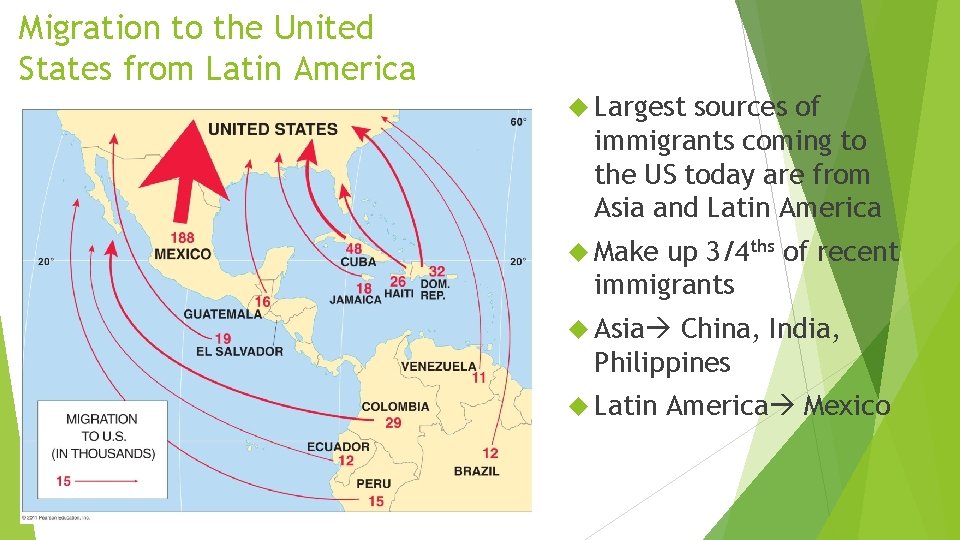
Migration to the United States from Latin America Largest sources of immigrants coming to the US today are from Asia and Latin America Make up 3/4 ths of recent immigrants Asia China, India, Philippines Latin America Mexico
Impact of Immigration on the US
Legacy of European Migration Europe’s Demographic Transition European migration to the US ended w/ the start of WWI The era of massive European migration started because of DT in Europe Now that most European countries are in Stage 4, people aren’t moving to the US for work Diffusion of European Culture Spread language and religion Indo-European Christianity Political structures Political dominance over indigenous cultures, imposing political boundaries (Africa/Asia) Economic systems Use of former colonies for their resources
Unauthorized/undocumented immigration to the United States Unauthorized/undocumented immigrants are people who immigrate without proper documents. Estimated 11. 9 million unauthorized/ undocumented immigrants (2008) Around 59% are undocumented immigrants from Mexico, 22% from other parts of Latin America, and 12% from Asia Most are male (6. 3 million) About 5. 4% of the U. S. civilian labor force (8. 3 million working mostly in hospitality, construction, agriculture)
Unauthorized/undocumented immigration to the United States Destinations California = one-fifth of all immigrants and onefourth of undocumented immigrants New York = one-sixth of all immigrants Florida and Texas are also leading destinations Chain migration Migration of people to a specific location because relatives or members of the same nationality previously migrated there http: //www. nytimes. com/2013 /09/24/us/immigrantpopulation-shows-signs-ofgrowth-estimatesshow. html? _r=0 Jobs attract immigrants to the South and West Industrial jobs related to food processing such as meat packing http: //www. brookings. edu/res earch/reports/2013/06/18 temporary-workers-wilson
Why Do Migrants Face Obstacles? Key Issue 3
Immigration policies of host countries: USA U. S. Quota Laws These limit the number of foreign citizens who can migrate here permanently Quota= max # of people who can migrate during a one year period from each country. These were originally designed to ensure that most migrants would be from Europe The Quota Act (1921) and The National Origins Act (1924) Individual countries had quotas Immigration Act of 1965 Quotas based on hemispheres: 170, 000 from the Eastern Hemisphere and 120, 000 from the Western Hemisphere Immigration Act of 1978 Global Quota of 290, 000, including a max of 20, 000 per country Currently max of 620, 000 with no more than 7% from one country Congress makes preferences: ¾ of immigrants admitted are to reunify families ¼ go to skilled workers and talented professionals (brain drain). Others are admitted by lottery system. These do NOT include refugees
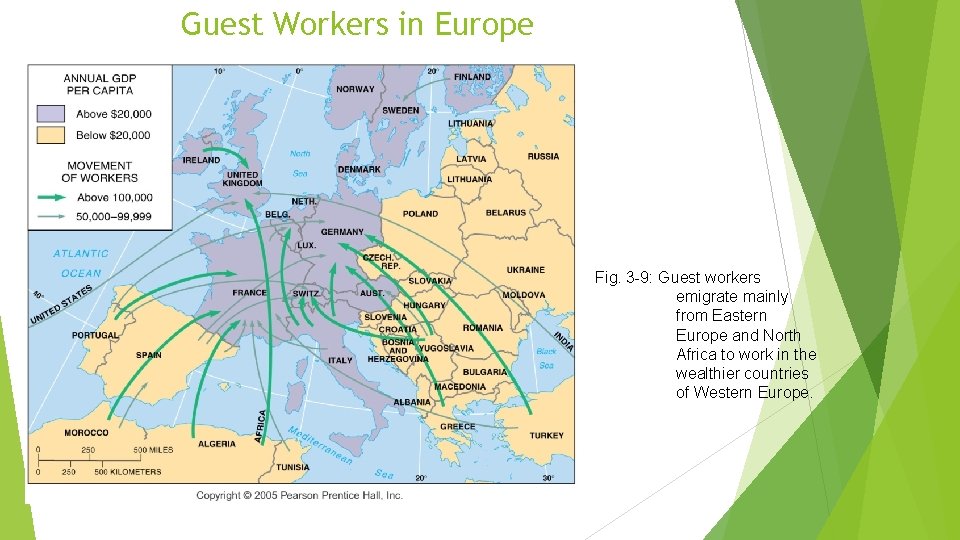
Guest Workers or Time-Contract Workers Guest workers – migrants whom a country allows in to fill a labor need, assuming the workers will go “home” once the labor need subsides. - began post WWII for countries losing many men -short term work visas - send remittances to home country - France-many from Algeria - Germany-many from Turkey, Eastern Europe
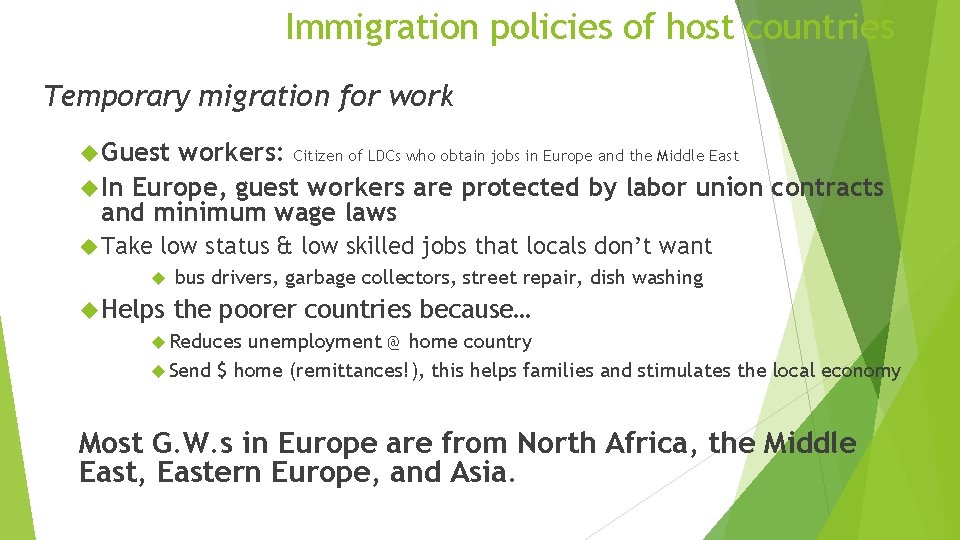
Immigration policies of host countries Temporary migration for work Guest workers: Citizen of LDCs who obtain jobs in Europe and the Middle East In Europe, guest workers are protected by labor union contracts and minimum wage laws Take low status & low skilled jobs that locals don’t want Helps bus drivers, garbage collectors, street repair, dish washing the poorer countries because… Reduces unemployment @ home country Send $ home (remittances!), this helps families and stimulates the local economy Most G. W. s in Europe are from North Africa, the Middle East, Eastern Europe, and Asia.
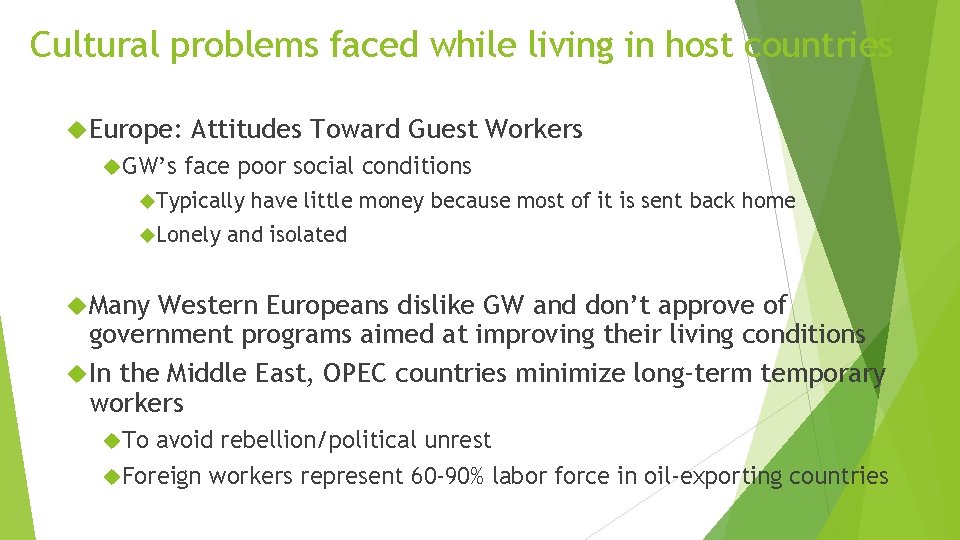
Cultural problems faced while living in host countries Europe: GW’s Attitudes Toward Guest Workers face poor social conditions Typically Lonely have little money because most of it is sent back home and isolated Many Western Europeans dislike GW and don’t approve of government programs aimed at improving their living conditions In the Middle East, OPEC countries minimize long-term temporary workers To avoid rebellion/political unrest Foreign workers represent 60 -90% labor force in oil-exporting countries
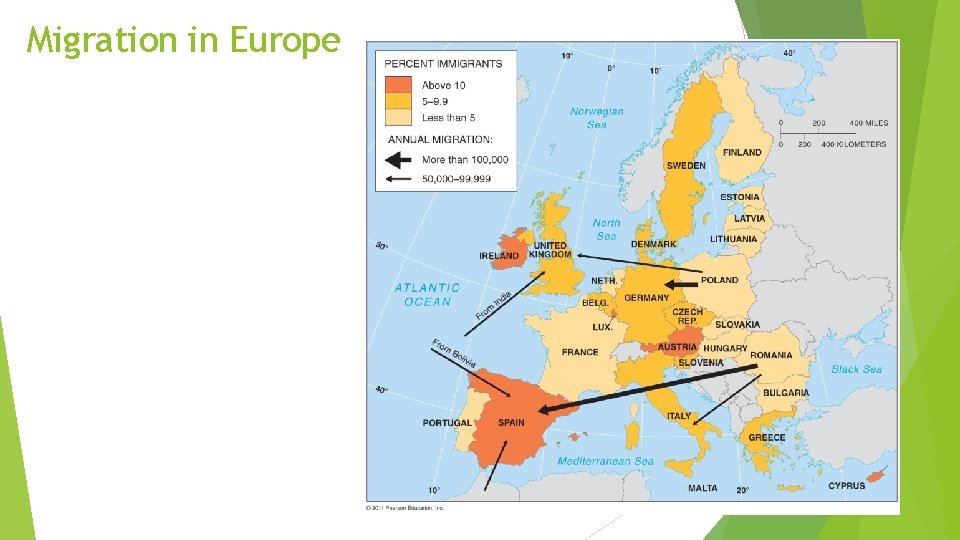
Guest Workers in Europe Fig. 3 -9: Guest workers emigrate mainly from Eastern Europe and North Africa to work in the wealthier countries of Western Europe.
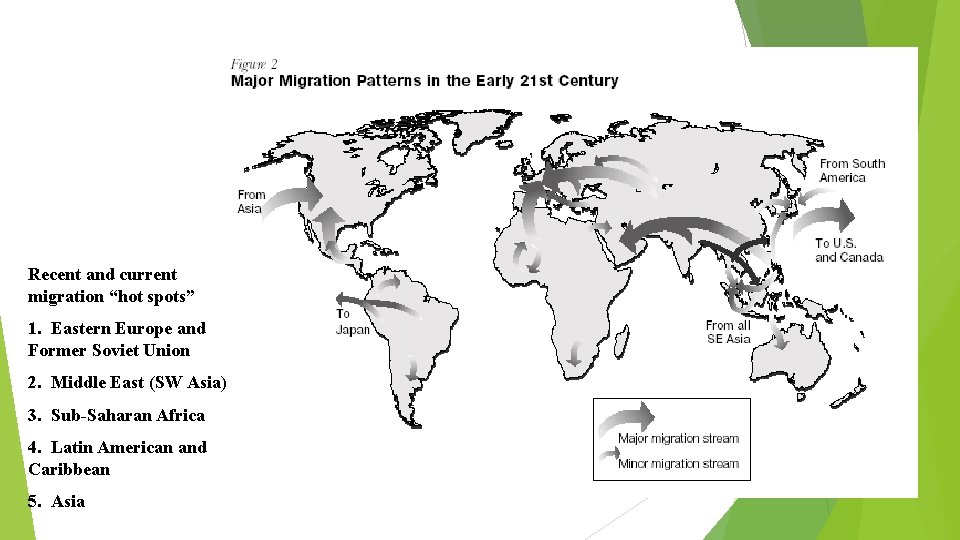
Recent and current migration “hot spots” 1. Eastern Europe and Former Soviet Union 2. Middle East (SW Asia) 3. Sub-Saharan Africa 4. Latin American and Caribbean 5. Asia
Distinguishing economic migrants from political refugees This is important because they are treated differently Economic migrants are admitted mostly b/c of special skills or close relatives Migrants/Guest workers are legal (most of the time) who have work visas. Destination country can extend/stop visas Refugees get special priority, are offered asylum (right to protection) to which migrants are not entitled. Repatriation- One conditions approve in the country of the refugee, UNHCR helps return them to homeland
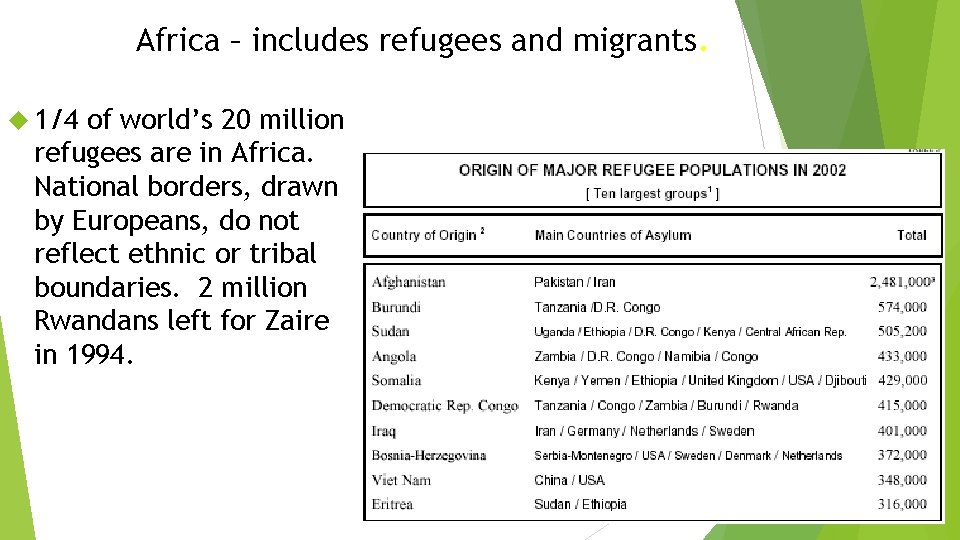
Africa – includes refugees and migrants. 1/4 of world’s 20 million refugees are in Africa. National borders, drawn by Europeans, do not reflect ethnic or tribal boundaries. 2 million Rwandans left for Zaire in 1994.
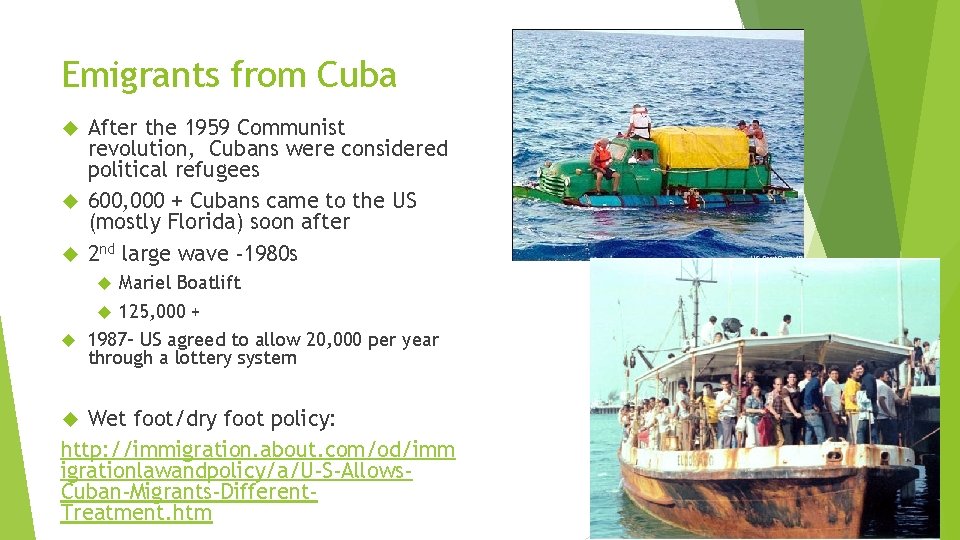
Emigrants from Cuba After the 1959 Communist revolution, Cubans were considered political refugees 600, 000 + Cubans came to the US (mostly Florida) soon after 2 nd large wave -1980 s Mariel Boatlift 125, 000 + 1987 - US agreed to allow 20, 000 per year through a lottery system Wet foot/dry foot policy: http: //immigration. about. com/od/imm igrationlawandpolicy/a/U-S-Allows. Cuban-Migrants-Different. Treatment. htm
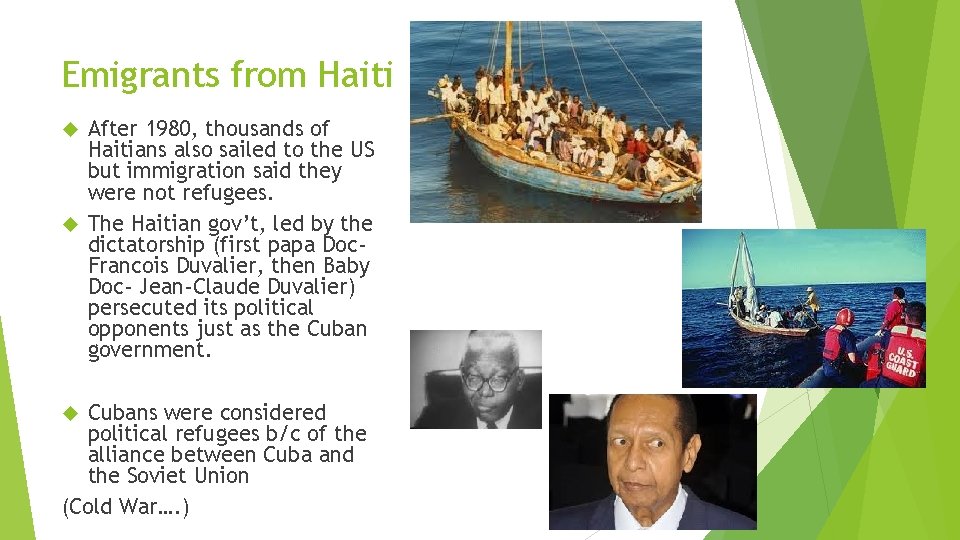
Emigrants from Haiti After 1980, thousands of Haitians also sailed to the US but immigration said they were not refugees. The Haitian gov’t, led by the dictatorship (first papa Doc. Francois Duvalier, then Baby Doc- Jean-Claude Duvalier) persecuted its political opponents just as the Cuban government. Cubans were considered political refugees b/c of the alliance between Cuba and the Soviet Union (Cold War…. )
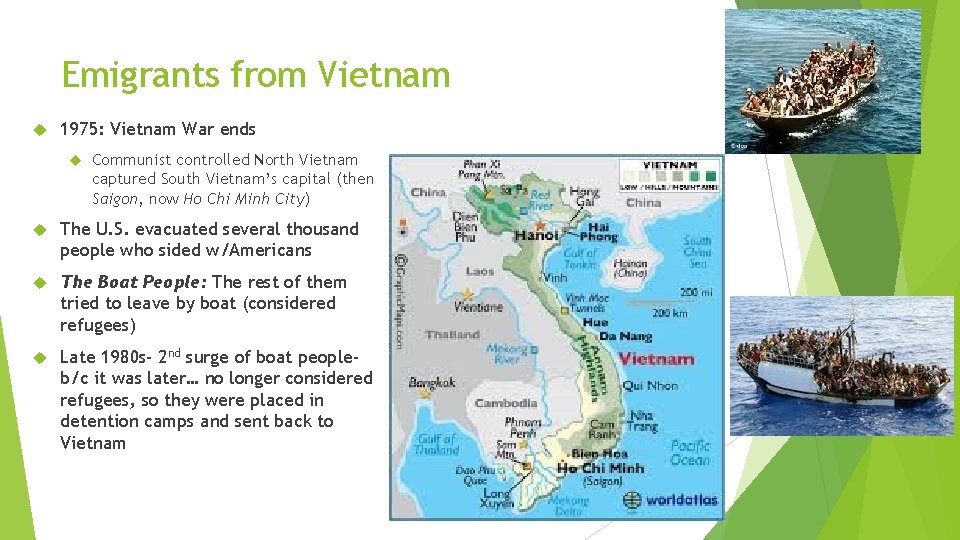
Emigrants from Vietnam 1975: Vietnam War ends Communist controlled North Vietnam captured South Vietnam’s capital (then Saigon, now Ho Chi Minh City) The U. S. evacuated several thousand people who sided w/Americans The Boat People: The rest of them tried to leave by boat (considered refugees) Late 1980 s- 2 nd surge of boat peopleb/c it was later… no longer considered refugees, so they were placed in detention camps and sent back to Vietnam
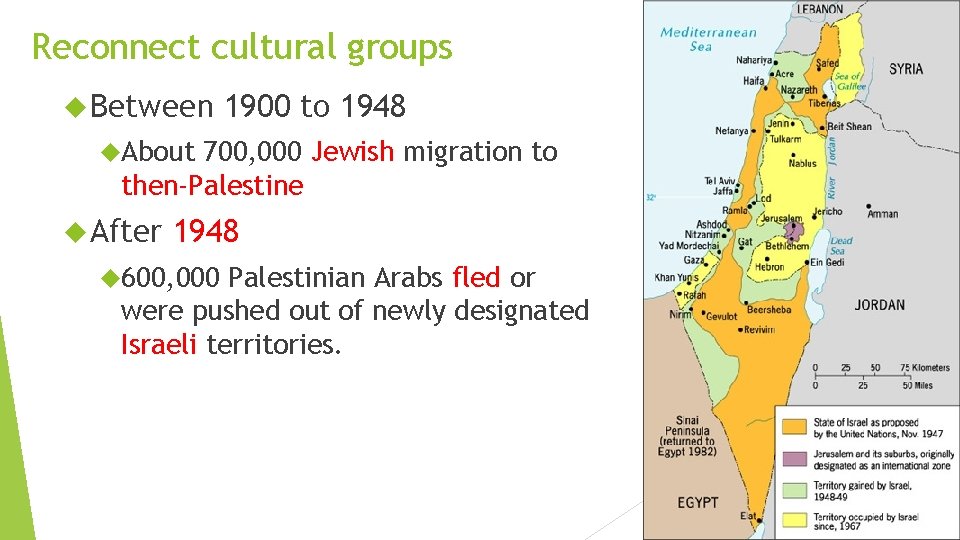
Reconnect cultural groups Between 1900 to 1948 About 700, 000 Jewish migration to then-Palestine After 1948 600, 000 Palestinian Arabs fled or were pushed out of newly designated Israeli territories.
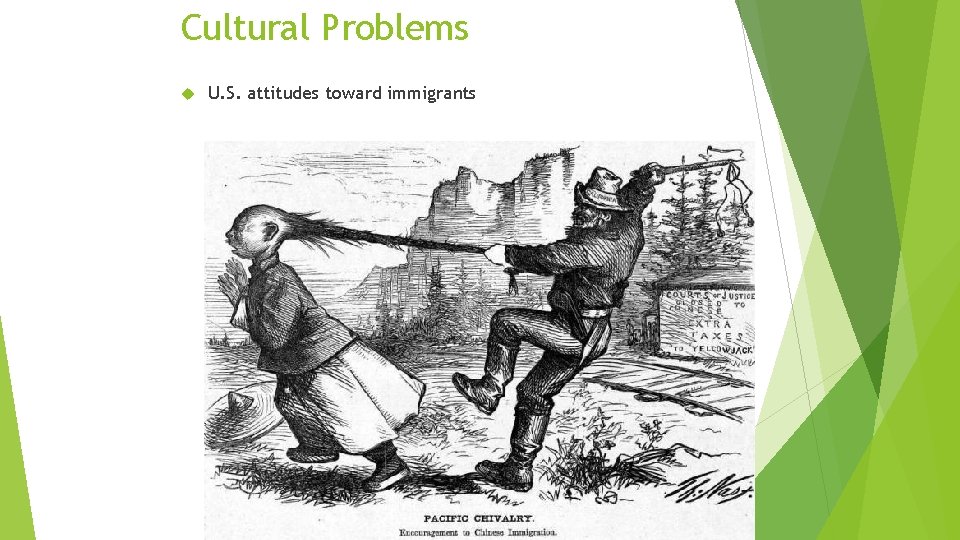
Cultural problems faced while living in host countries U. S. Attitudes Towards Immigrants Hostility Racism Assimilation Voting to deny unauthorized immigrants access to public services
Cultural Problems U. S. attitudes toward immigrants
Key Issue #4 Why Do People Migrate Within a Country?
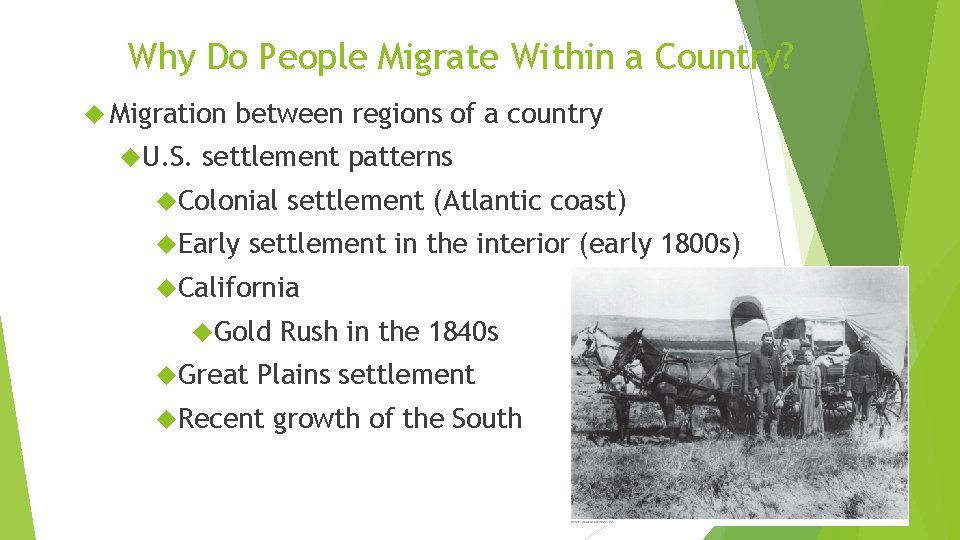
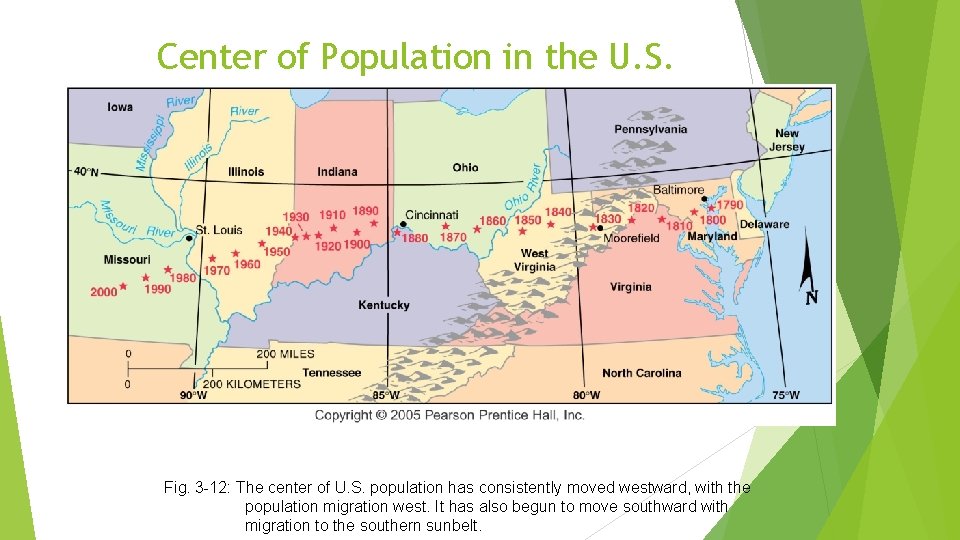
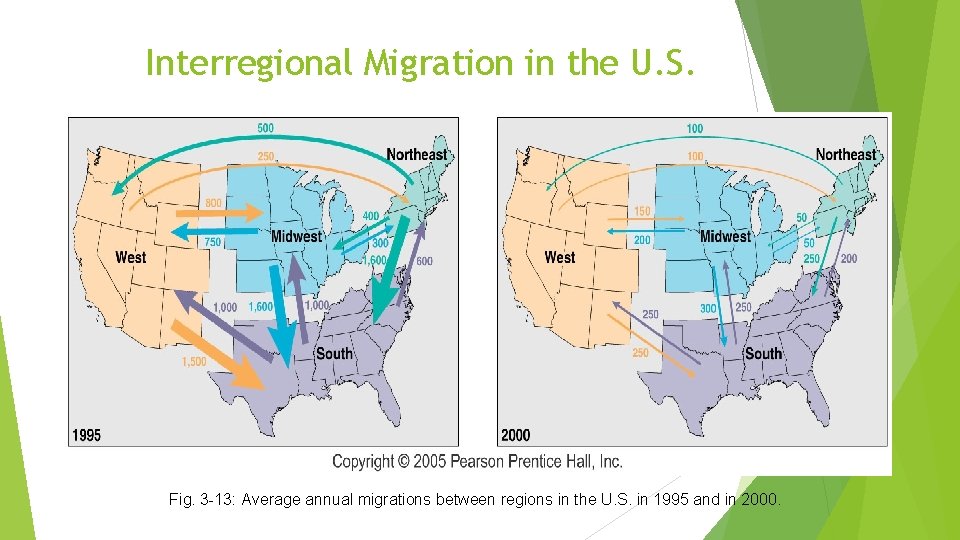
Why Do People Migrate Within a Country? Migration U. S. between regions of a country settlement patterns Colonial Early settlement (Atlantic coast) settlement in the interior (early 1800 s) California Gold Great Rush in the 1840 s Plains settlement Recent growth of the South
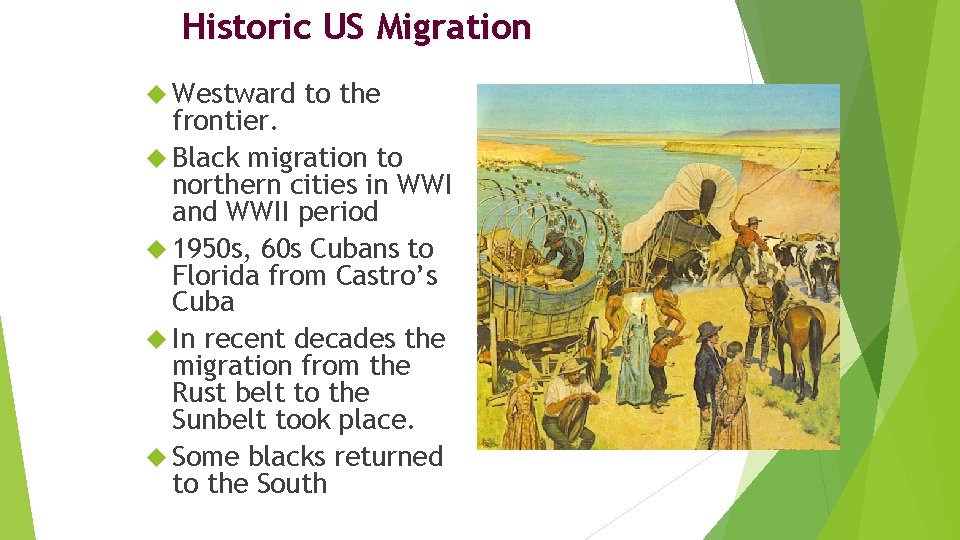
Historic US Migration Westward to the frontier. Black migration to northern cities in WWI and WWII period 1950 s, 60 s Cubans to Florida from Castro’s Cuba In recent decades the migration from the Rust belt to the Sunbelt took place. Some blacks returned to the South
Center of Population in the U. S. Fig. 3 -12: The center of U. S. population has consistently moved westward, with the population migration west. It has also begun to move southward with migration to the southern sunbelt.
Interregional Migration in the U. S. Fig. 3 -13: Average annual migrations between regions in the U. S. in 1995 and in 2000.
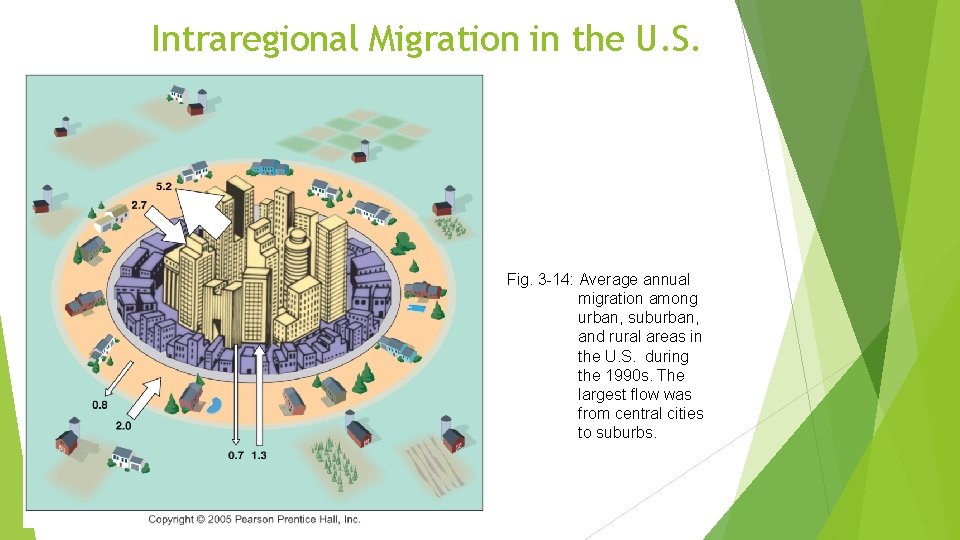
Why Do People Migrate Within a Country? Intraregional migration in the United States Migration from rural to urban areas Primary reason = economic migration Migration from urban to suburban areas Primary Migration reason = suburban lifestyle from urban to rural areas Counterurbanization
Intraregional Migration in the U. S. Fig. 3 -14: Average annual migration among urban, suburban, and rural areas in the U. S. during the 1990 s. The largest flow was from central cities to suburbs.
Migration in Europe